
Opportunity Zones
How and Where Have Opportunity Zone Funds Been Used in the City?
At the same time the federal government is proposing cuts to major federal housing and homelessness programs, they are also considering an expansion of the Opportunity Zone (OZ) program, including a renewal of it in its proposed tax bill.1 HUD Secretary Scott Turner recently spoke of the program in glowing terms, saying it “brought $84 billion of private investment. One million people have gotten lifted off the poverty rolls. Home values and Opportunity Zones have risen, while rents did not go up.”2
Given the increased federal interest in Opportunity Zones as a housing program, the rest of this report considers the relationship between the program and new housing development in New York City. While we are not able to conduct a causal analysis of the program’s impact, we look at descriptive trends. First, in this section, we compare the characteristics of OZs, eligible but not designated tracts, and the city as a whole to better understand which neighborhoods were targeted by the program. Identifying any differences between the geographies offers insight into the types of neighborhoods and residents that may have benefited from OZ designation (and assuming the designations remain the same in the current presidential administration, may receive investments in the coming years).
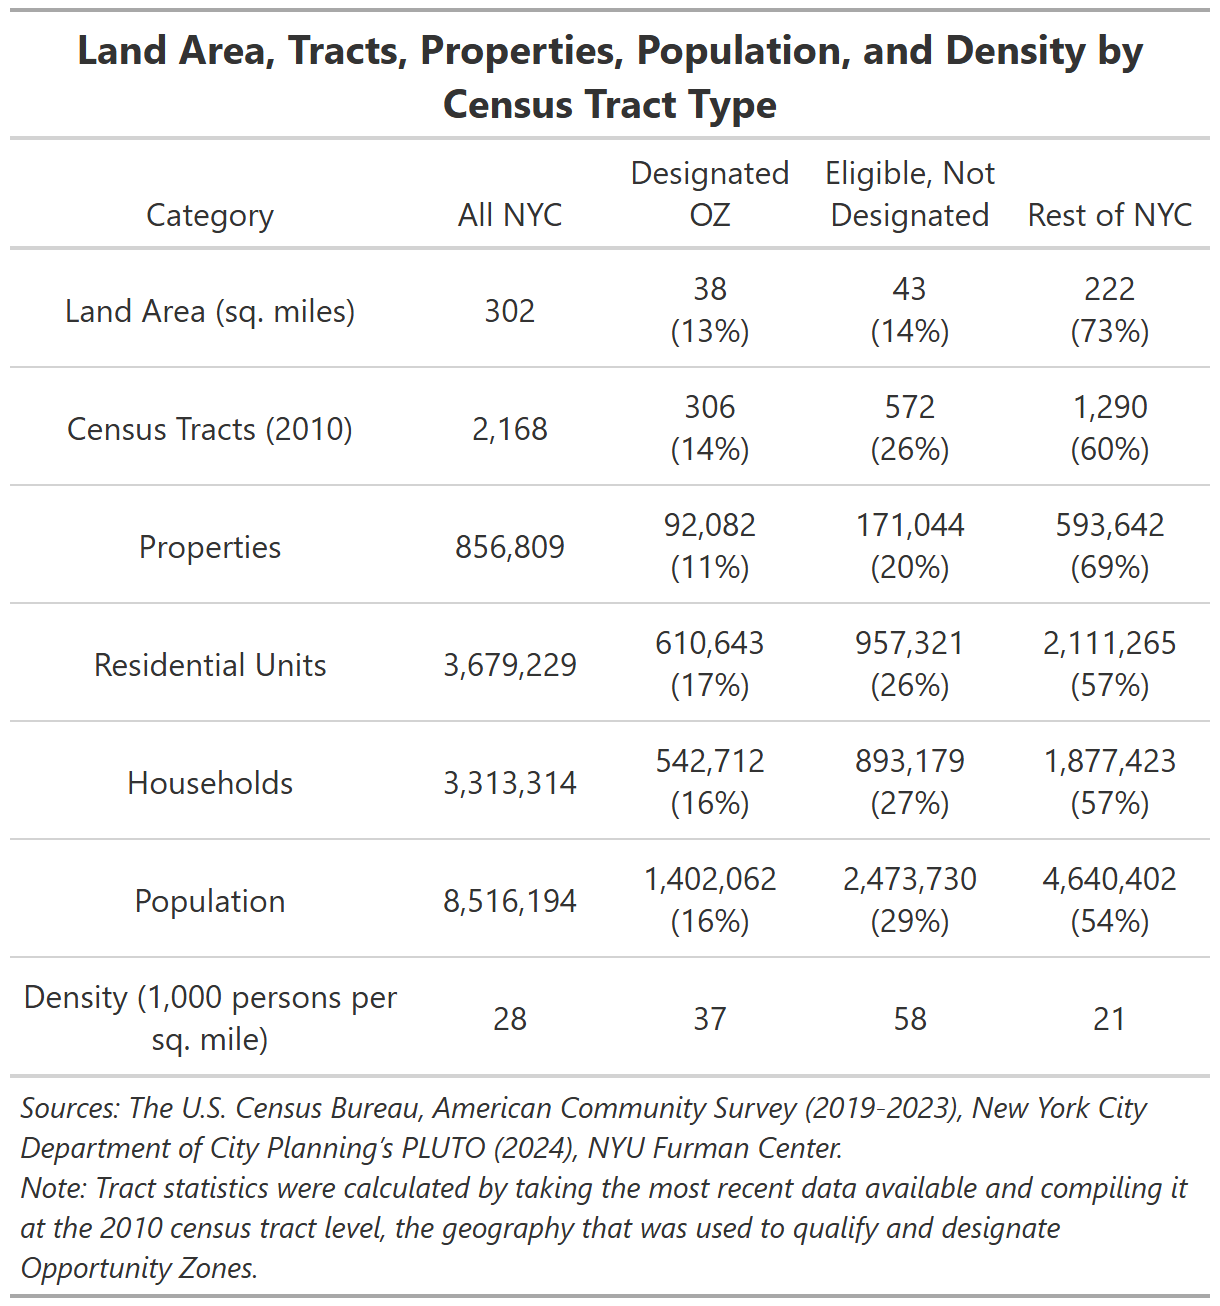
Areas designated as Opportunity Zones make up 11 percent of the city’s properties and 16 percent of its population, and are denser than the city as a whole.
As Table 1 shows, the total land area covered by designated OZ tracts is slightly smaller than that of eligible but not designated tracts, making up 13 percent and 14 percent of New York City’s land area, respectively. A total of 306 of the 2010 census tracts were designated out of 878 eligible tracts, leaving behind 572 eligible but not designated tracts.3 Overall, the eligible tracts account for 40 percent of the city’s tracts. Finally, OZ-designated tracts are denser than the city as a whole, but less dense than the tracts that were eligible for designation but not selected.
Table 1:
Residents of census tracts either designated as Opportunity Zones or that were eligible but not selected, had higher poverty rates and lower incomes than the city overall.
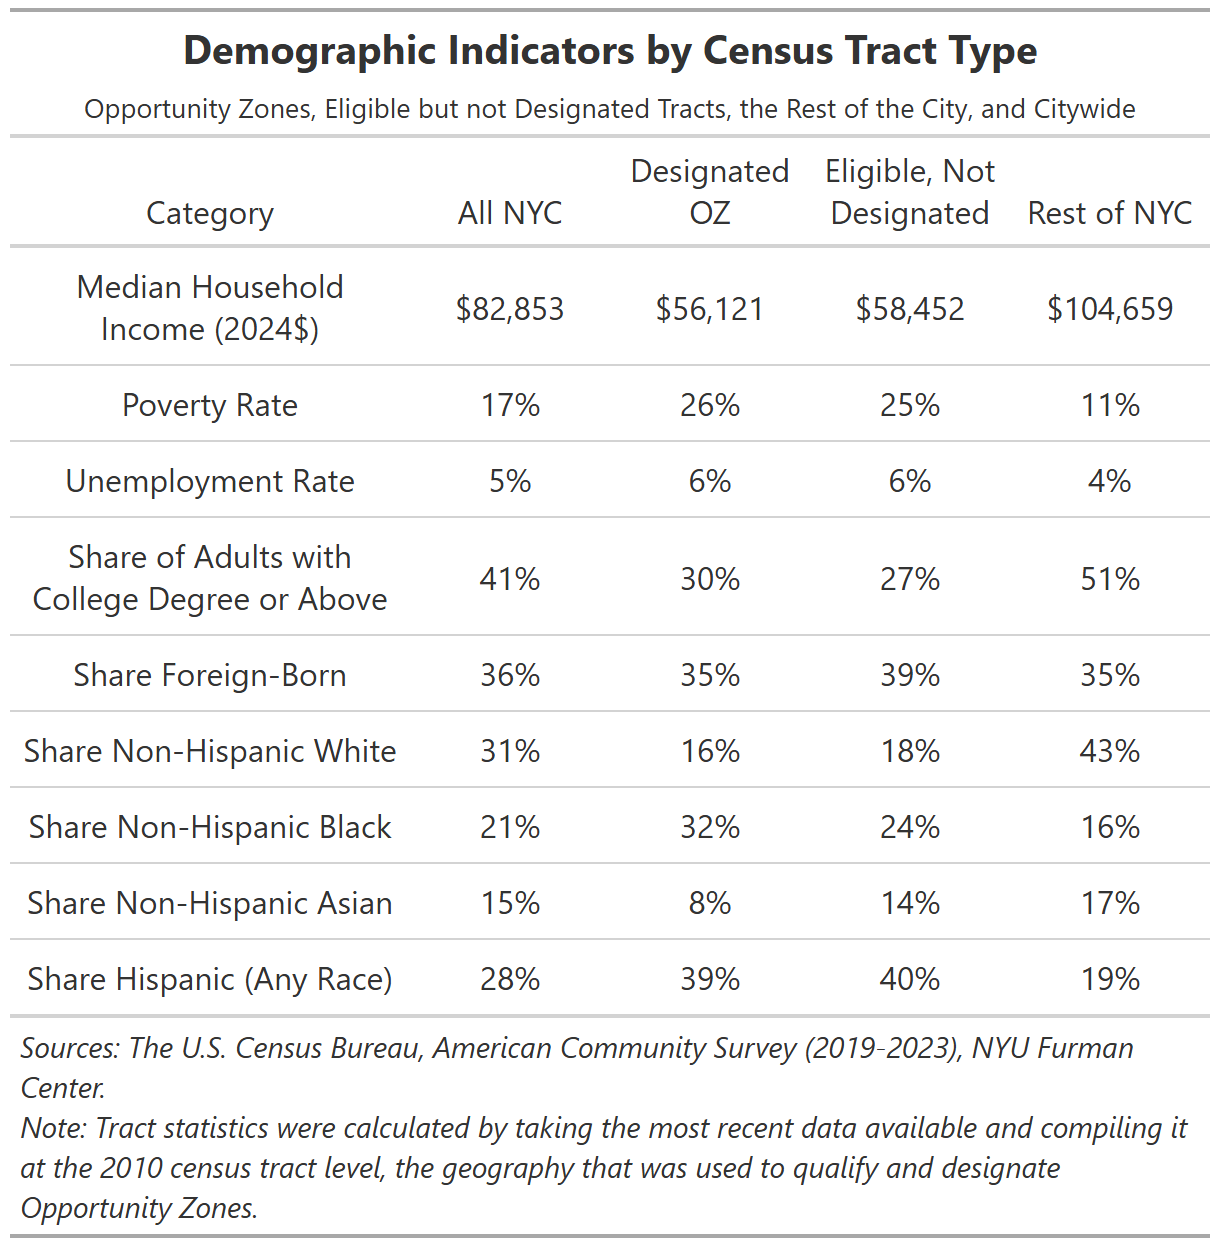
Residents of census tracts designated as OZs in 2018 and those that were eligible but not chosen for the program still had lower incomes and higher poverty rates as of 2023 than the city overall (Table 2). In both OZ tracts and eligible but not designated tracts, about a quarter of people live below the poverty line, compared to 17 percent of the city overall. Median household incomes are somewhat lower in designated tracts compared to eligible but not designated ones, however, incomes in both designated and eligible non-designated tracts are 46 and 44 percent lower than in the rest of the city, respectively. People living in designated and eligible but not designated census tracts are also less likely to be college-educated and slightly more likely to be unemployed.
In terms of race and ethnicity, residents of OZs are more likely to be non-Hispanic Black and less likely to be non-Hispanic Asian than eligible non-designated tracts and the city overall. A larger share of people living in both OZs and eligible but not designated tracts are Hispanic of any race, and a lower share are non-Hispanic white. The share of the population that was born abroad is very slightly lower in OZs compared to the city as a whole.
Some of these demographic differences are largely a function of the program’s eligibility requirements. To qualify, census tracts had to either have a poverty rate of at least 20 percent, or a median family income below 80 percent of the state or metropolitan area median. 4 Governors were also allowed to designate up to 5 percent of tracts that did not meet these thresholds, provided they were contiguous to an eligible tract and had a median family income no more than 125 percent of the adjacent tract. The design of the program did not account for changes in neighborhood conditions over time: once designated, OZs remained fixed for a ten-year period.5
Table 2:
Opportunity zones have lower median rents compared to eligible but not designated tracts and the city as a whole, in part because they also have higher shares of rent-stabilized, subsidized, and NYCHA housing.
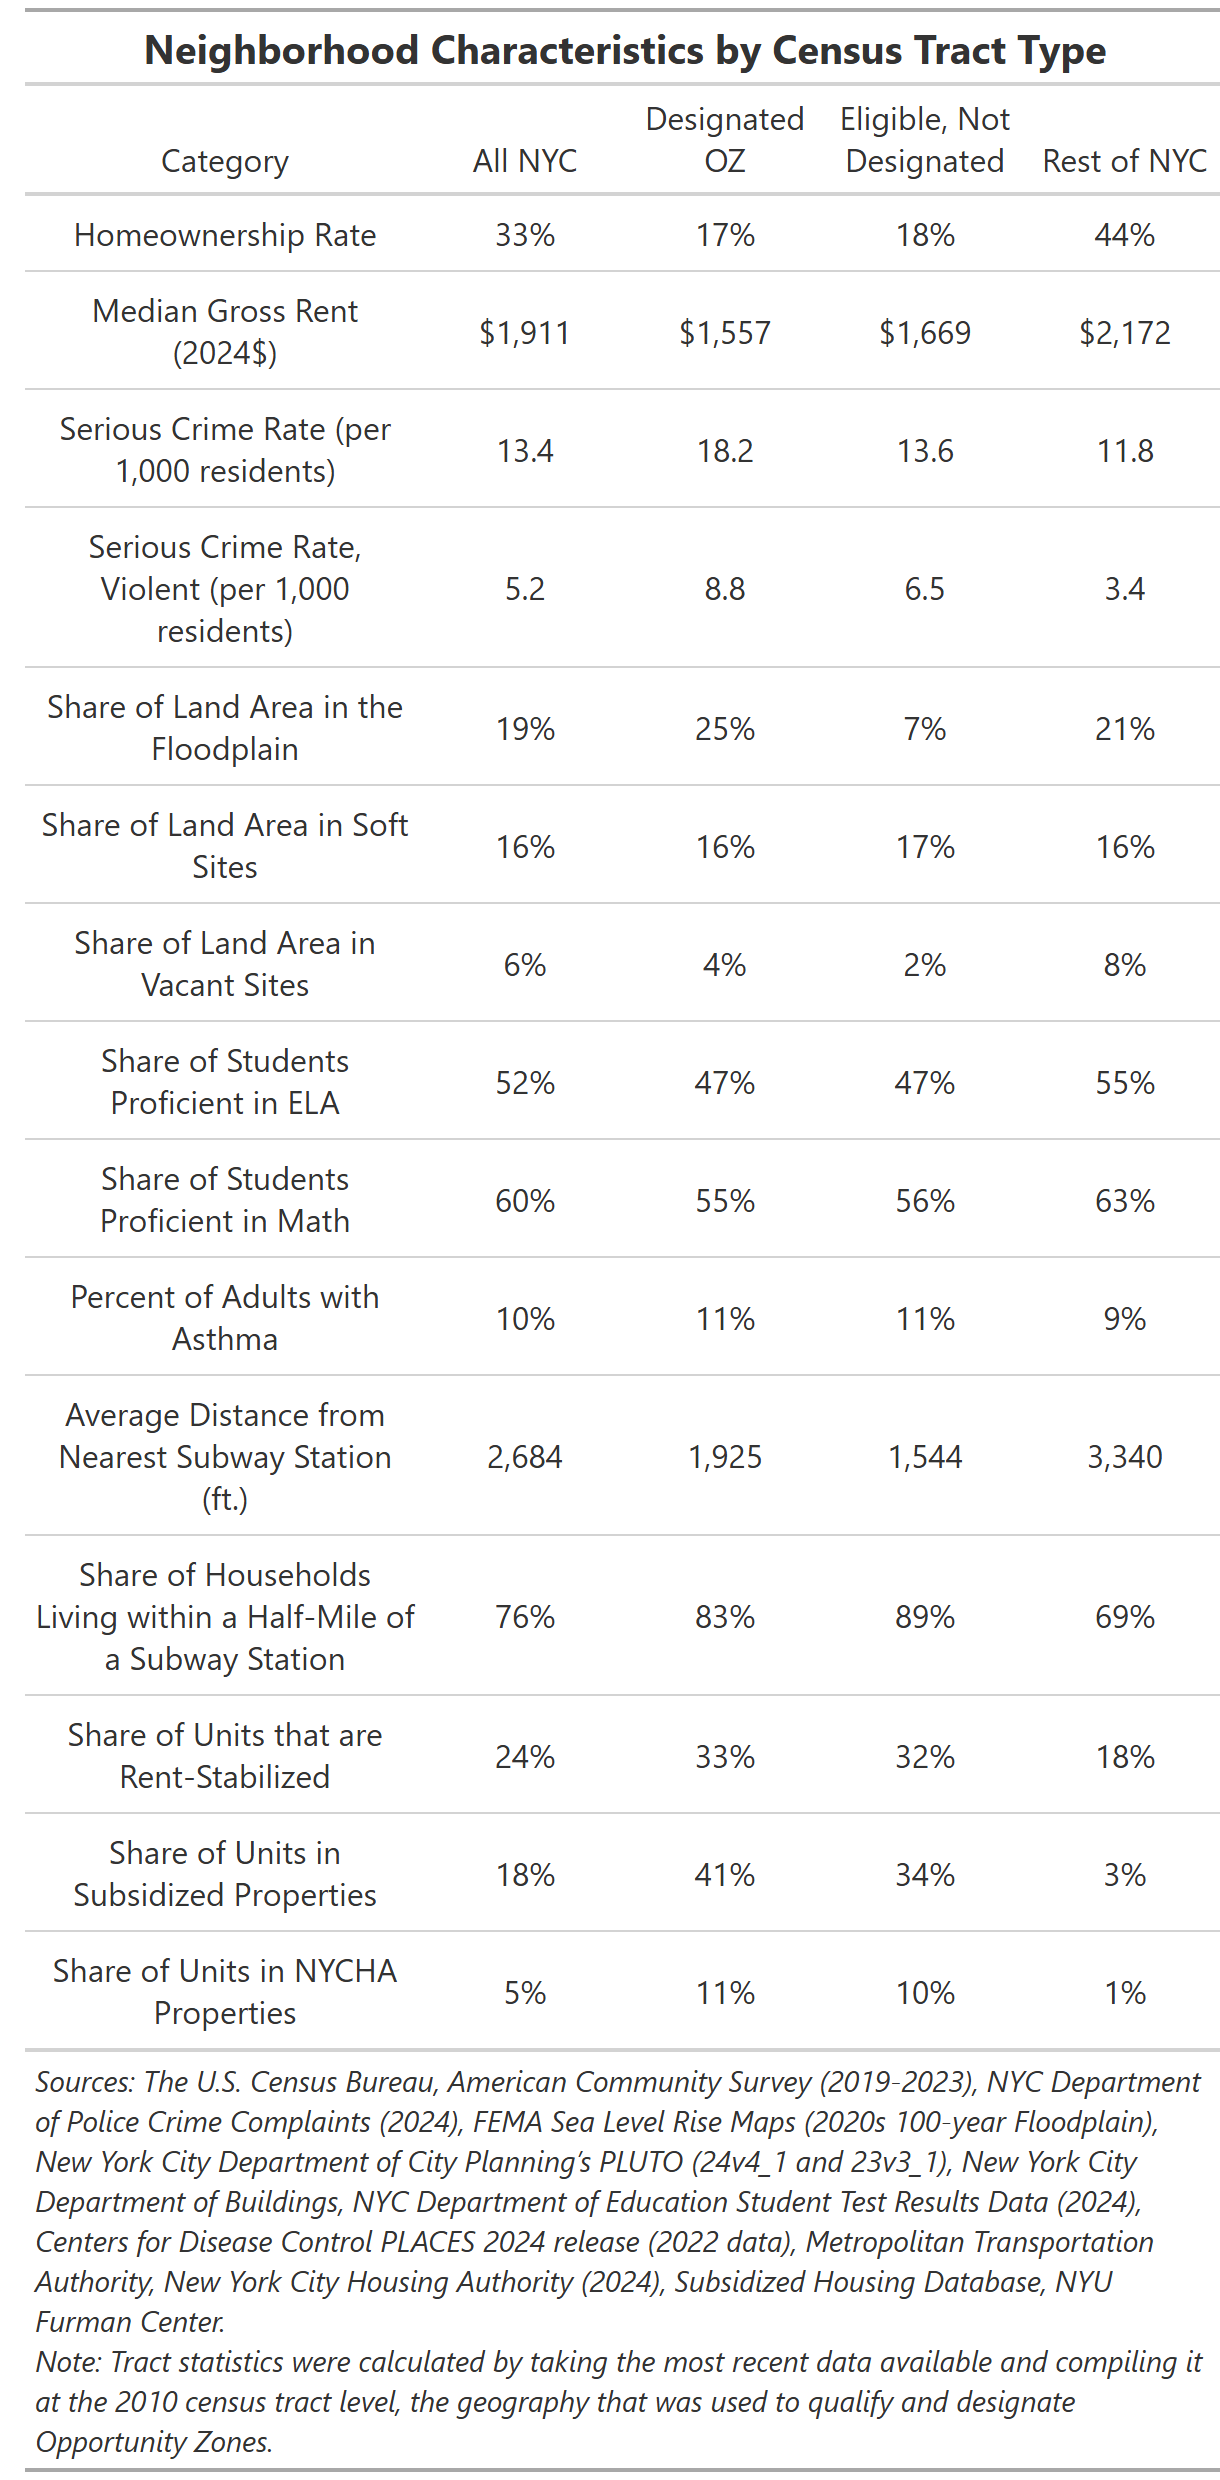
Compared to the city as a whole, both designated and eligible but not designated tracts have lower homeownership rates (Table 3). Designated tracts also have lower median gross rents6 compared to eligible tracts and the city as a whole. These tracts offer more affordable housing for low-income New Yorkers than others, in part because they contain a high share of housing already occupied by or affordable to low-income residents. OZs were intended to attract investment to lower-income communities. In New York City, however, lower rents in these tracts also reflect a higher share of rent-stabilized, subsidized, and NYCHA housing than the city as a whole.
Both designated and eligible but not designated OZ census tracts exhibit higher levels of disadvantage than the city as a whole, including lower-performing schools. In both types of tracts, school proficiency scores in English Language Arts and math trail citywide shares by four to five percentage points. While both areas have elevated rates of serious and violent crime compared to the city overall, crime rates are higher in designated OZs.
Many designated and eligible tracts are well-served by the city’s transit network. They offer better subway access than the city as a whole, with eligible but not designated tracts tending to be even more conveniently located compared to designated tracts.
OZs do not appear to be better positioned for new development compared to eligible but not designated tracts and the city overall. OZs have similar shares of land area in “soft sites” (underutilized sites that are sufficiently large, zoned for residential use, and meet other requirements to be considered easily developable).7 Compared to the city as a whole, the OZs also have smaller shares of vacant land, which is more easily repurposed for new development.
Table 3:
Did designated Opportunity Zones see more investment in housing, particularly affordable housing, compared to eligible but not designated zones and the rest of the city overall?
What has been permitted and completed in Opportunity Zones?
The federal government has expressed interest in renewing or expanding the Opportunity Zone (OZ) program, framing it as an engine of economic development. This section examines the relationship between the OZ program and residential housing development in the New York City census tracts designated under the program. While this descriptive analysis surfaces insights on trends, we do not evaluate whether the program actually caused additional development in OZs.8 Instead, using publicly available datasets, we compare trends in various indicators of residential development activity: property sales, demolitions, permitted new construction, and building completions across three types of areas: designated OZs, eligible but not designated tracts, and the rest of the city. Our aim is to consider whether OZ designation may have led to distinct patterns of development activity in those tracts, and to explore whether those potential increases in investment reflect the program’s stated goals of supporting low-income communities.
After Congress established the program, designated OZs experienced a greater increase in the rate of residential development relative to non-designated tracts. However, this trend comes with important caveats. Much of the new development in OZs occurred in contiguous non-low-income designated tracts, and any potential additive investment appears to have been limited to market rate housing. In addition, the timing of the growth does not align with the program’s rollout and likely at least partially reflects local policies–particularly neighborhood-level rezonings of these tracts and the 421-a tax exemption.9
Opportunity Zone Program Timeline
The OZ program timeline is important context for interpreting the figures in this section.
- December 31, 2017: To qualify as an OZ property, an OZ fund had to purchase the property after this date.
- April 2018: New York State’s OZ designations are certified and made public.10 If the OZ program had an impact on sales and demolitions, we would expect to see an increase after this period.
- December 2019: OZ program regulations are finalized and the program is effectively operational.11 We would expect to see any impact of the OZ program on permitting rates after this period, with completions lagging by two to five years (the regulations require that “substantial improvement” be completed within 30 months of acquisition, but if the property is being placed into its “original use” there is no time limit).
Designated Opportunity Zone tracts experienced a sharper increase in the rate of completed residential units after the beginning of the program compared to other areas of the city.
We consider the relationship between OZ designation and housing development in New York City by examining completed units. This indicator is tracked over time in three types of areas: OZ tracts, tracts that were eligible but not designated, and the rest of the city.
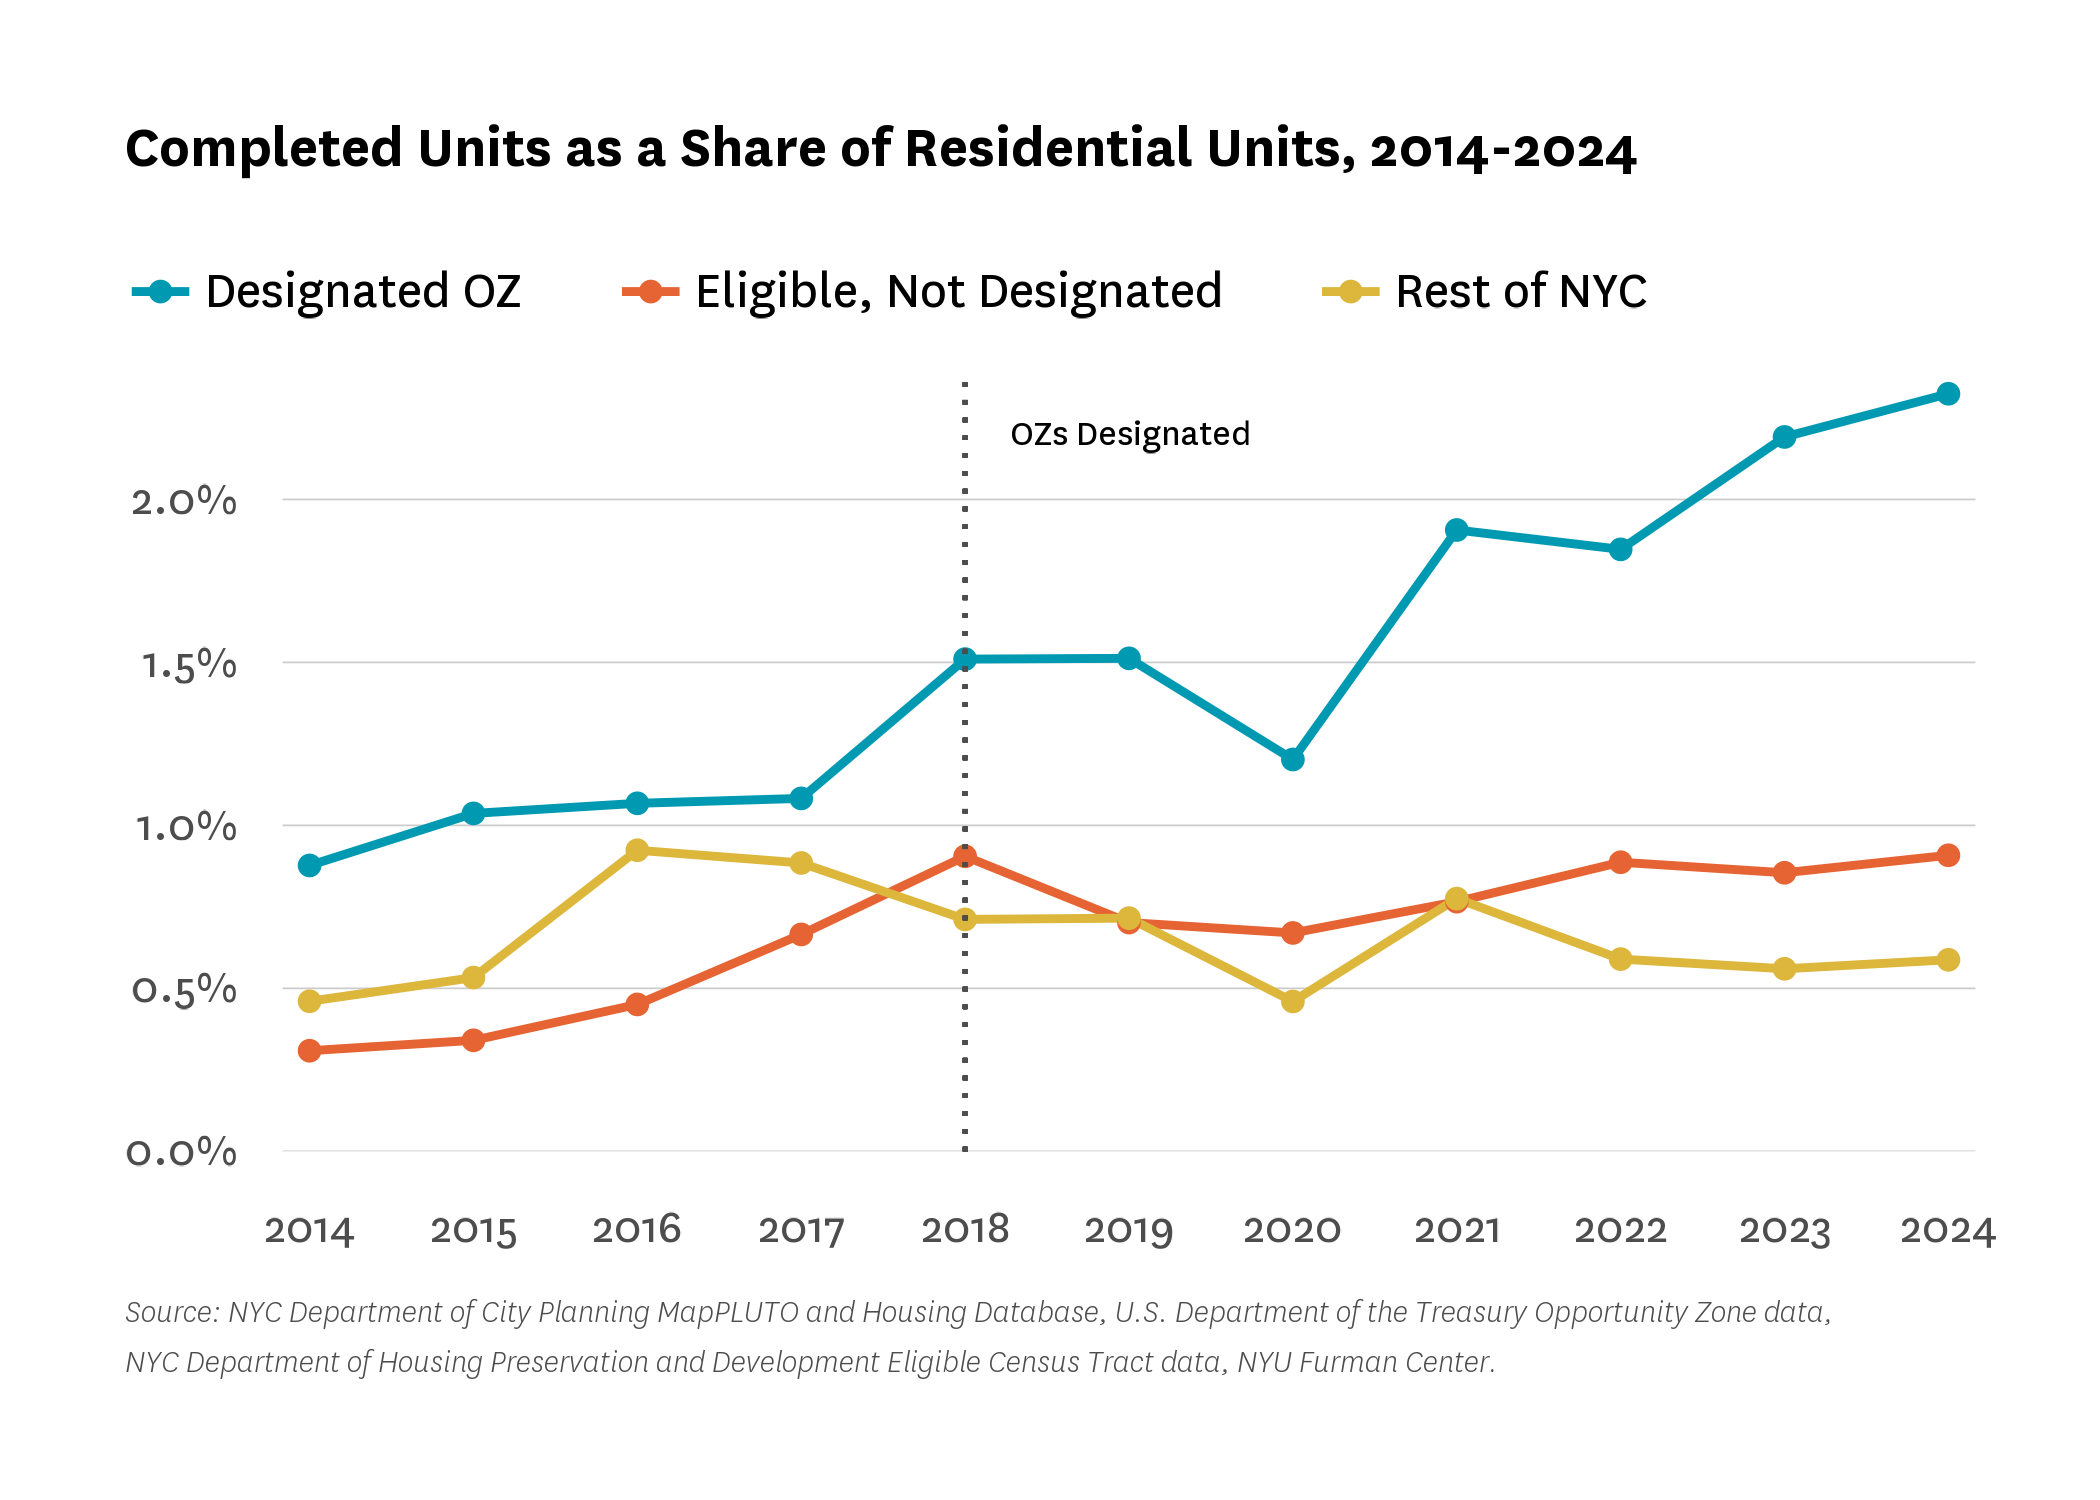
Figure 9 shows the rate of completed residential units (the share of units that are newly completed in a given year12) in OZ tracts after designation. As previously noted, we would expect to see any potential impact of the OZ program reflected in completed properties about two to five years after the program regulations were certified at the end of 2019.
Figure 9 shows that designated OZs saw a greater increase in the rate of completed residential units than other areas of the city after designation. These tracts already exhibited comparatively high development activity prior to the program’s creation in 2017. Between 2015 and 2017, the gap in completion rates between OZs and eligible but not designated tracts began to converge, but that gap widened again in 2018 and 2019—before program regulations were certified—and continued to diverge through 2024. As Figure 9 shows, completions dipped sharply in 2020, consistent with COVID-19-related construction delays. But beginning in 2021, OZs returned to a comparatively higher completion rate that increased faster than rates in eligible but not designated tracts, a trend that persisted through 2024.
As we discuss in more detail below, a number of reasons could contribute to the difference in trends between OZs and eligible but not designated tracts. The OZ program could in fact be driving additional investment into designated tracts. Alternatively or additionally, the designated OZs could have been selected because they were already well-positioned for development. For example, they could be located in tracts that have more “soft sites” which were ready for new development or that have higher levels of allowable density. This could be unintentional or there could be selection bias: the city and state could have intentionally chosen tracts that were expected to grow in the next few years in order to try and capture the benefits of the program. Finally, the OZ program could interact with favorable conditions in designated tracts and other development programs to amplify their impact.
Figure 9:
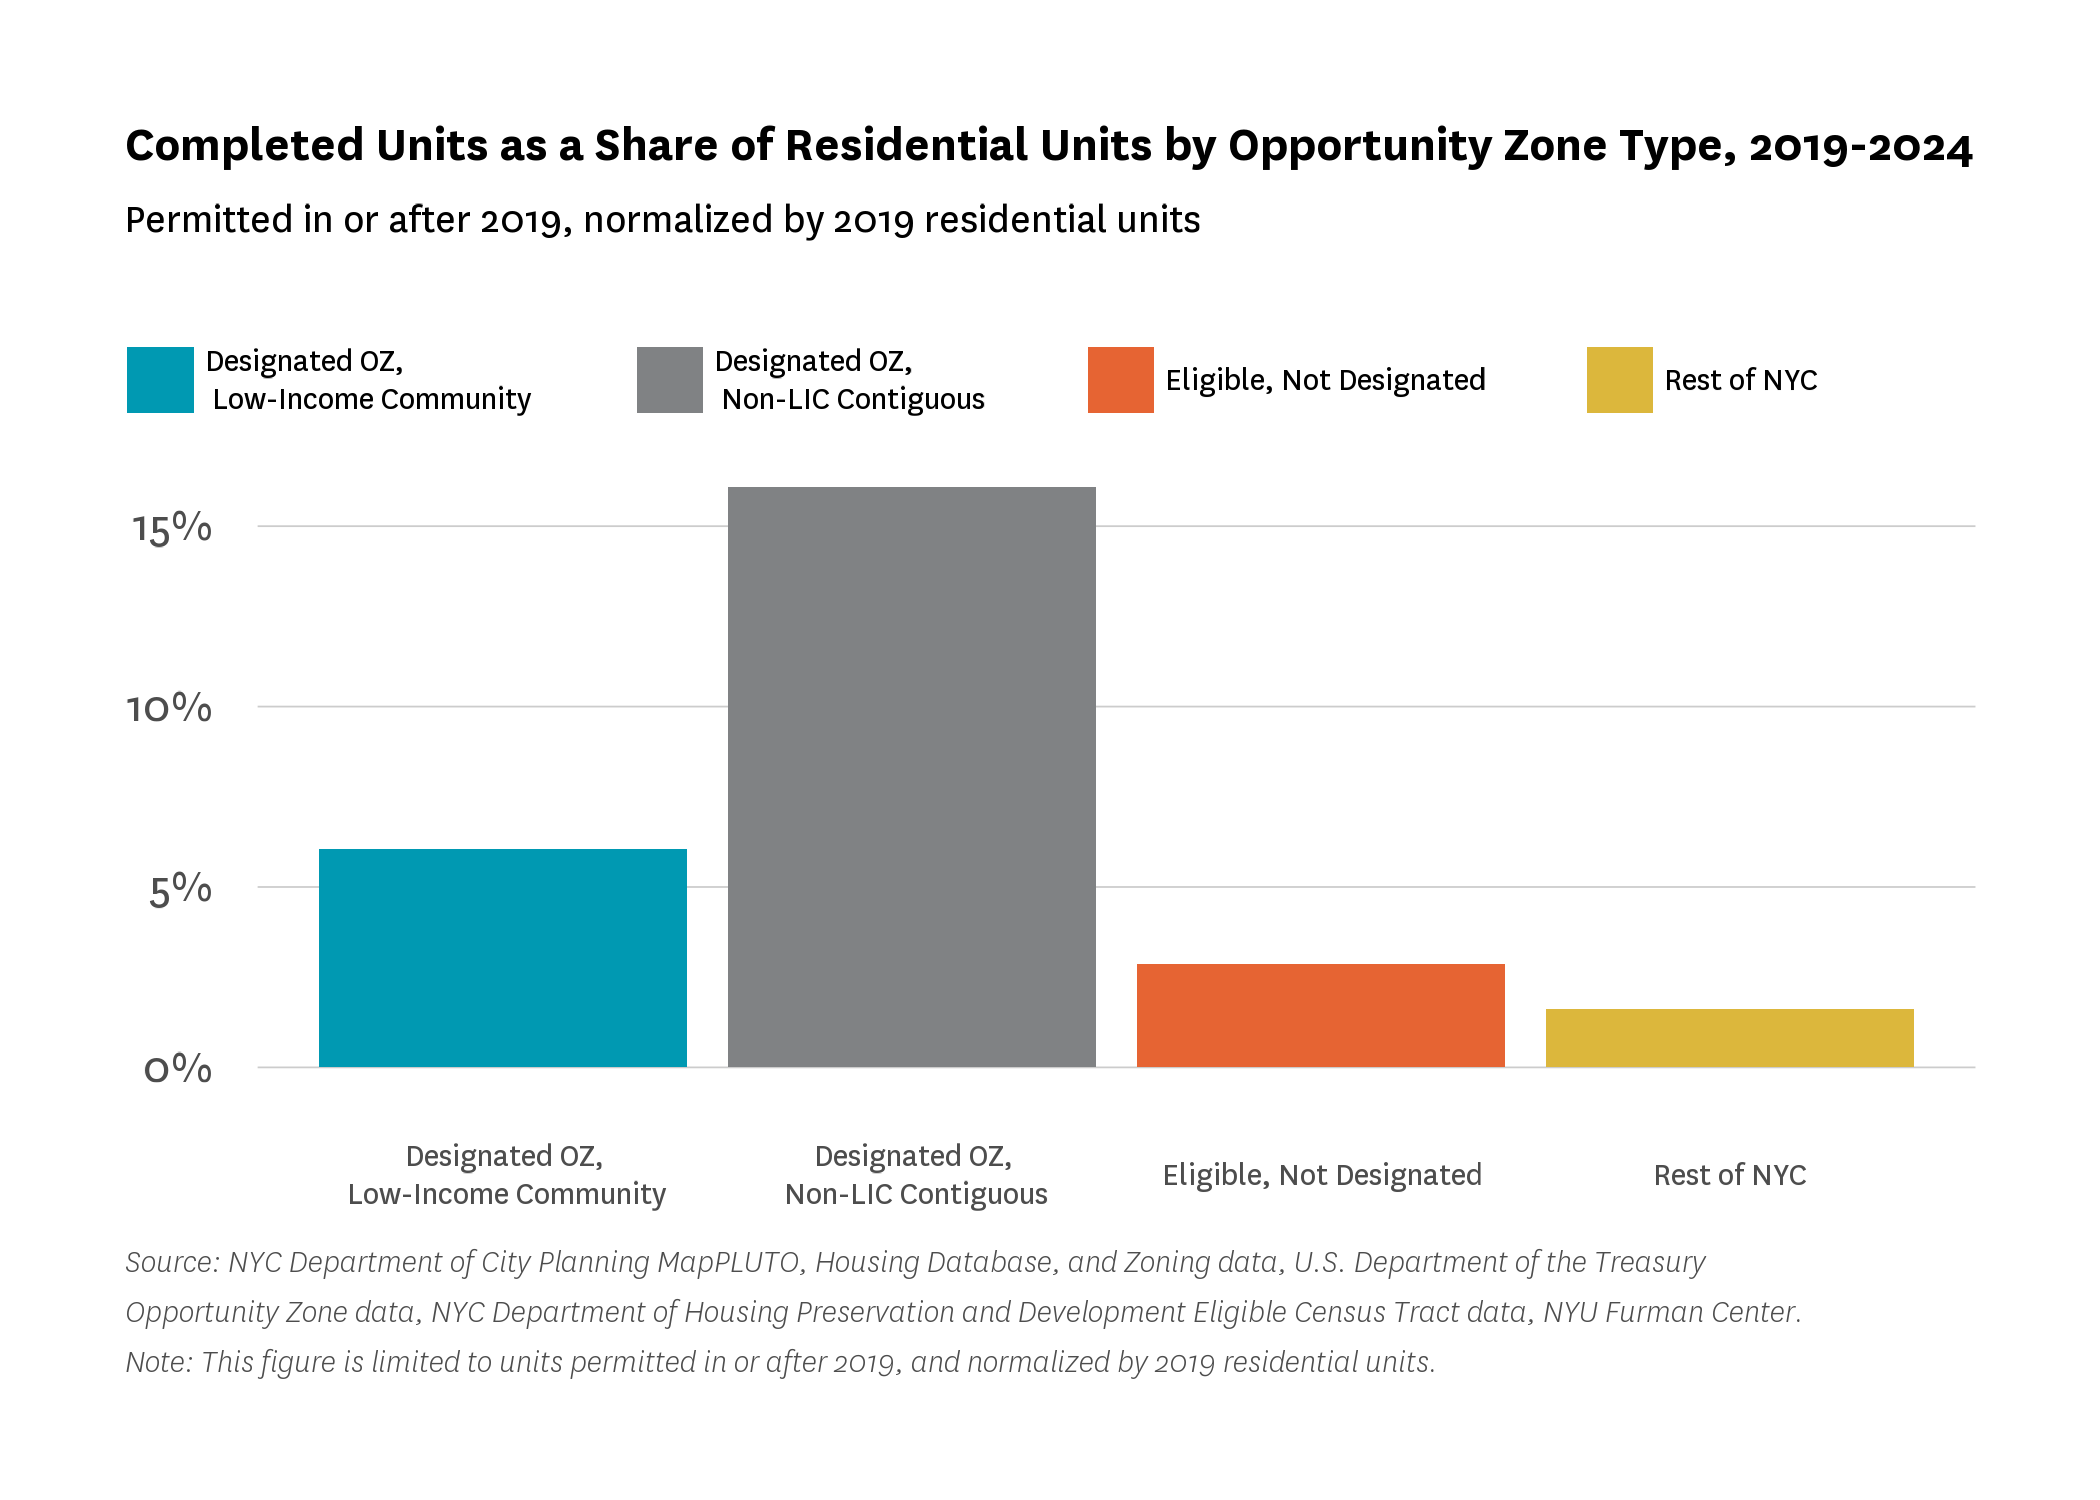
Development in Opportunity Zones is disproportionately located in non-low-income tracts that have a shared border with an eligible low-income area. In New York City, of the 306 total tracts that were designated as Opportunity Zones, 14 were contiguous but not low-income tracts. In those 14 tracts, rates of completed units reached 16 percent after the program was operational, compared to 6 percent in other Opportunity Zones.
As previously discussed, a stated goal of the OZ program was to attract investment to distressed low-income communities, and the majority of designated census tracts were eligible due to their low-income or high poverty status. However, the program also allowed each state’s governor to designate 5 percent of non-low-income tracts statewide as OZs if the tracts were contiguous to eligible low-income areas, and the median family income of the contiguous tract did not exceed 125 percent of that in the adjacent low-income tract.13 In New York City, of the 306 total tracts that were designated as OZs, 14 were contiguous but non-low-income tracts.14
These 14 contiguous OZ tracts—which were not themselves required to be low-income—saw substantially more development than the low-income OZ tracts (Figure 10). Between 2019 and 2024, completed housing units in contiguous OZ tracts amounted to 16 percent of their preexisting residential stock. This far outpaced the 6 percent growth seen in designated low-income OZ tracts. Eligible but not designated tracts and the rest of the city saw even lower growth rates of 3 percent and 2 percent, respectively.
Figure 10:
Nearly 60 percent of new apartments in Opportunity Zones were market rate, compared to less than 50 percent in eligible but not designated areas.
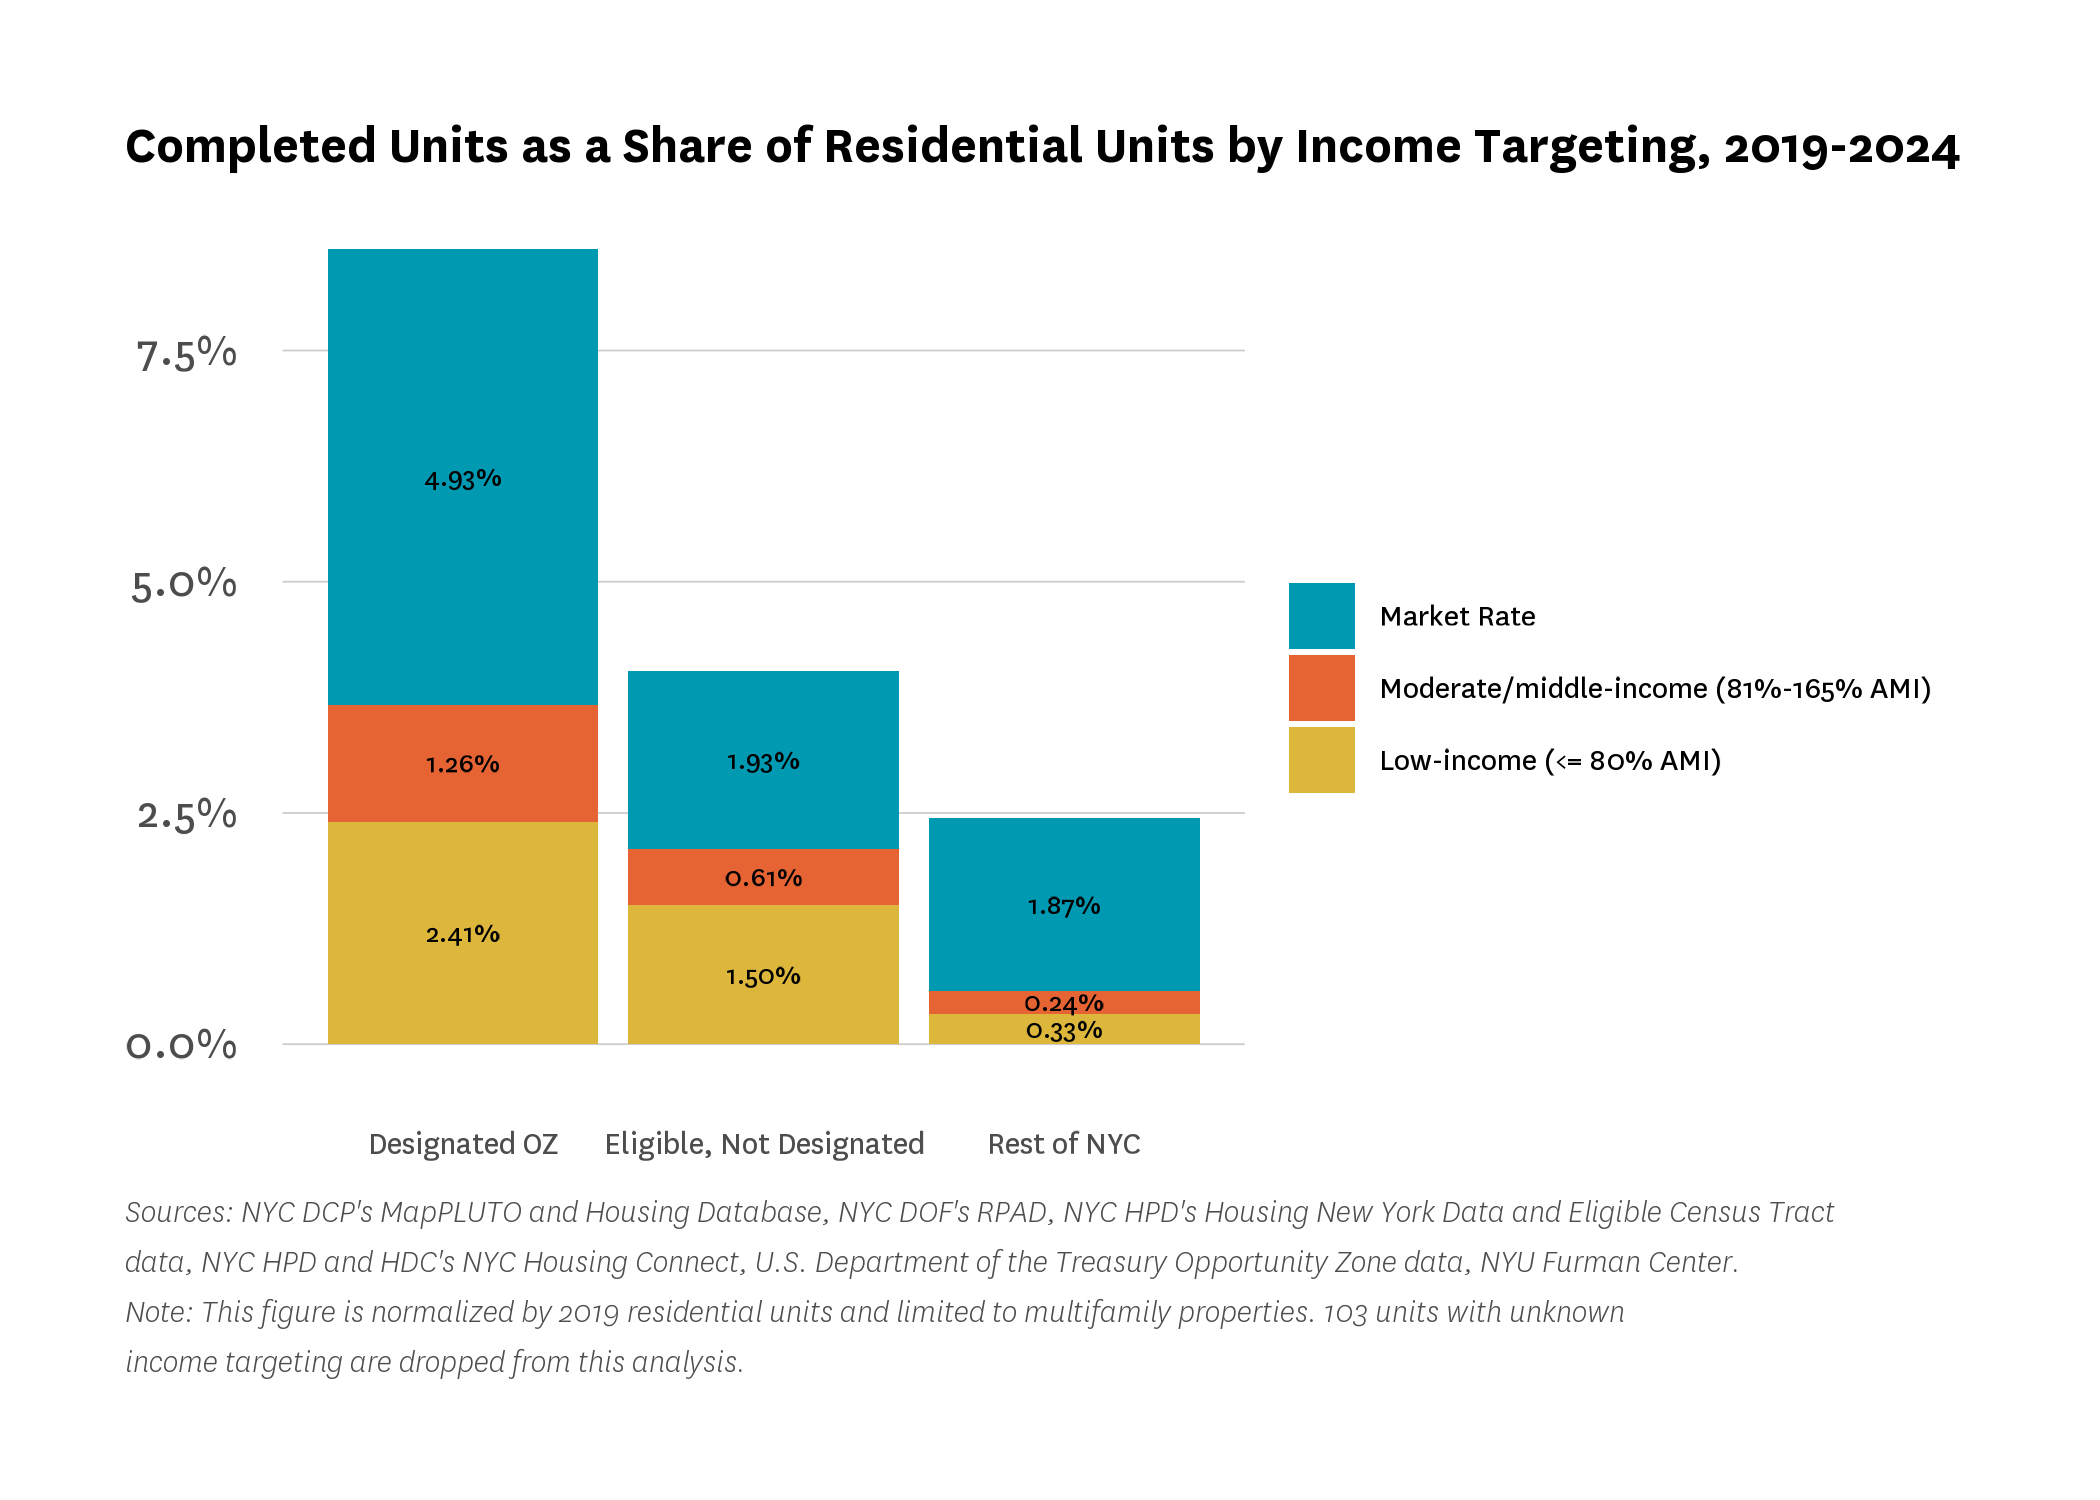
Designated OZs saw a notable amount of housing development after the program was operational in 2019. Volume-wise, those 306 OZs outpaced the 572 eligible but not designated tracts, and saw almost as much development as the 1,290 tracts in the rest of the city (Figure 11). However, new units in OZs were more likely to be market rate than the units in eligible but not designated tracts. More than 57 percent of new apartments in OZs were market rate compared to 48 percent in eligible but not designated areas. Further, new units in OZs were less likely to be targeted to low-income households than those in eligible but not designated tracts. 28 percent of units in OZ tracts were targeted to low-income households compared to 37 percent of units in eligible but not designated tracts. On a normalized basis, OZs added market rate units at a rate of almost five percent, compared to a completion rate of two percent in eligible but not designated tracts.
Figure 11:
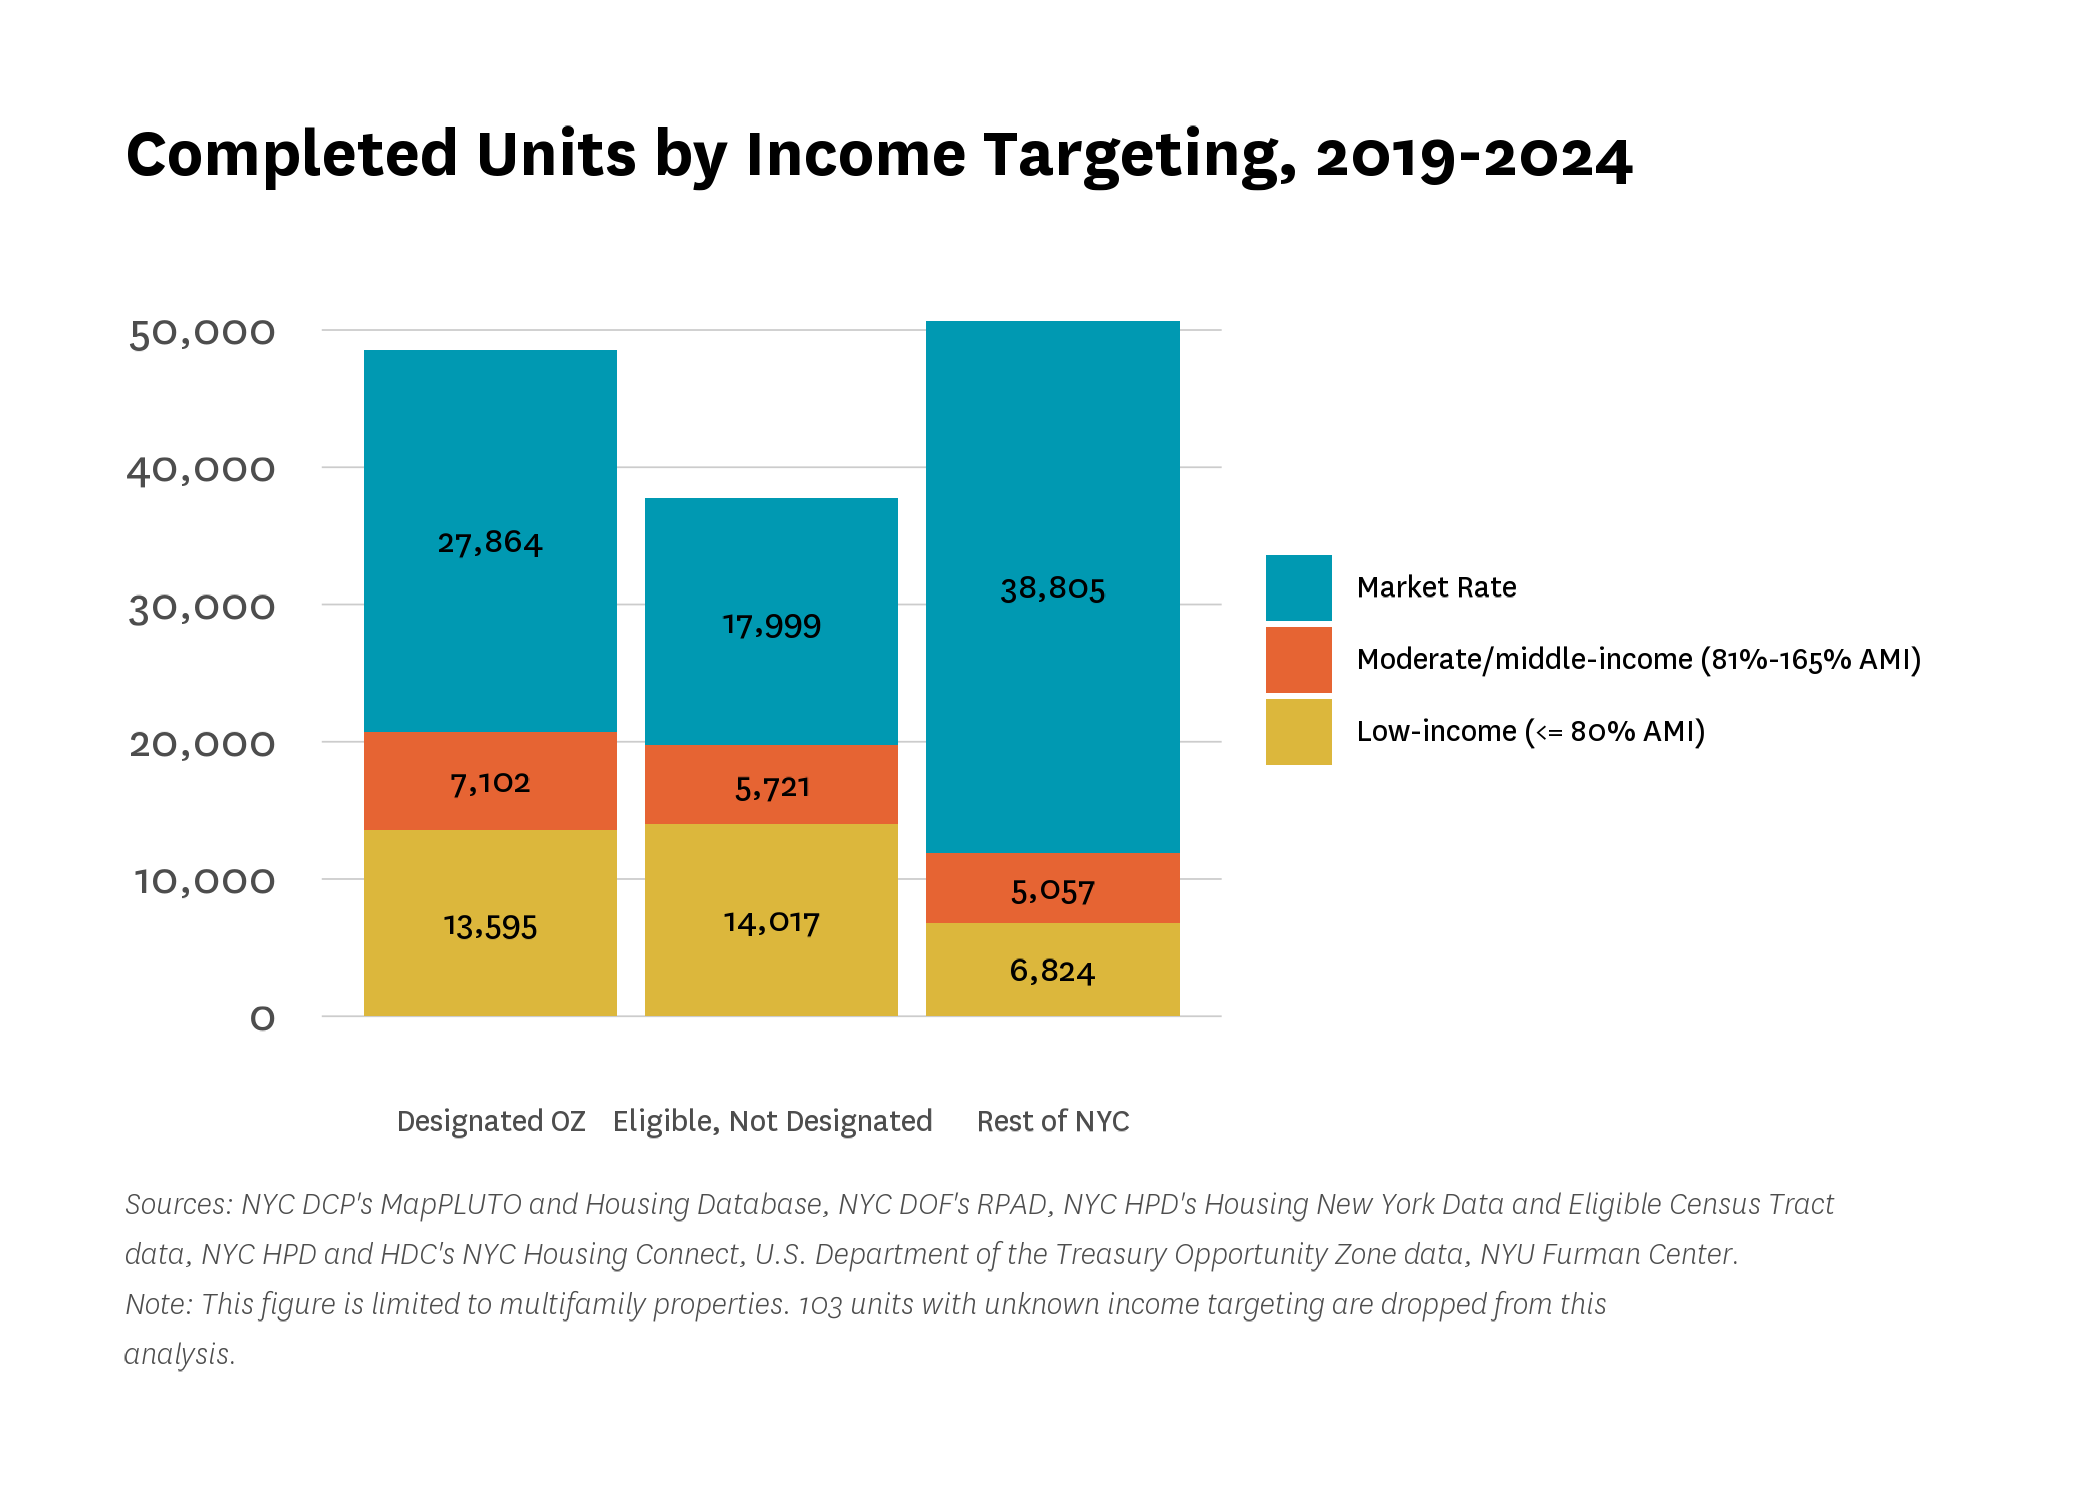
Figure 12:
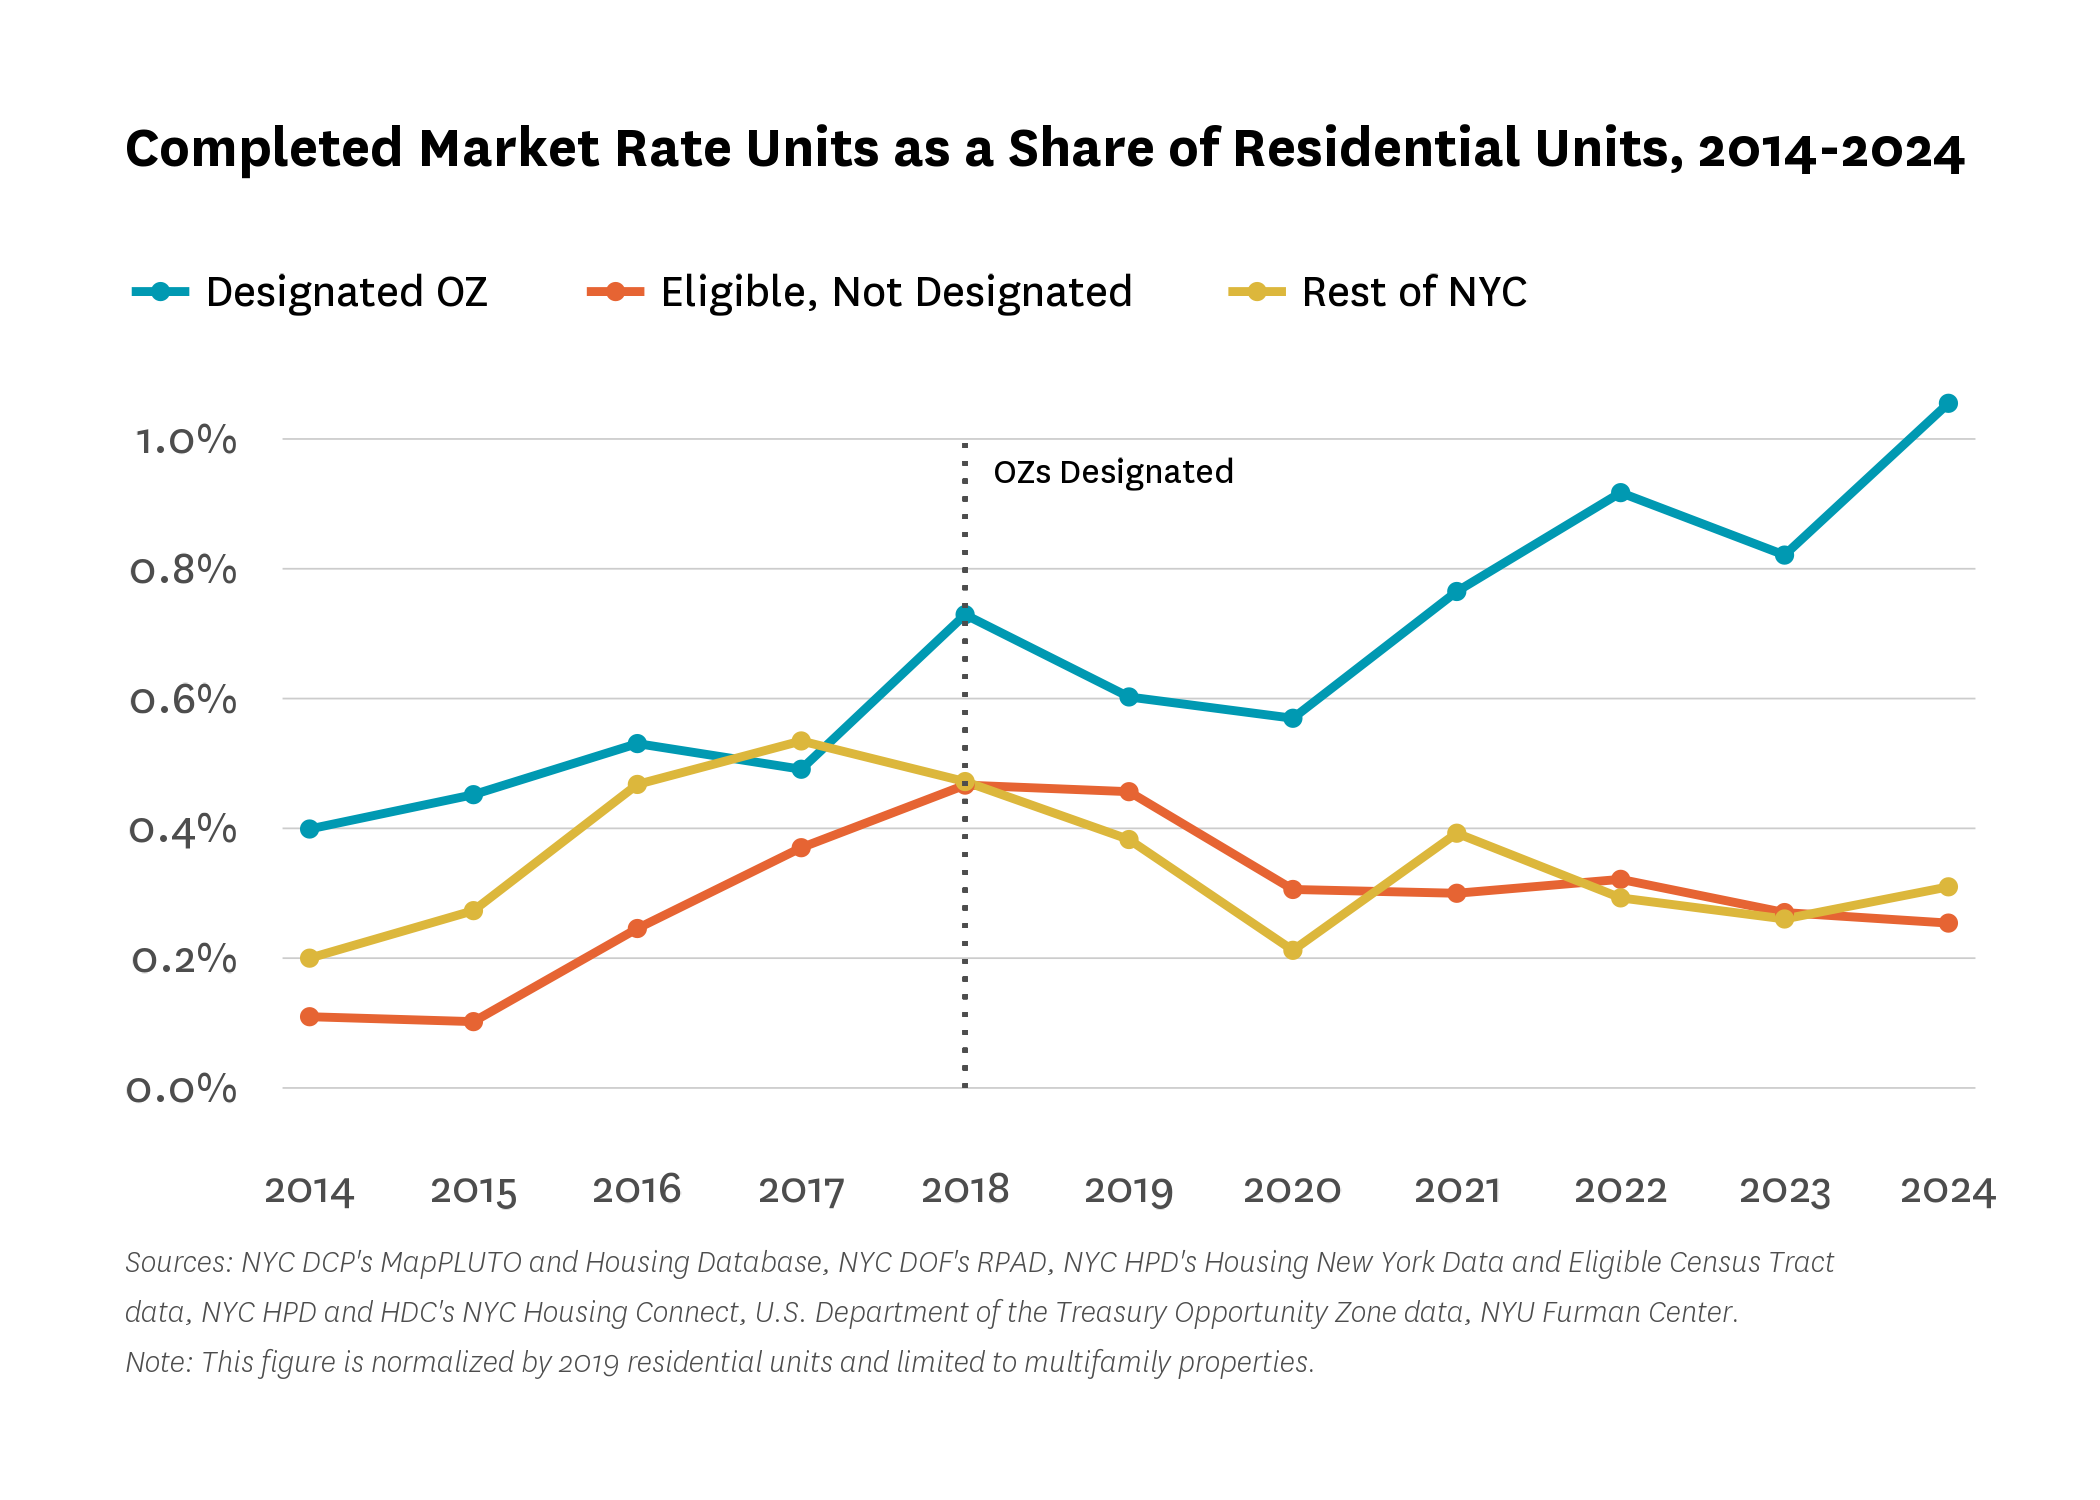
As previously discussed, both OZs and eligible but not designated tracts saw rising completion rates before the OZ program regulations were certified at the end of 2019. Then, post-operationalization, the rates in OZs continued to increase while those in eligible tracts stabilized. This divergence was especially notable for market rate units (Figure 13). OZ-designated tracts were already completing market rate multifamily units at higher rates than eligible and ineligible tracts prior to 2019. That lead widened after 2020, which may reflect the impact of the OZ program or that OZ tracts were somehow better positioned for a post-pandemic development rebound (or a combination of the two). While this pattern could indicate that some developers used OZ tax benefits to advance market rate construction, it is difficult to disentangle those effects from other local factors—such as zoning capacity, site availability, or access to additional subsidies, all of which we discuss in more detail below.
Figure 13:
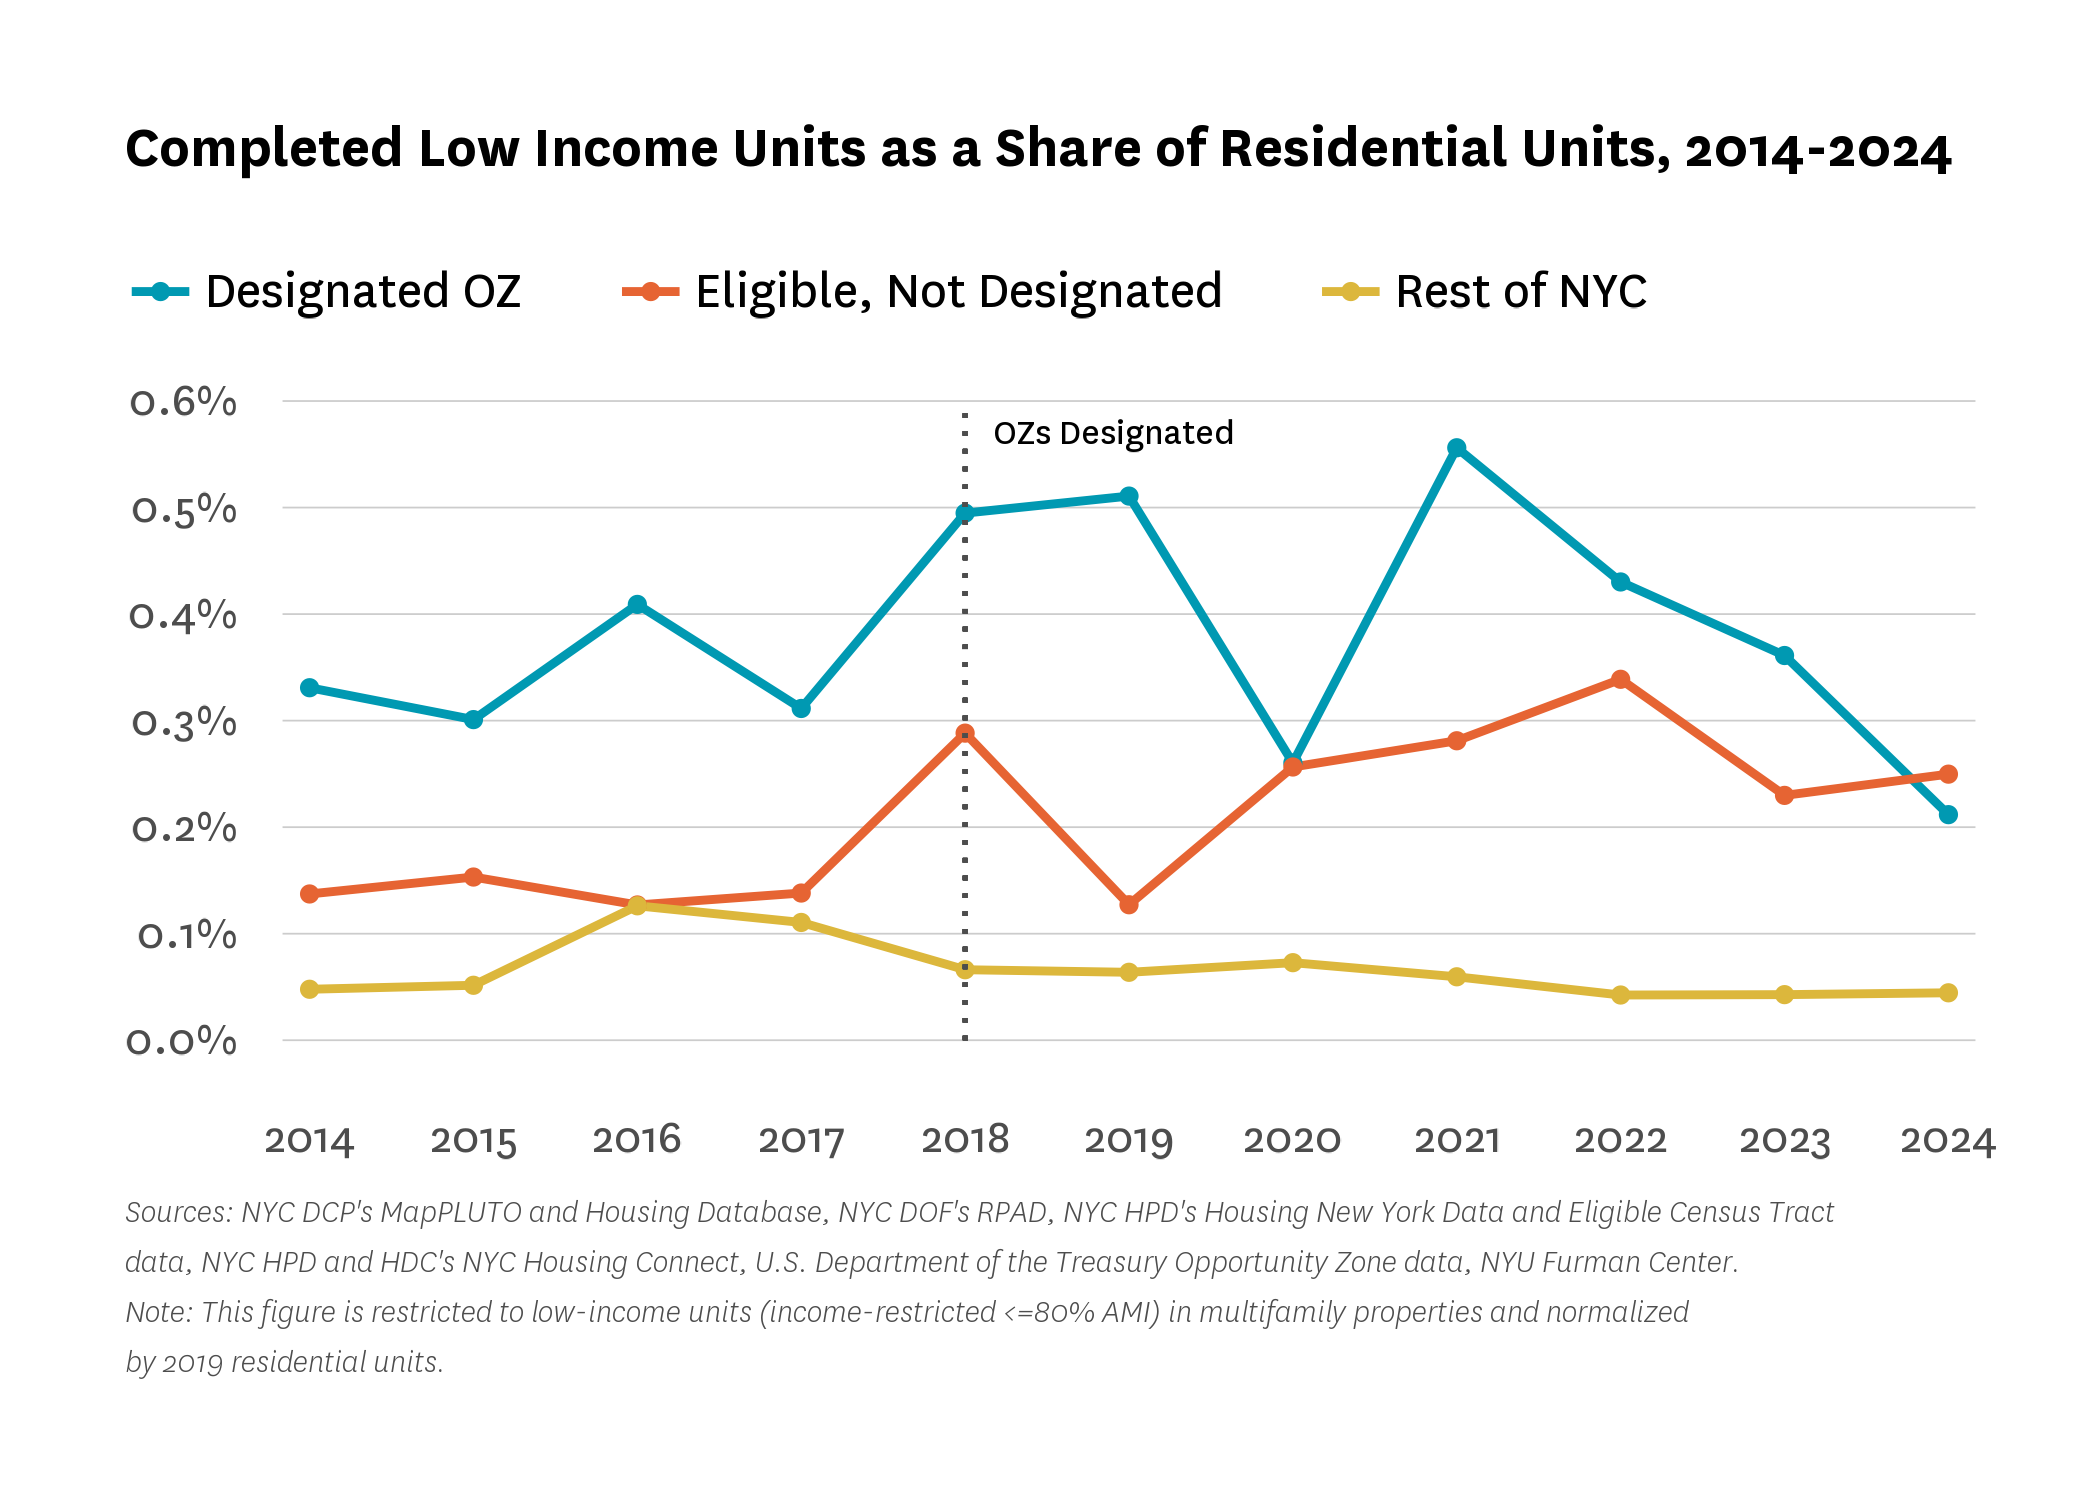
In contrast, there appears to be little evidence that OZ designation meaningfully boosted affordable housing production. As shown in Figure 14, both designated OZs and eligible tracts consistently produced low-income units—defined here as affordable to households earning up to 80 percent of AMI—at a higher rate than other areas. But the trajectories of designated and eligible OZs closely tracked one another throughout the period, and year-to-year volatility makes it difficult to identify any sustained impact from the OZ program. In some years, designated OZs slightly outperformed eligible tracts; in others, they did not. This pattern suggests OZ designation had little effect on the city’s affordable housing pipeline.
Figure 14:
A number of factors, such as zoning changes and state tax incentives, cast doubt on whether the Opportunity Zone program is the primary driver spurring development in designated tracts.
First, the increase in investment indicators (such as sales, demolitions, and completions) in Opportunity Zone-designated tracts does not always neatly align with the program’s legal and regulatory milestones.
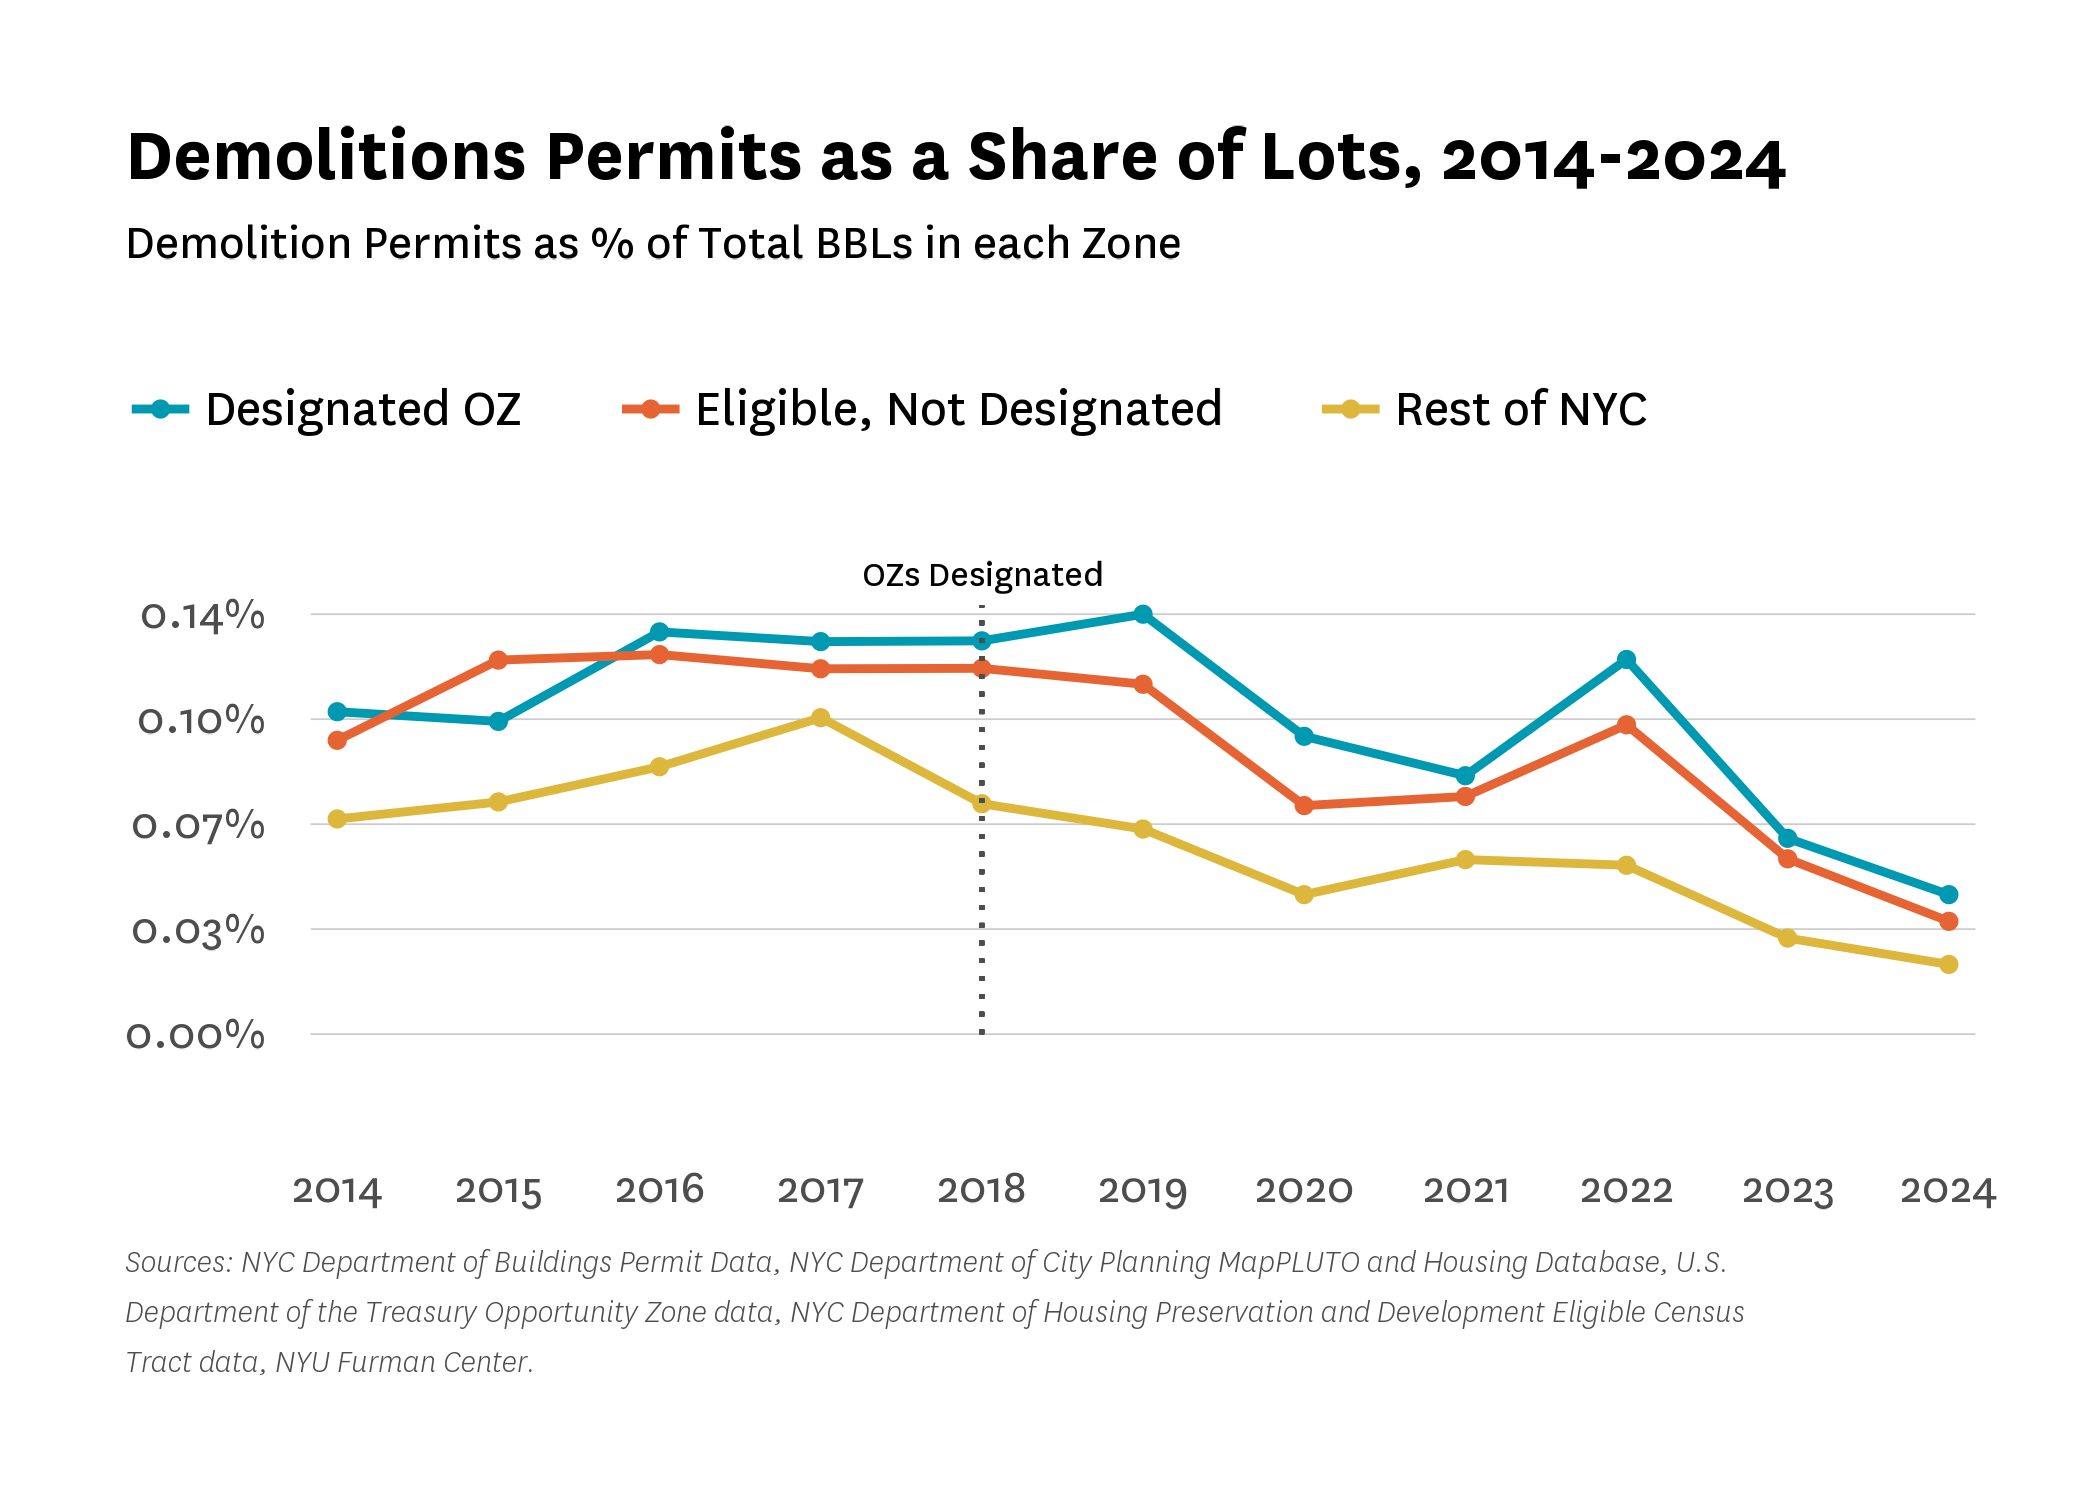
As Figures 15 and 16 show, trends in sales and demolitions, respectively, could potentially suggest that OZ designation may have coincided with a brief, marginal increase in market interest. For example, between 2018 and 2019–after the OZ designations were certified and the program was operational–the sales rate declined less in the designated tracts than for the eligible but not designated tracts and the rest of the city. Similarly, demolition permitting rates in designated tracts increased between 2018 and 2019, while decreasing elsewhere. Neither sales nor demolitions rates show strong evidence of a substantial or lasting effect, although that may be expected, given that projects that started closer to the beginning of the program generated greater tax benefits. In both cases, OZs and eligible but not designated tracts had nearly identical trends after 2019. In short, while there were some early signs of increased activity in sales and demolition rates they are limited in scope and duration.
Figure 15:
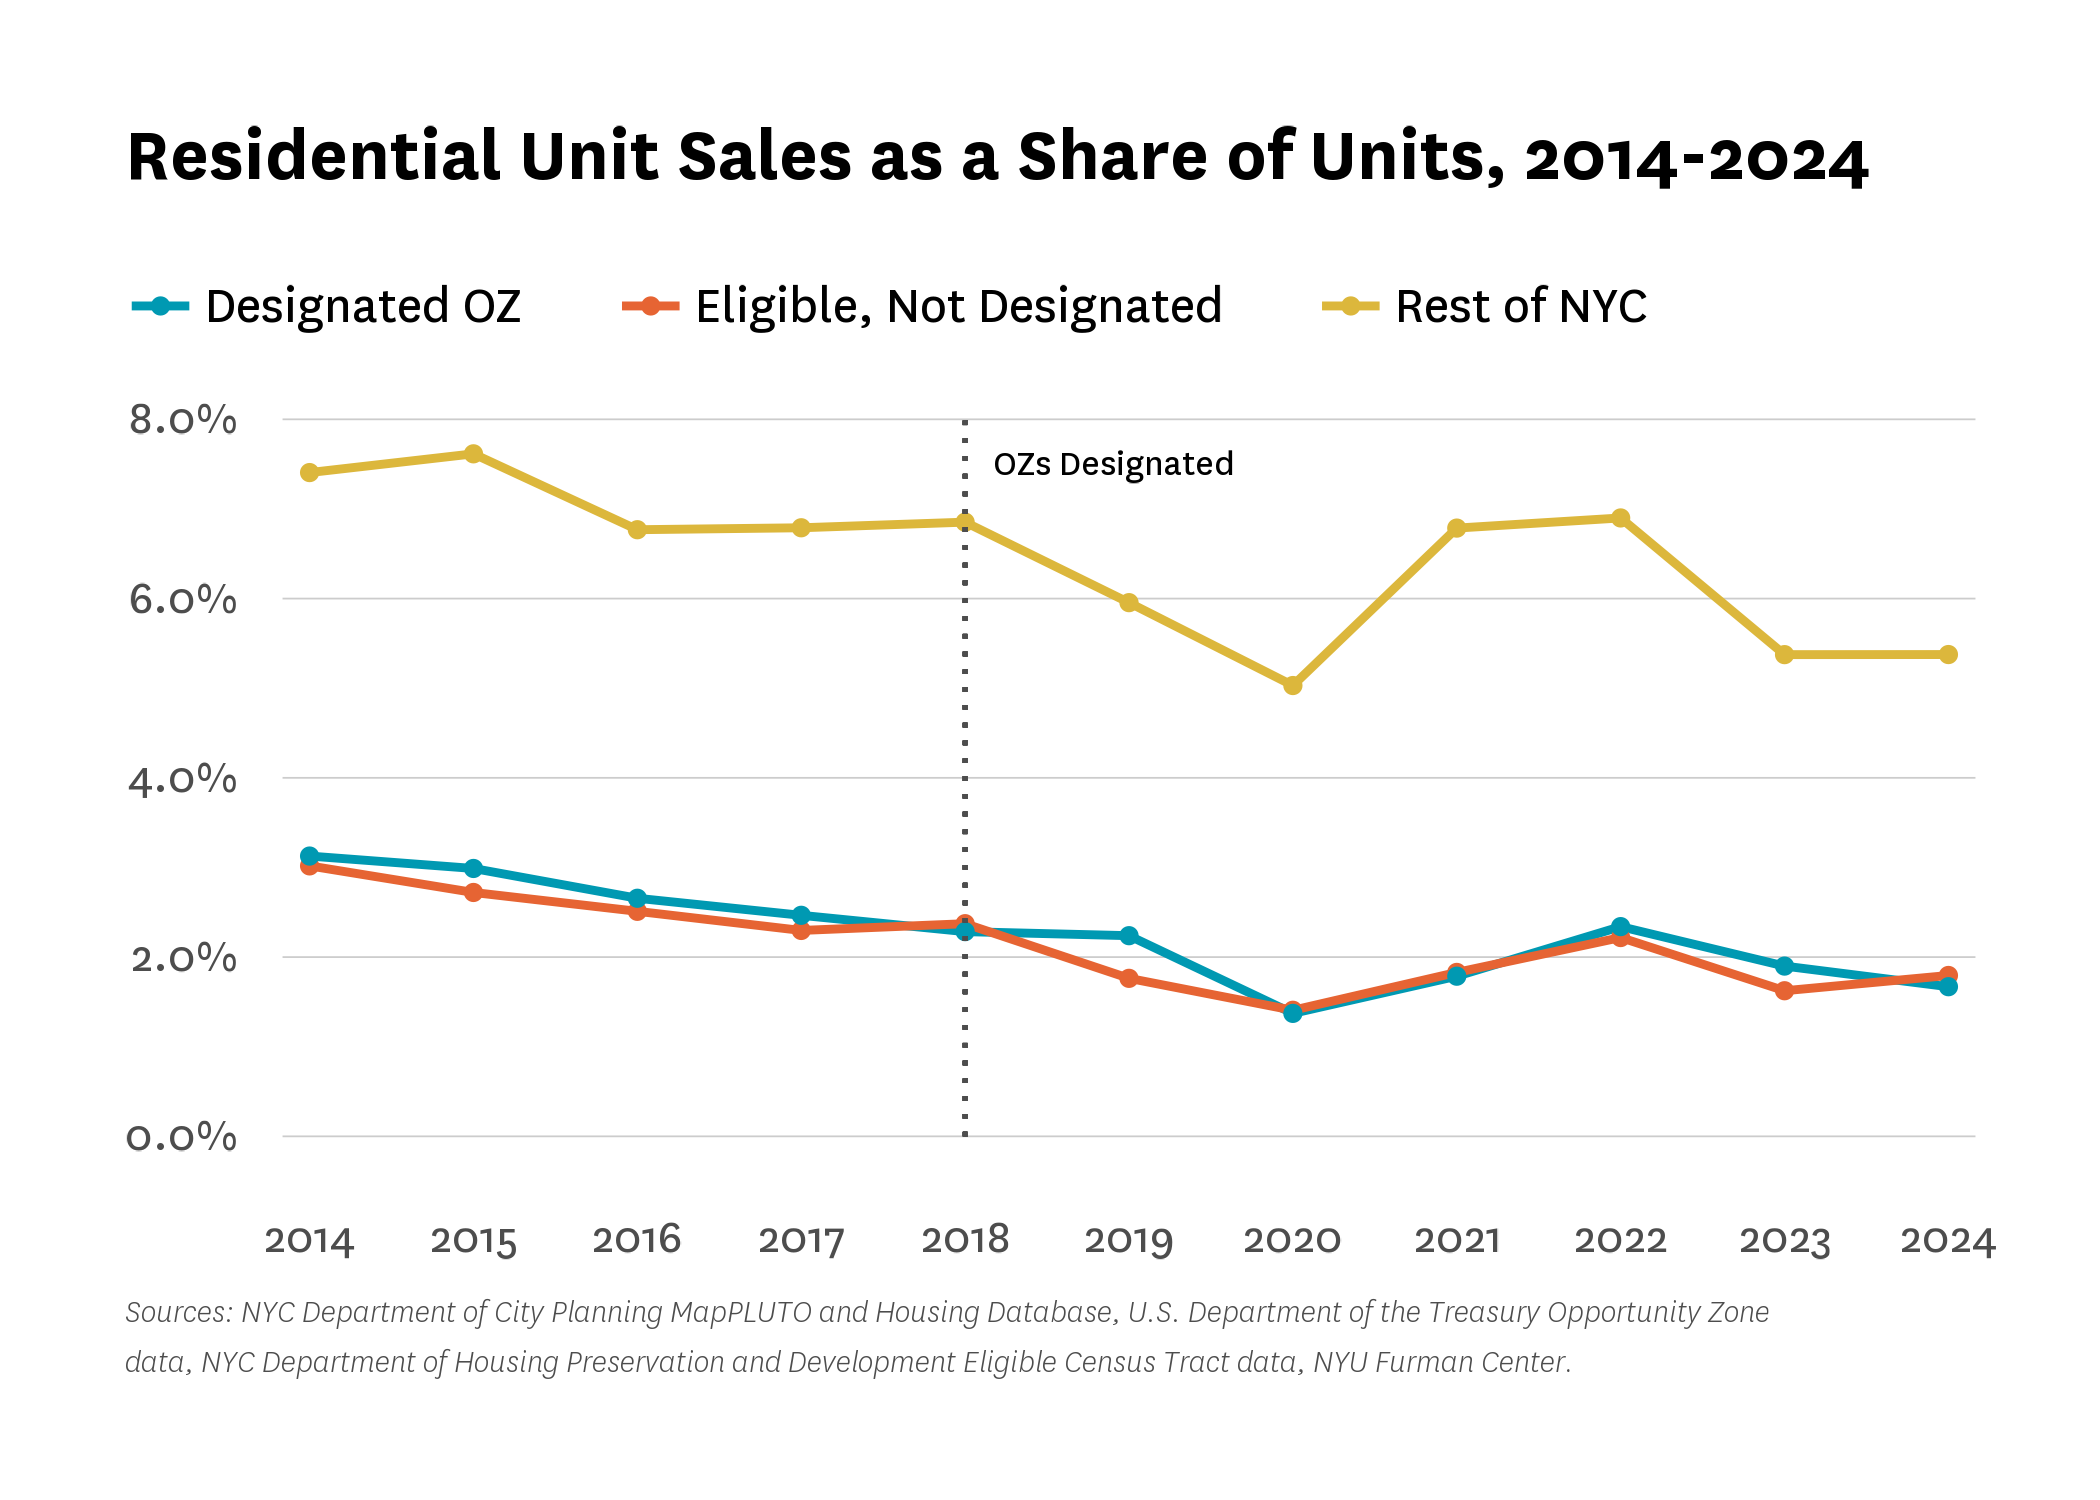
Figure 16:
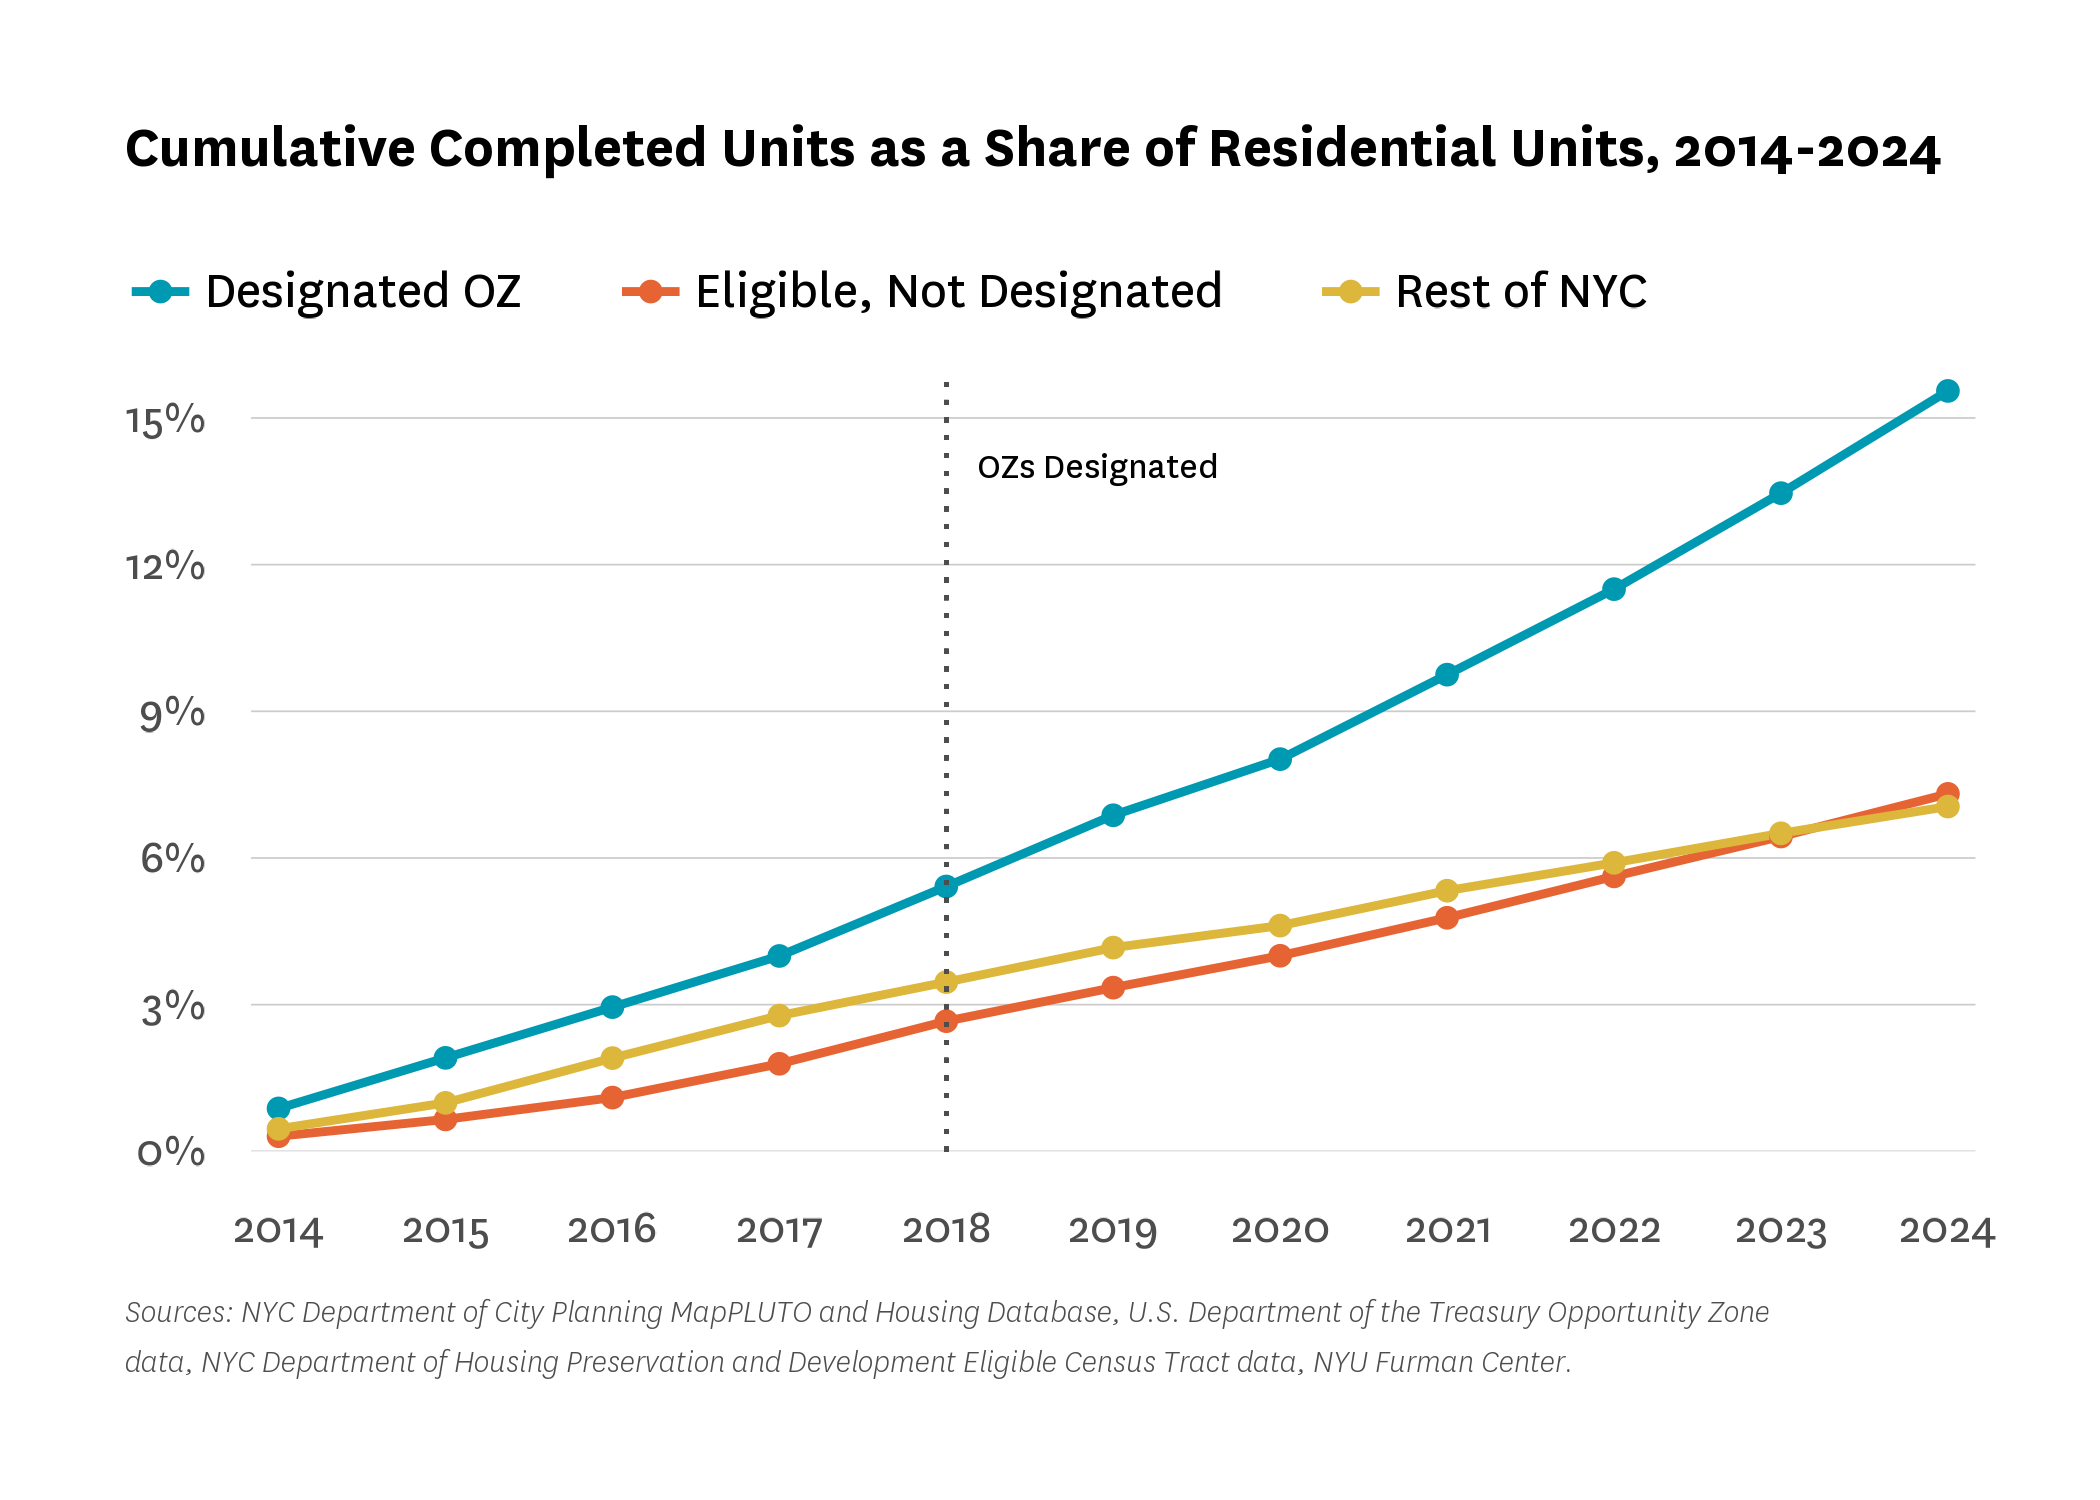
Cumulative completion rates (Figure 17) tell a similar story to that of Figure 9. OZ tracts were already on a faster growth trajectory before the OZ program was operational, and the divergence between OZs and eligible tracts continues steadily afterward without any clear change that coincides with program milestones. However, the lack of a dramatic increase in completion rate could reflect the lag between project planning and completion, with new housing coming online gradually over multiple years.
Figure 17:
Second, instead of following Opportunity Zone milestones, the development trends follow citywide trends around the expiration of 421-a, suggesting the Opportunity Zone program and the 421-a tax exemption program may have worked together to incentivize development.
Trends in permitting activity do not clearly point to a correlation between the OZ program and an increase in new residential development in New York City. While the OZ program aimed to spur new development, permitting activity in New York City’s OZs (and other parts of the city) appears more closely correlated with other policy and market factors—particularly the expiration of the city’s local property tax incentive—than with the program itself.
Importantly, designated OZs already had a higher baseline of permitting activity well before the program was created. Since at least 2014, permitting rates were consistently higher in OZs than rates in eligible but not designated tracts and the rest of the city.
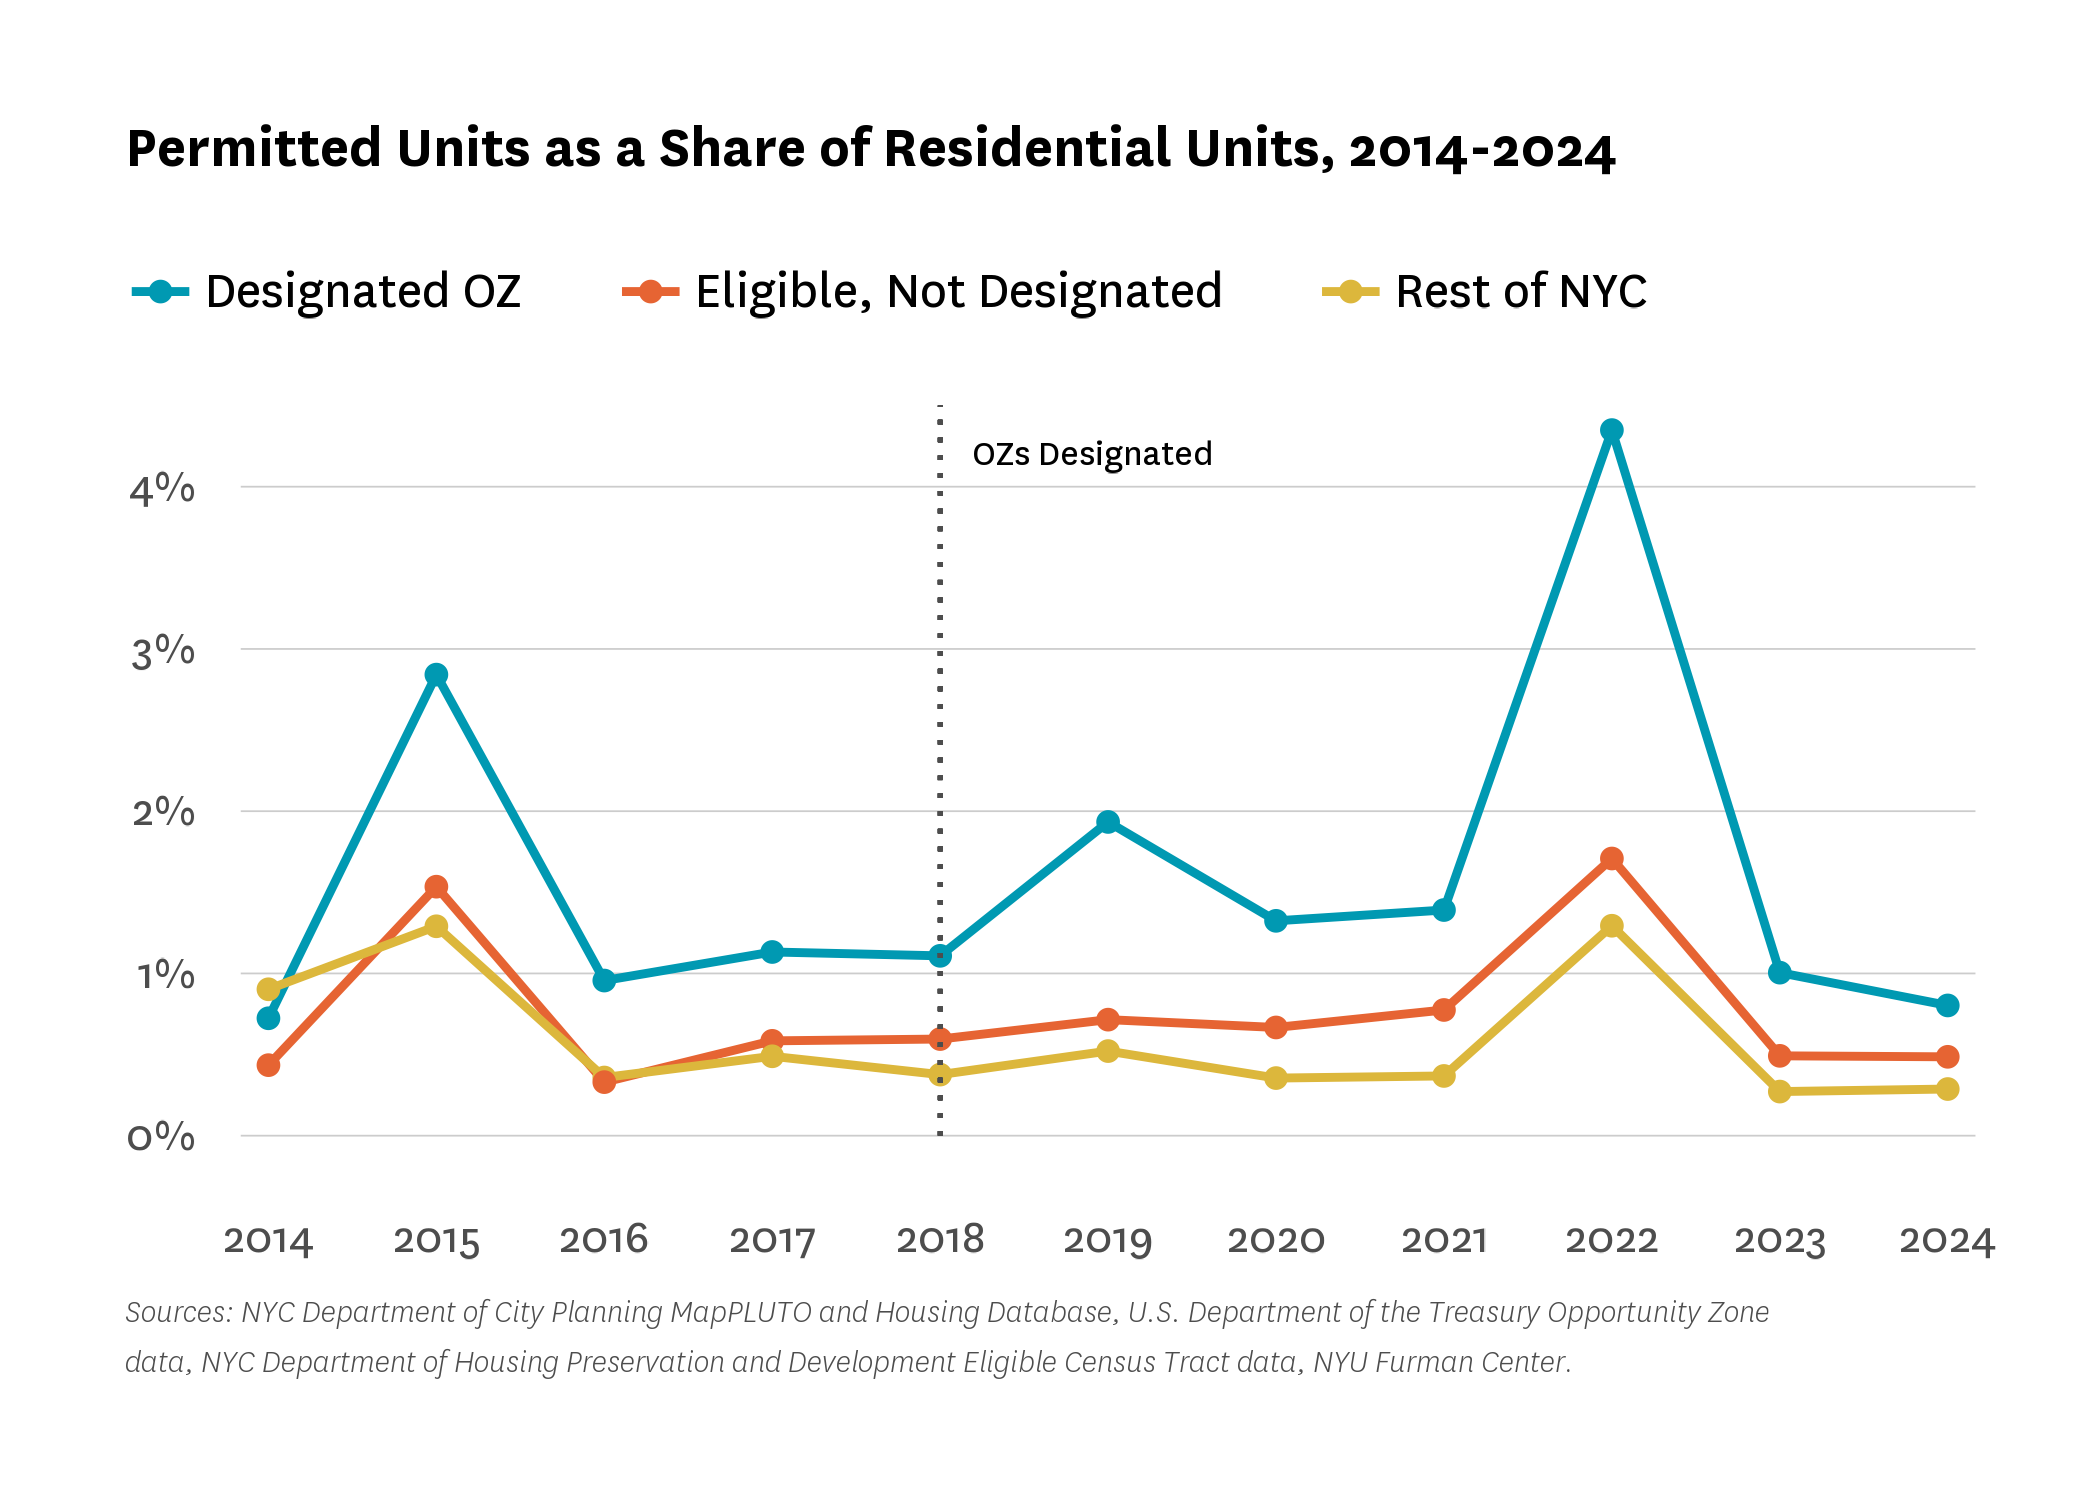
OZ tracts saw a more pronounced spike in permitting activity than eligible but not designated tracts and the rest of the city in 2019—the year after certification and just before final regulations were released, meaning the program was operational. That year, the rate of residential permits in OZ tracts increased faster than the increase seen in both eligible but not designated tracts and the rest of the city (Figure 18). Permitting dropped sharply in 2020, during the pandemic, before a larger spike in 2022.
Indeed, the two largest spikes in permitting across all tract types occurred in 2015 and 2022, both of which correspond to the expiration of different versions of the 421-a property tax exemption. When those spikes occurred, the designated OZs saw a larger jump than eligible but not designated tracts and the rest of the city, which may imply that OZs may have worked in tandem with 421-a. Developers may have had more incentive to build when they could capture both the tax exemption and the additional benefits of OZs. However, this descriptive analysis is not sufficient to confirm the true impact of the OZ program on permitting.
Figure 18:
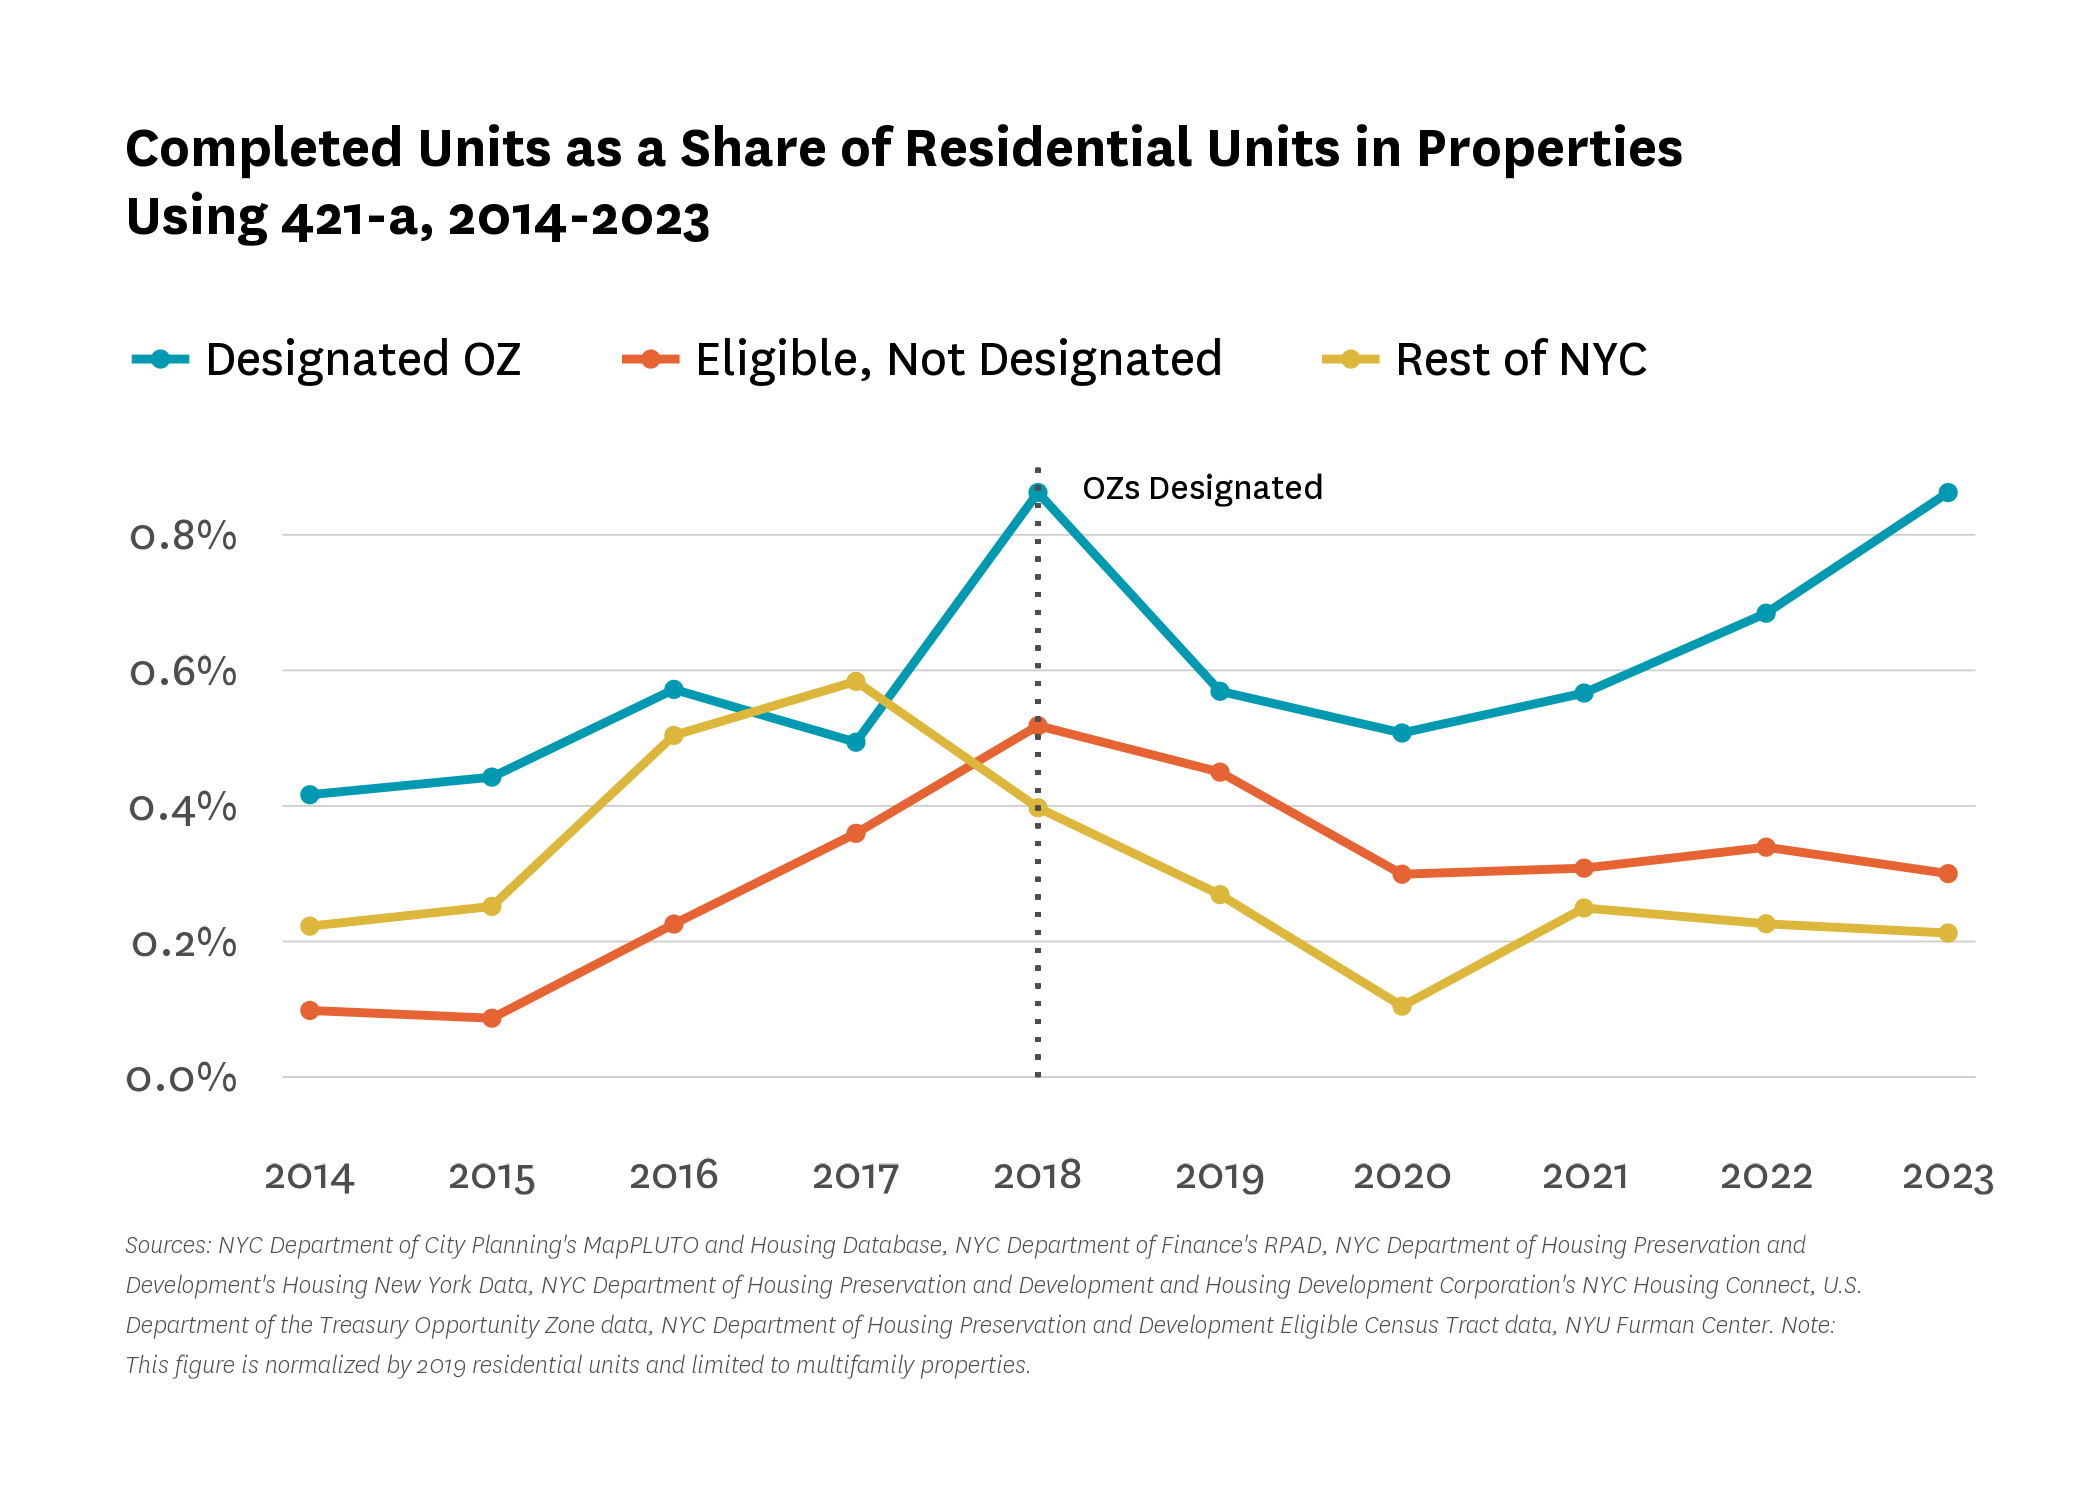
A longitudinal look at units supported by the 421-a property tax exemption (and no other subsidy), also suggests that state-level tax incentives may have played a role in driving multifamily construction during the OZ period. As shown in Figure 19, completion rates of 421-a units surged in 2023, with designated OZ tracts leading other areas. 15 This trend aligns with the permitting spike observed in 2022, suggesting that developers in OZ tracts could have been seeking to lock in 421-a benefits before they expired. The timing of these increases—coupled with similar spikes in earlier years tied to prior 421-a expirations—reinforces the importance of property tax incentives in driving new development in OZs. While the completion rate of new 421-a units in OZs increased between 2020 and 2023, trends in eligible but not designated tracts remained relatively flat, suggesting that the OZ program and the 421-a tax exemption may have worked together to incentivize development.
Figure 19:
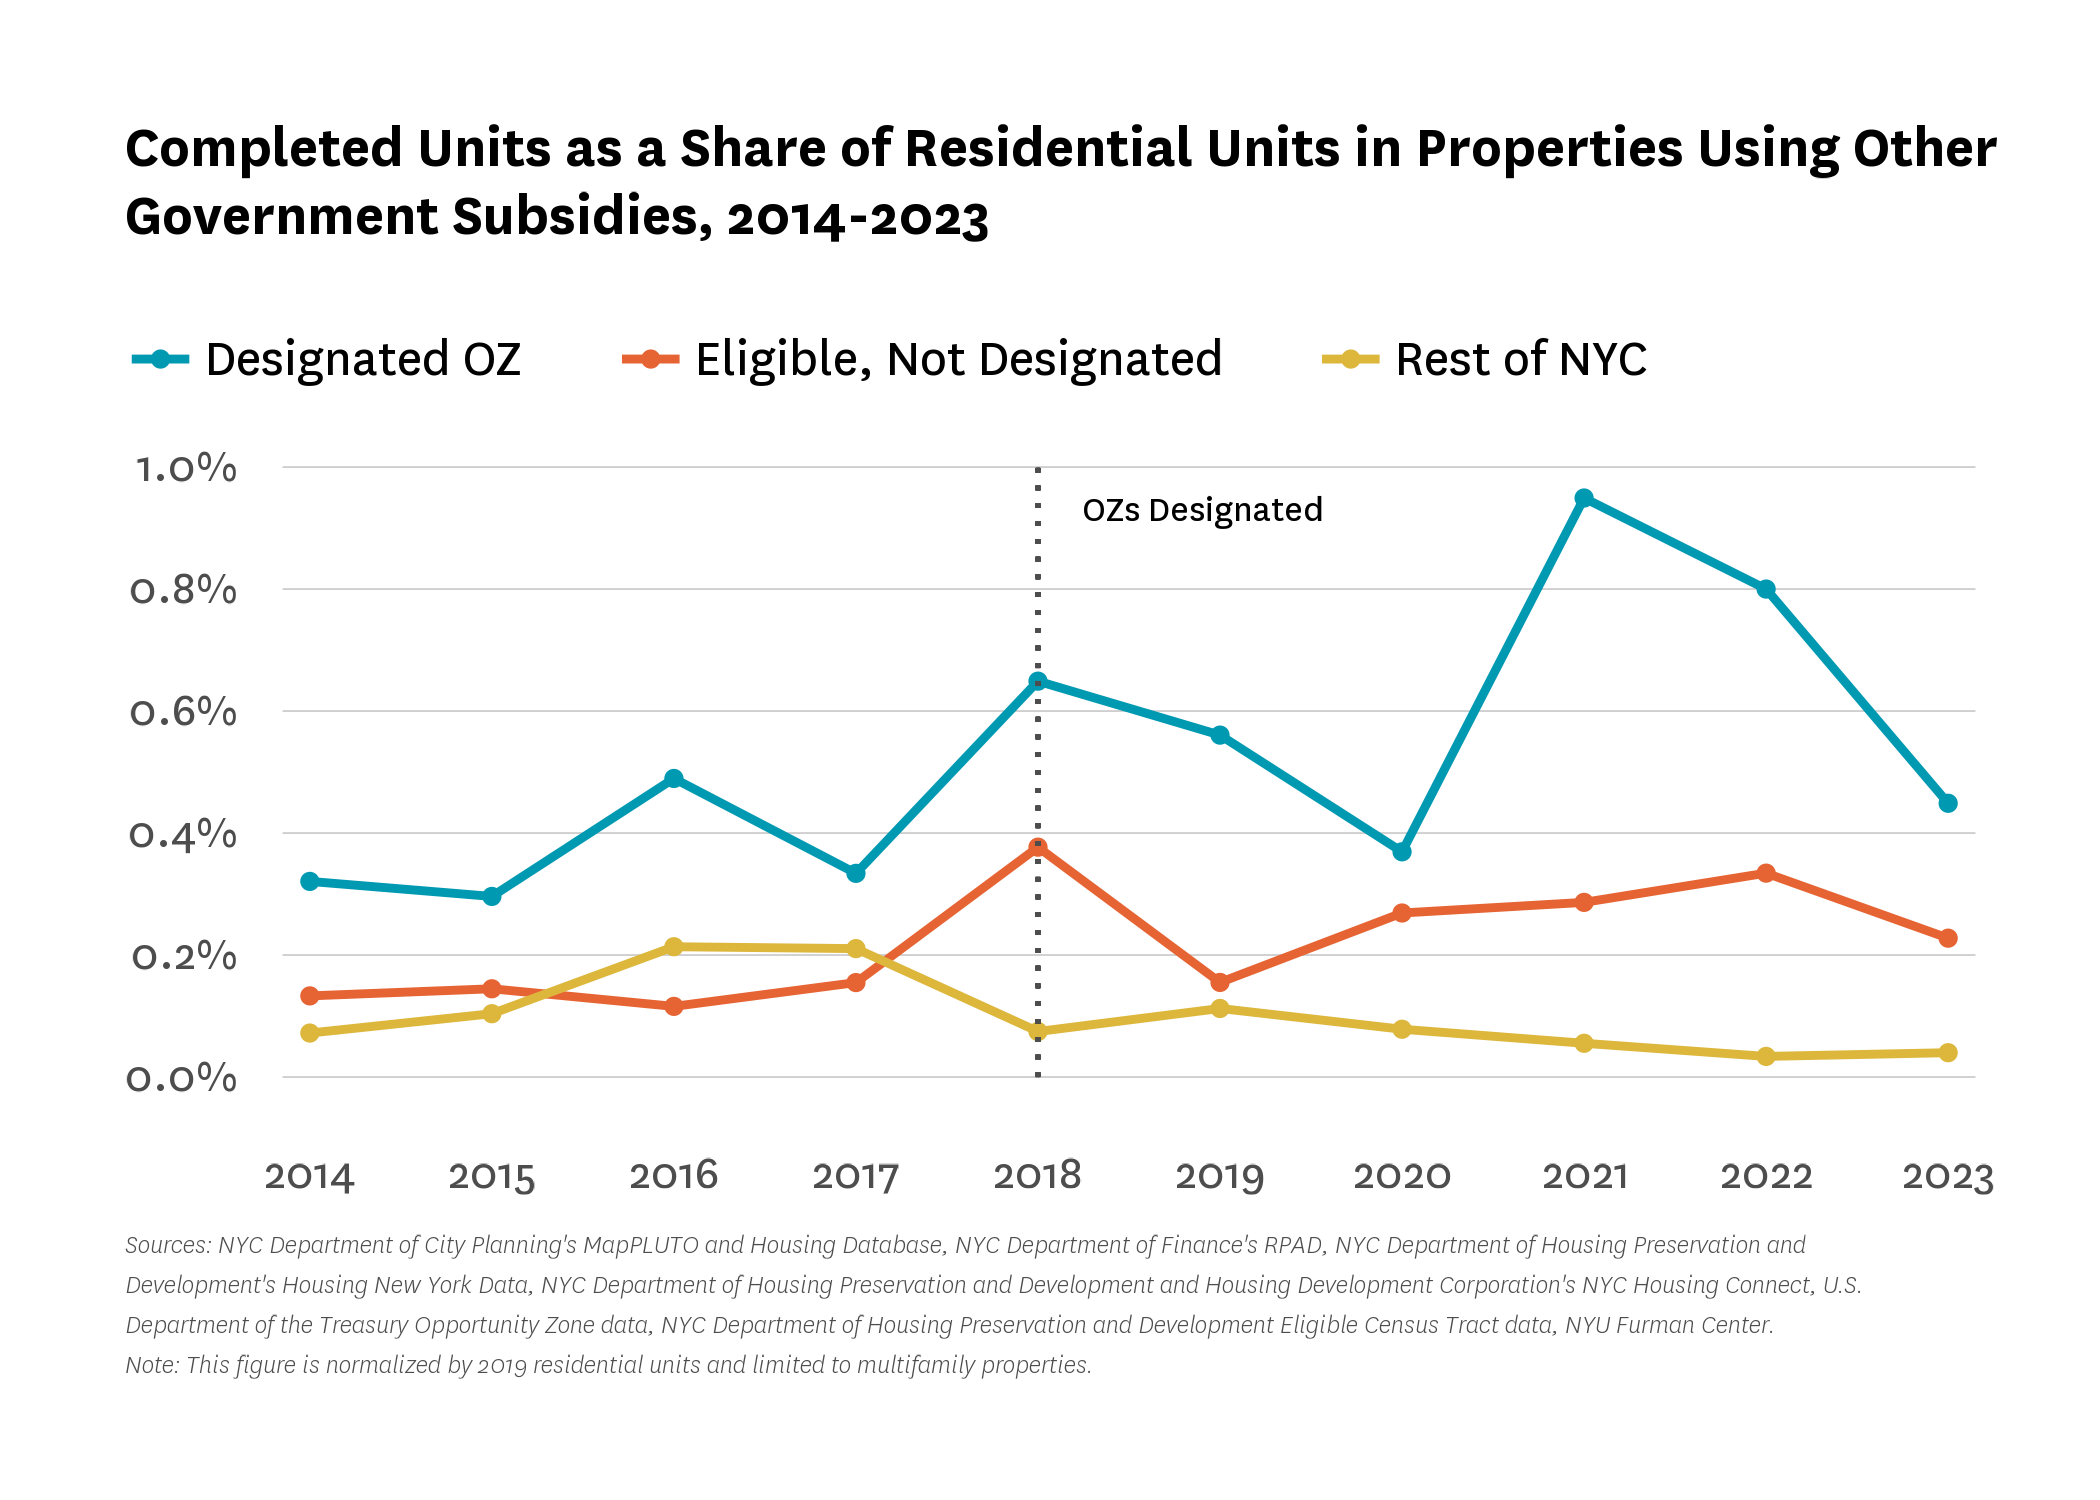
Finally, we examined completions supported by other government subsidy programs (like LIHTC). 16 As shown in Figure 20, both designated OZs and eligible tracts maintained higher rates of subsidized unit production than other parts of the city—consistent with trends observed before the OZ program’s rollout. However, after the program was operational in 2019, OZs saw a greater increase in completion rates–spiking in 2021 and 2022 while trends in eligible tracts remained relatively stable. Considering the long time horizon to complete affordable housing projects, we might have expected to see a spike in 2023 and 2024, but instead OZ tracts’ production fell to a similar output as eligible tracts.
The extent to which this two year spike can be traced to OZs is unclear. For example, the second largest affordable property completed that year was permitted before the OZ program was operational in 2019. In addition, developers we spoke to who developed properties with affordable units that were completed in these years noted that they found it challenging to use the OZ program as part of the capital stack for their projects for a number of reasons we explore in detail below. The impact of the OZ program, and how it integrates with subsidized development is uncertain.
Figure 20:
Third, the Opportunity Zone development is concentrated in contiguous tracts–particularly one in Long Island City–not in the low-income areas that make up the majority of the designated tracts, suggesting that the program may be more effective at spurring new development in higher-income tracts.
As previously mentioned, the development in OZs after the program was operational is disproportionately concentrated in 14 contiguous, non-low-income tracts. A closer look at those contiguous tracts reveals that the development (represented by dots sized by number of units per property) is extremely concentrated, with 3,712 new units located in one tract in Long Island City (Figure 21). This tract far outpaces development even in the other contiguous tracts, highlighting the extent to which trends in OZ development appear to be driven by units in relatively wealthy Long Island City. This suggests that the program may be most impactful in higher-income areas, rather than the low-income tracts that the program is intended to target.
Figure 21: Completed Residential Units (2019-2024, permitted on or after 2019), Contiguous and Low-Income Opportunity Zone Tracts
Sources: U.S. Department of the Treasury Opportunity Zone data, Department NYC Department of Housing Preservation and Development Eligible Census Tract data, NYC Department of City Planning’s PLUTO (2024), Housing Database (2019-2024), NYU Furman Center.
Fourth, the most notable trend is that development is concentrated in Opportunity Zone tracts that were rezoned in the past 15 years, suggesting that the program may have been helpful but not sufficient on its own without being complemented by other tools.
To assess the correlation between land use policy and development in OZs, we examine how many new residential units were built between 2019 and 2024 (after the operationalization of the program) in areas that had been upzoned between 2004 and 2021. We define upzonings as rezonings that increase allowable Floor Area Ratio (FAR) by at least 20 percent, and distinguish between rezonings initiated by private entities and those led by city agencies.17 About eleven percent of OZ land area was upzoned, compared to four percent in eligible but not designated tracts and three percent in the rest of the city.
After OZ designation in 2019, OZ tracts saw higher levels of residential permits and completions than both eligible but not designated tracts and the rest of the city. However, more than two-thirds of the new development in OZs (70 percent) occurred in areas that had been upzoned or had upzonings underway when the OZ tax provisions were enacted, suggesting that upzoning may have been a critical factor in the increased development activity in those tracts (Figure 22). In contrast, only 23 percent of new units in eligible tracts and 27 percent in other parts of the city were built in upzoned areas.
Figure 22:
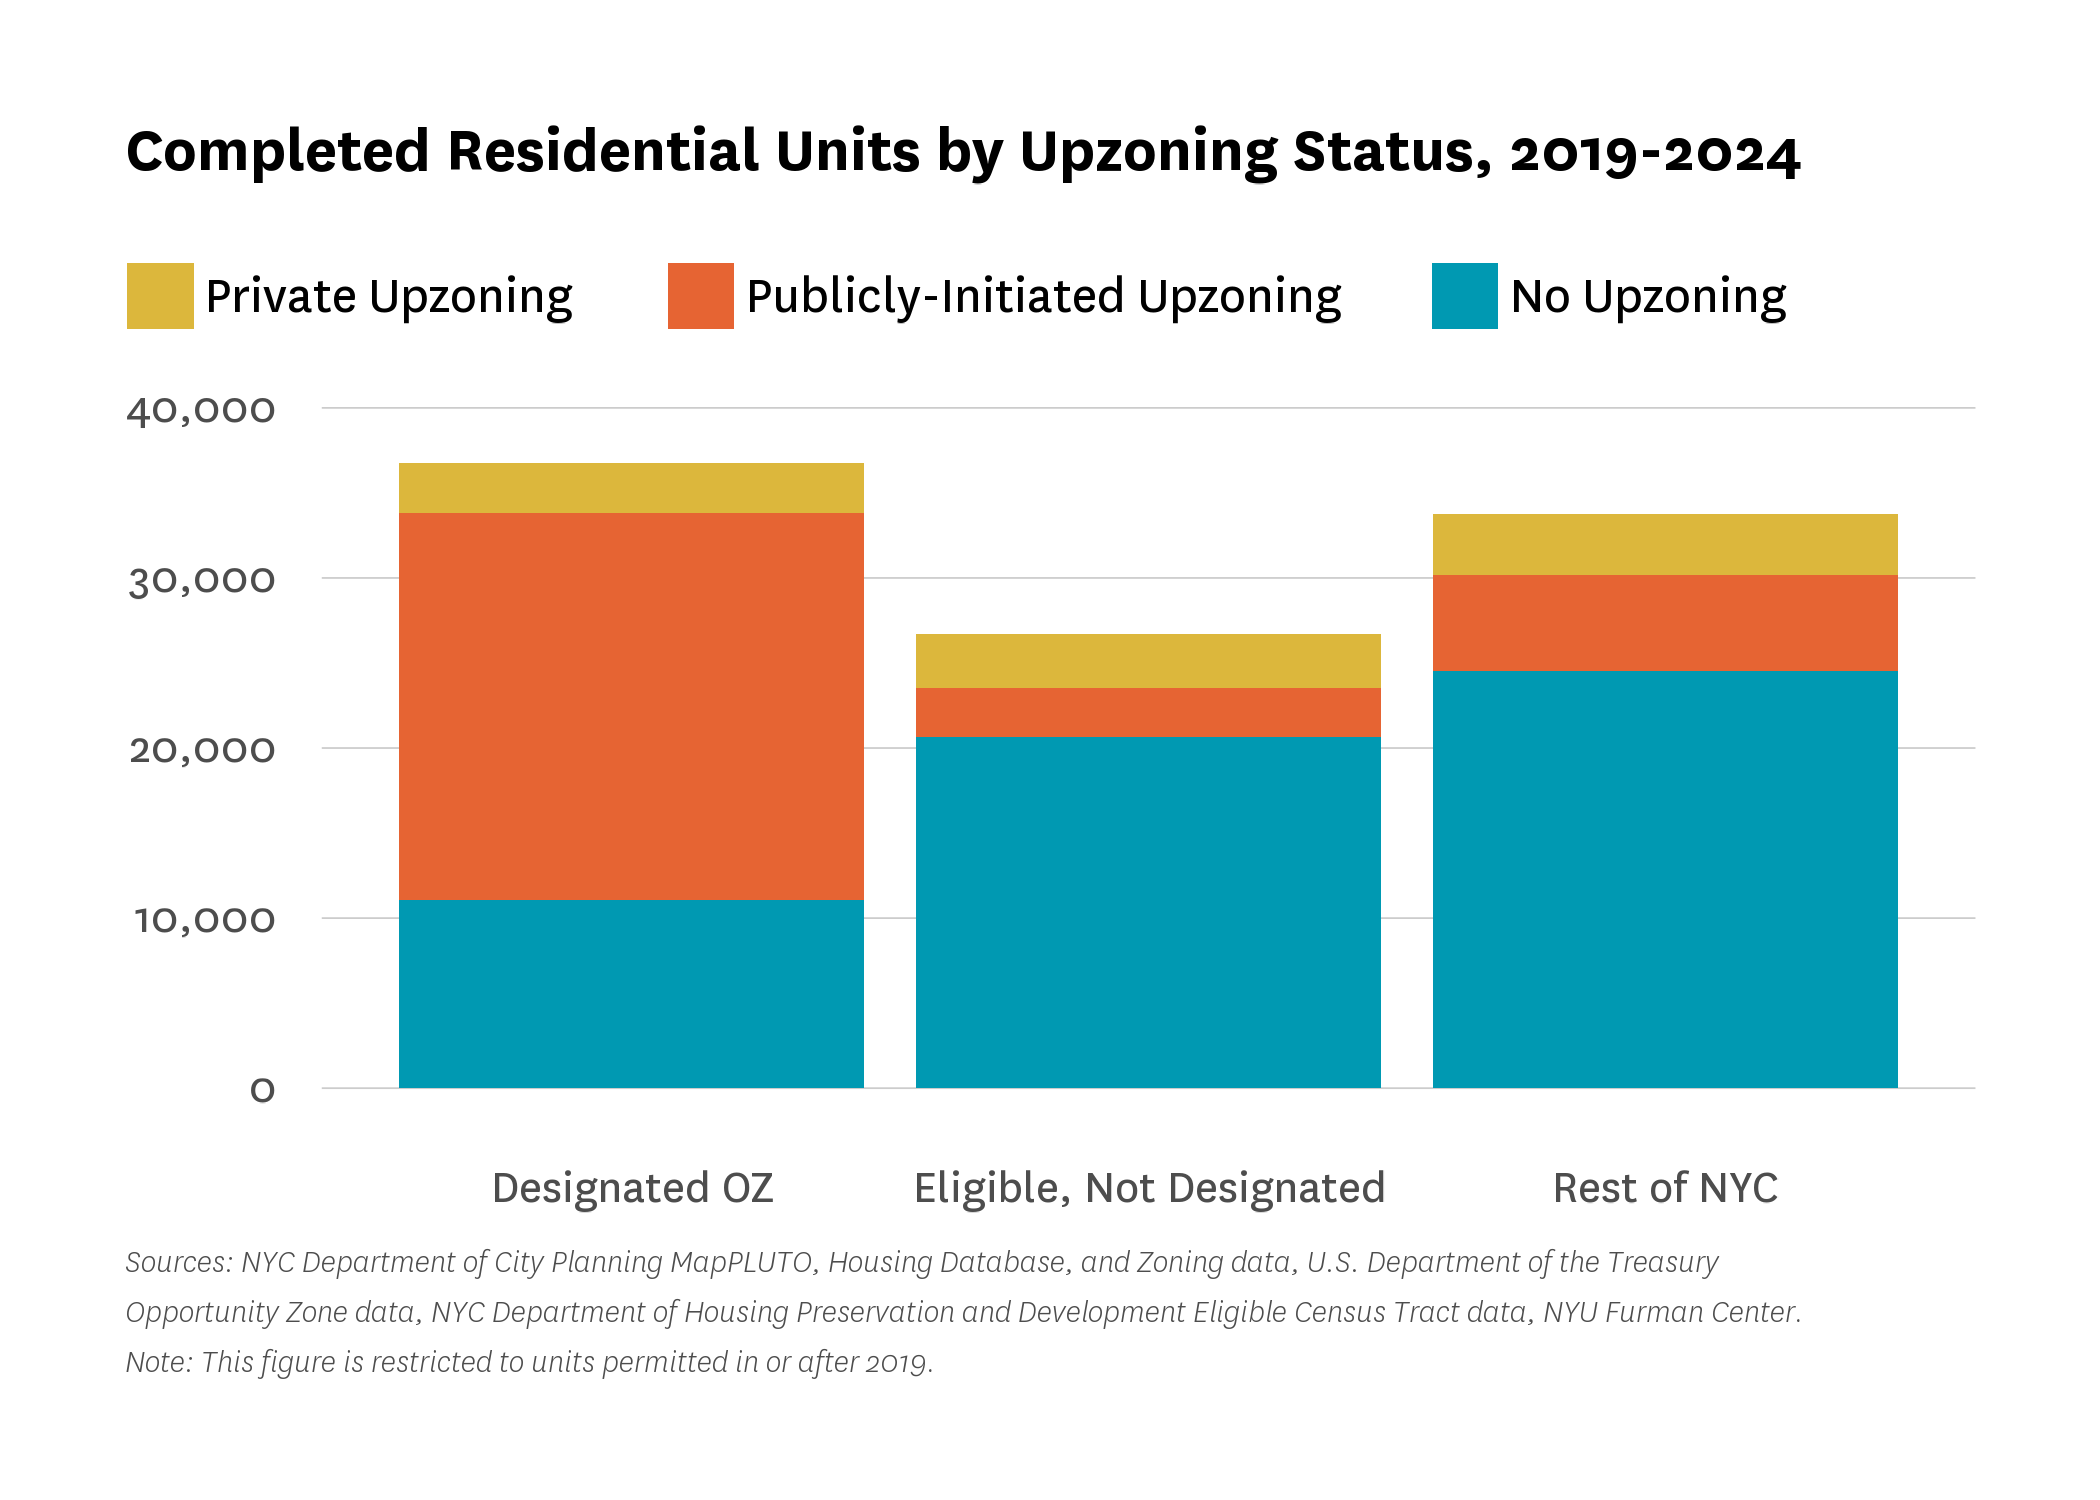
Publicly initiated upzonings—those advanced by city agencies—accounted for the overwhelming majority of this development, underscoring the importance of local planning efforts in unlocking new housing capacity.
When completions are normalized by the number of existing residential units in 2019, the differences become even more pronounced (Figure 23). OZ tracts saw significantly higher rates of development, but the concentration of that growth in upzoned areas highlights the role of city-led land use interventions as a powerful catalyst for new housing construction in these areas, and makes it impossible to discern how much development the OZ designation would have spurred absent those land use initiatives. Indeed, as evidenced by the blue portions of the bar graphs in Figure 23, the normalized completion rates of units in non-upzoned OZ tracts is very similar to the completion rates of units in non-upzoned eligible but not designated tracts, suggesting that OZ designation was not a primary driver of development.
Figure 23:
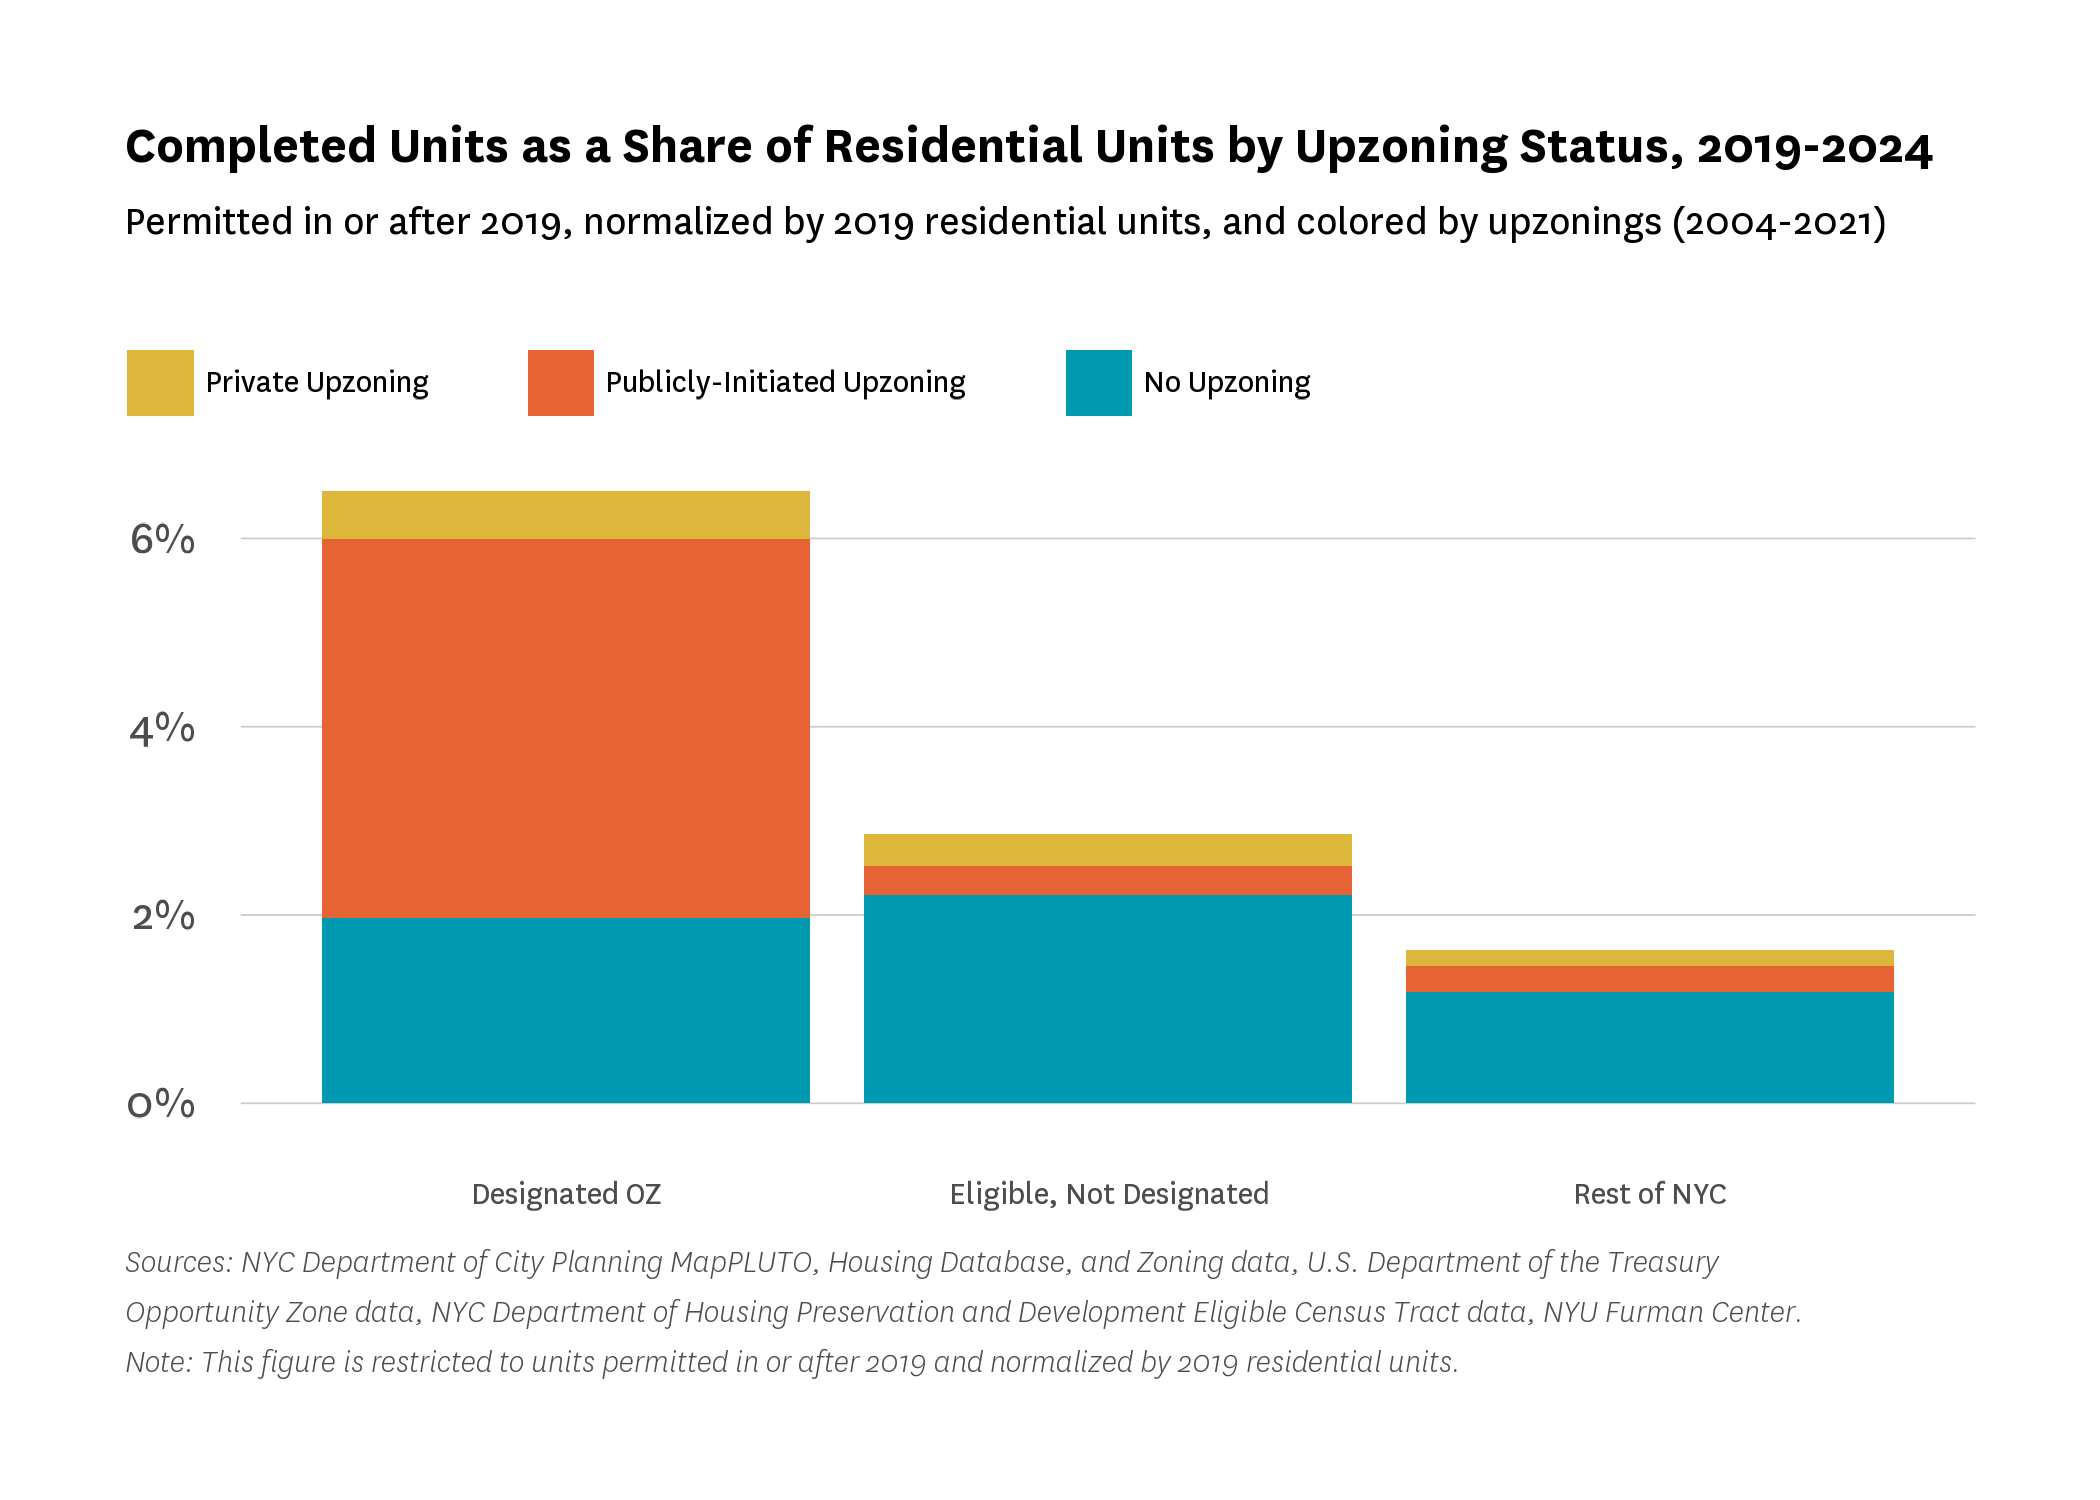
Finally, development in rezoned areas extended beyond Opportunity Zones, which suggests that zoning capacity, rather than designation, could be a more consistent driver of large-scale residential development.
Many of the largest residential developments completed in OZs between 2019 and 2024 were located in areas that had previously been upzoned through city-initiated rezonings, suggesting that these zoning changes played a significant role in shaping development patterns.
A map of projects completed during this period—sized by unit count and overlaid on designated OZ tracts and upzoned areas—reveals that large developments tend to cluster around upzonings. However, new housing is not uniformly clustered within the OZ tracts (Figure 24). In East New York, for example, roughly half of the neighborhood’s upzoned area was also designated as an OZ, but new development appears relatively evenly distributed across the entire upzoned area, regardless of OZ designation (Figure 25).
The largest properties built in OZs after designation exemplified this pattern: 101 Lincoln Avenue in the Bronx (921 units), and two properties in Long Island City, Queens: 2-21 Malt Drive (811 units), and 52-03 Center Boulevard (800 units). All three large projects are located in neighborhoods that were upzoned in the late 2000s: the Port Morris/Bruckner Boulevard Rezoning in 2005, and the Hunter’s Point South Rezoning in 2008. 18
These findings suggest that zoning capacity, rather than OZ designation, could be a more consistent driver of large-scale residential development. While OZ status may have added a layer of financial benefit (and could have helped projects “pencil out”), the groundwork for these projects was laid years earlier through city-led land use decisions.
Figure 24: Completed Residential Units (2019-2024, permitted on or after 2019), Opportunity Zones, and 2004-2021 Upzonings
Sources: U.S. Department of the Treasury Opportunity Zone data, Department NYC Department of Housing Preservation and Development Eligible Census Tract data, NYC Department of City Planning’s PLUTO (2024), Housing Database (2019-2024), GIS Zoning data (2004-2024), Zoning Application Portal (2004-2024), NYU Furman Center.
Figure 25: Completed Residential Units (2019-2024, permitting in or after 2019), Opportunity Zones, and 2004-2024 Upzonings in East New York
Sources: U.S. Department of the Treasury Opportunity Zone data, Department NYC Department of Housing Preservation and Development Eligible Census Tract data, NYC Department of City Planning’s PLUTO (2024), Housing Database (2019-2024), GIS Zoning data (2004-2024), Zoning Application Portal (2004-2024), NYU Furman Center.
In sum, while designated OZs in New York City saw higher levels of residential development following program operationalization, most of that activity was concentrated in areas already primed for growth— including areas allowed more density by prior rezonings, tax incentives like 421-a, and strong market fundamentals as evidenced by the fact that the best performing tracts were not designated because of low-incomes. These trends suggest that the OZ program may be limited in its ability to spur additional affordable housing production or redirect investment to distressed neighborhoods without pairing with other tools or programs. The observed trends suggest that the program often layered onto existing development pipelines, with potentially limited impact on housing development on its own, and to the extent the program drove development, it was more likely to produce market rate units.
Read the rest of the report:
Footnotes
- [1] U.S. House Committee on Ways & Means. (2025, May 12). The One, Big, Beautiful Bill delivers on President Trump’s priorities to restore and expand Trump-era growth and relief for families, workers, and small businesses. https://waysandmeans.house.gov/2025/05/12/the-one-big-beautiful-bill-delivers-on-president-trumps-priorities-to-restore-and-expand-trump-era-growth-and-relief-for-families-workers-and-small-businesses/
- [2] Colton, E. (2025, March 30). HUD chief showcases how private-public partnerships uplift economically neglected areas in Philly tour. Fox News. https://www.foxnews.com/politics/hud-chief-showcases-how-private-public-partnerships-uplift-economically-distressed-areas-philly-tour?msockid=0987ba15177d64062fabaf2416a965cd
- [3] Interview with HDC/HPD staff; see also: Citizens Housing and Planning Council. NYC’s Opportunity Zones: Interactive map. https://chpcny.org/visualization/nycs-opportunity-zones-interactive-map/
- [4] The OZ program determined eligibility using the 2011-2015 5-year American Community Survey data. Some tracts that were qualified using the 2015 data would no longer be eligible if more recent data were used. See Section 2, Figure 9: Designated and Eligible Opportunity Zones.
- [5] I.R.C. § 1400Z-1(f).
- [6] The total monthly amount a tenant household is responsible for paying, including utilities, as noted in the lease.
- [7] The Furman Center considers a site “soft” if it has a lot size greater than or equal to 1,700 square feet; it is vacant or used as parking; zoned for residential use; is not landmarked or in a historic district; and was not recently the site of construction or alteration.
- [8] We do not attempt a difference-in-difference regression analysis that would allow us to control for differences between the OZ and eligible but not completed tracts for a number of reasons, including small sample size.
- [9] In this analysis, we look at the tax exemption known as 421-a and Affordable New York. Our analysis does not include 485-x properties.
- [10] Empire State Development. (2018, April 20). New York State recommends 514 census tracts for designation under federal Opportunity Zone program. https://esd.ny.gov/esd-media-center/press-releases/new-york-state-recommends-514-census-tracts-designation-under
- [11] U.S. Department of the Treasury. (2019, December 19). Treasury and IRS issue final regulations on Opportunity Zones [Press release]. https://home.treasury.gov/news/press-releases/sm864
- [12] To estimate the “completion rate”, for each year, we take the number of newly completed residential units in a given neighborhood type (Opportunity Zones, eligible but not designated tracts, or the rest of the city) and divide that number by the number of residential units in that neighborhood type.
- [13] Campion, S. (2019, August). Opportunity Zones in New York State and New York City. Citizens Budget Commission of New York. https://cbcny.org/research/opportunity-zones-new-york-state-and-city
- [14] Interview with HDC/HPD staff; see also: Citizens Housing and Planning Council. NYC’s Opportunity Zones: Interactive map. https://chpcny.org/visualization/nycs-opportunity-zones-interactive-map/; Section 2, Figure 9: Designated and Eligible Opportunity Zones.
- [15] We limit Figures 19 and 20 to 2023 due to lags in data on tax exemptions that make it challenging to identify which properties benefitted from those programs in recent years.
- [16] Note that these properties may have also been supported by 421-a, in addition to other government programs. In contrast, Figure 19 shows properties that were only supported by 421-a
- [17] Please see the technical appendix for more details regarding the identification of upzonings.
- [18] CityLand NYC. (2005, April 15). Council, after two delays, approves Port Morris plan. https://www.citylandnyc.org/council-after-two-delays-approves-port-morris-plan/; Brown, E. (2008, November 13). Hail the mega-project! Council OKs Willets, Hunter’s Point South. https://observer.com/2008/11/hail-the-megaproject-council-oks-willets-hunters-point-south/