
State of the City 2024
Federal Programs
How Much Federal Funding Does New York City Receive?
New York City’s housing system is shaped not only by local policies but also by billions of dollars in federal funding each year. Federal resources help low-income families afford their rent, fund the repair of aging public housing, support the construction of new affordable homes, pay for the inspections necessary to respond to complaints about housing quality, make emergency repairs, and provide services to people experiencing homelessness.
In this section, we examine the scale of federal funding for major housing and homelessness programs, as well as how that funding has changed in recent years. Next, we consider each major program, arranged by funding mechanism: direct funding, block grants, competitive grants, and tax expenditures. We review the objective, structure, and scale of each program. Finally, where possible, we map each program across the city by tracing the neighborhoods, properties, and units that receive funding, illustrating which areas currently benefit and would stand to lose the most if funding for these programs were reduced.
New York City relies upon more than $7.2 billion annually from the federal government’s major housing and homelessness programs, with the most significant amounts allocated to support public housing, project based rental assistance and Section 8 Housing Choice Vouchers.
This estimate includes $6.33 billion in assistance from the U.S. Department of Housing and Urban Development (HUD) across a number of programs and the U.S. Department of the Treasury’s Low-Income Housing Tax Credit (LIHTC) program attracting more than $833 million in upfront investment in low-income housing development. The amount of investment generated as a result of the Opportunity Zone (OZ) program in New York City is unknown.
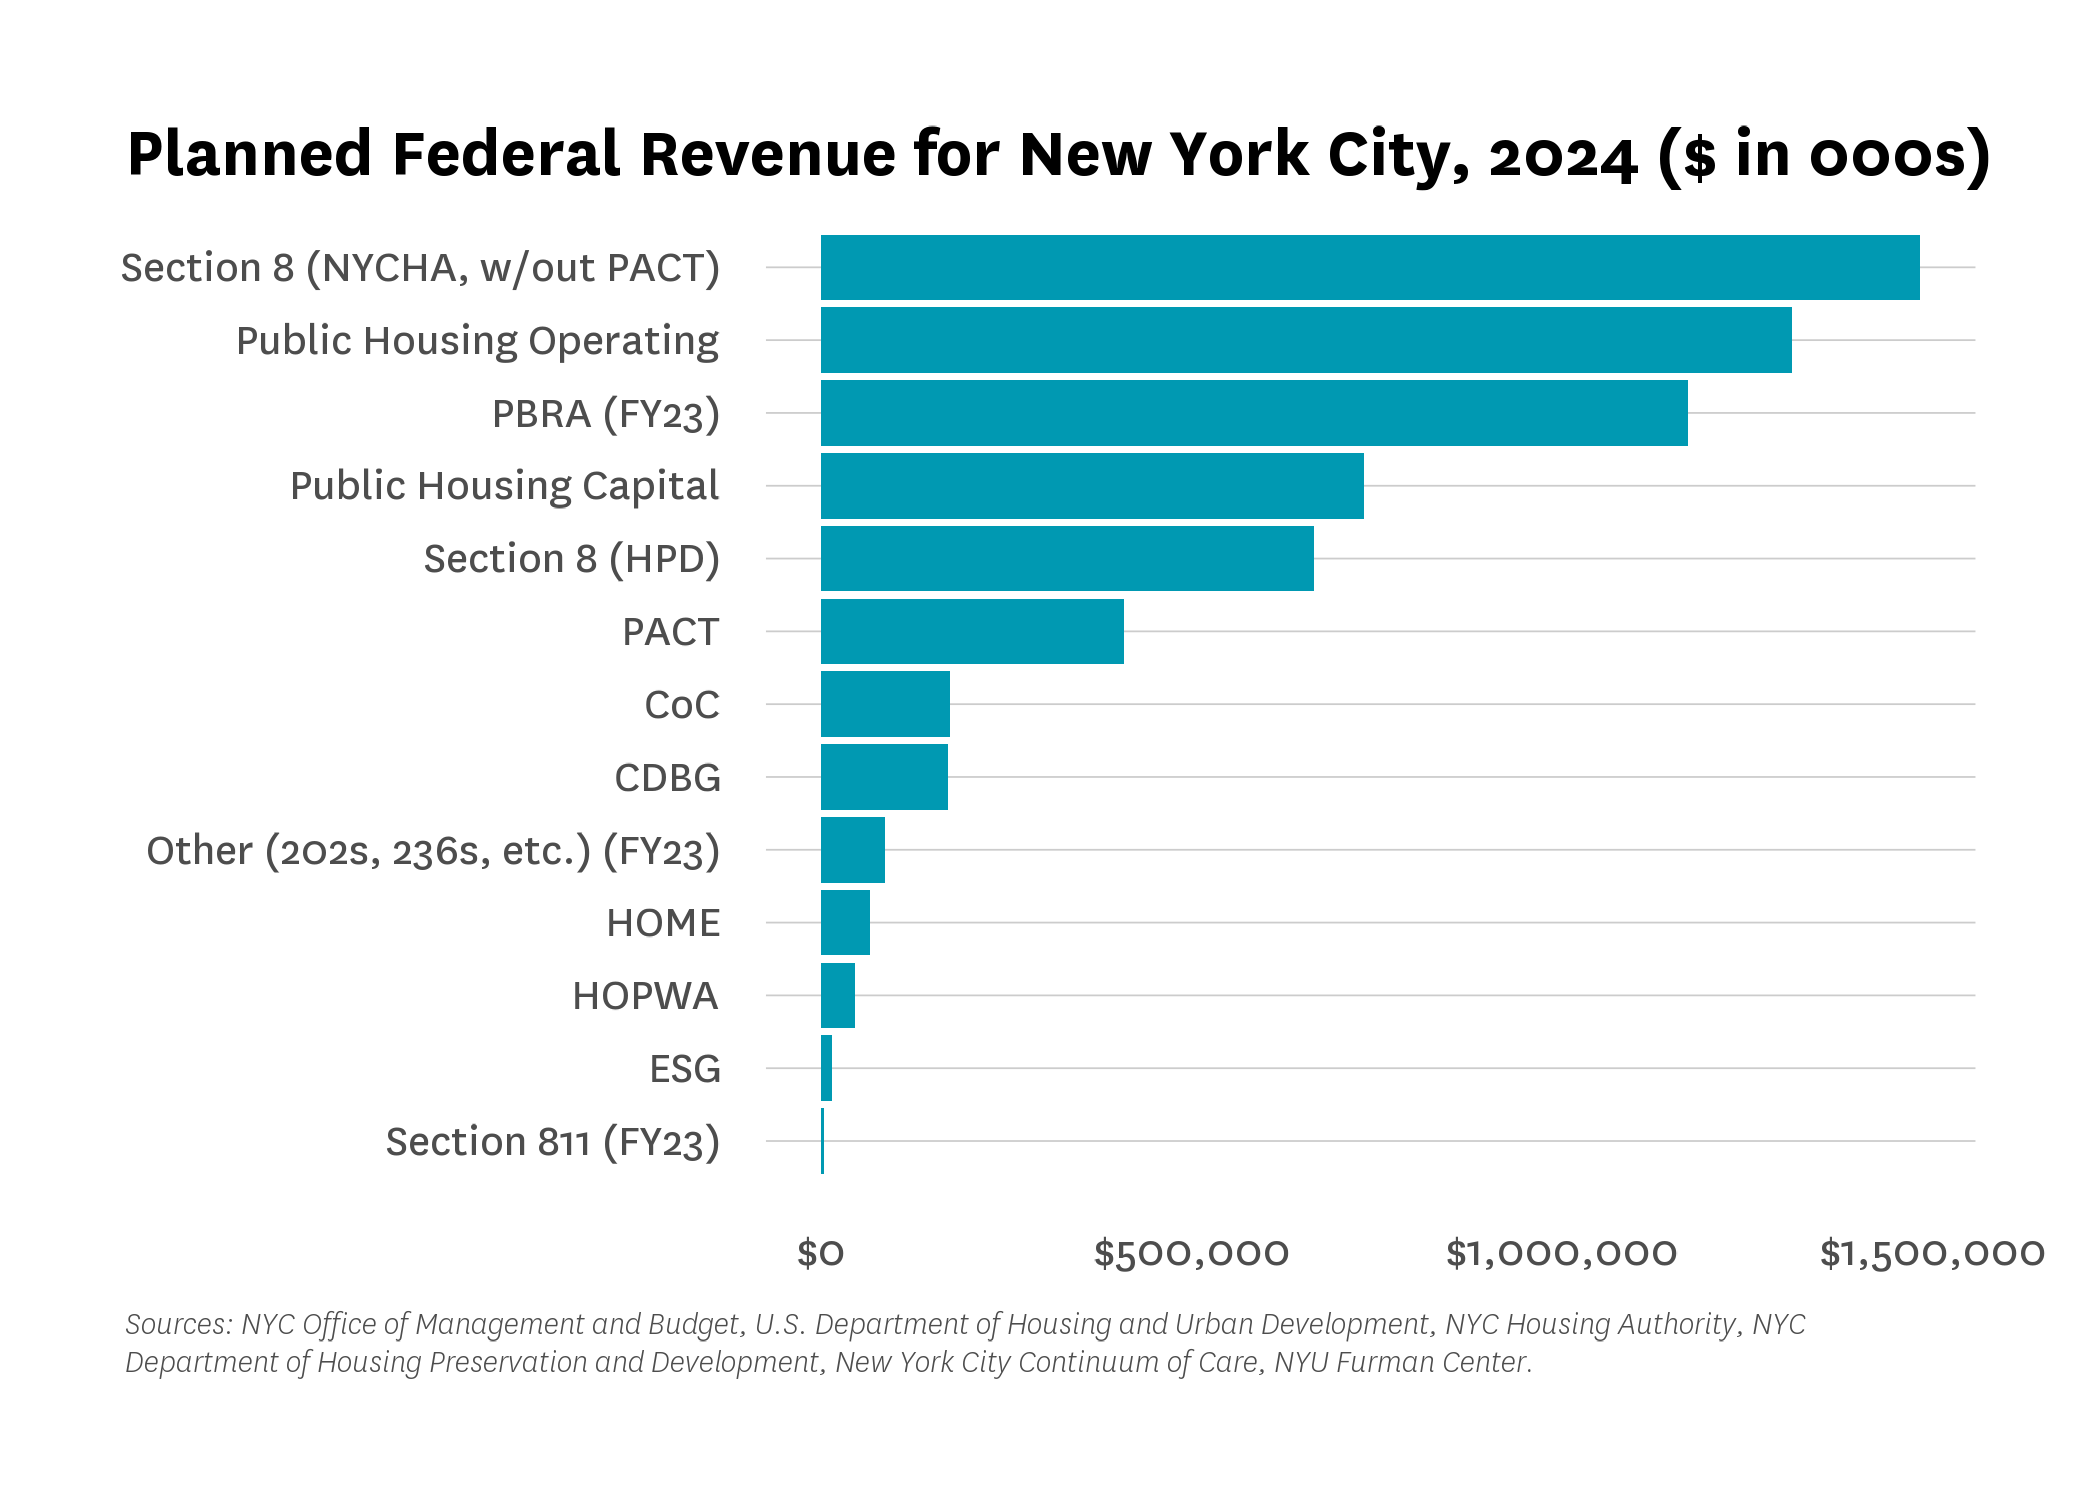
New York City’s programs to offer rental assistance and create and preserve affordable housing rely heavily on federal funding. Government agencies and authorities in New York City expected to receive and spend $5.1 billion in 2024 and another $1.2 billion was spent in New York City by HUD via the project based rental assistance program (Figure 1).1
The New York City Housing Authority (NYCHA) is the largest recipient, expected to receive more than $3.9 billion in 2024 for Housing Choice Vouchers (HCVs), operating subsidy for Section 9 public housing, and capital funds to renovate Section 9 public housing or to convert properties under the Permanent Affordability Commitment Together (PACT) program. Separately, the New York City Department of Housing Preservation and Development (HPD) received $665 million to fund its HCV program. New York City also received, directly from HUD, close to $1.3 billion in subsidy for Project-Based Rental Assistance (PBRA), Section 811, and other multifamily housing funding programs including Section 202 and 236.
As Figure 1 shows, the city also expected to receive more than $470 million in 2024 from other key federal programs that are comparatively smaller in scale. The city relies on Community Development Block Grant (CDBG) funds to support improvements to housing quality through code enforcement, lead abatement, and emergency repairs. It uses HOME Investment Partnerships Program (HOME) funding primarily as a source of funds to develop and preserve affordable senior housing. Housing Opportunities for Persons With AIDS (HOPWA) funding provides housing assistance and supportive services to low-income people living with HIV/AIDS, while Emergency Solutions Grants (ESG) and Continuum of Care (CoC) funding support the City’s homelessness efforts.
Figure 1 does not include funding for tax expenditure programs like LIHTC, which is not a direct form of subsidy to the city, but which is nevertheless critically important to the city’s ability to finance new construction and preservation of affordable housing. Unlike grants or appropriations, tax expenditures reduce tax liability for investors who provide capital for housing development or rehabilitation. These benefits flow through the tax code rather than through a direct payment of funds to the city (although in the case of LIHTC, tax credits are allocated to New York State Homes and Community Renewal (HCR) or HPD, which then allocates them to developers). Both LIHTC and the OZ program are described in more detail below.
Figure 1:
Layering Federal Funding Sources: A Case Study
One example of the use of different federal funding sources is Nehemiah Spring Creek in East New York, a multiphase project led by East Brooklyn Congregations. The project features newly constructed affordable housing, including housing for seniors. Different phases of the project have layered together tax-exempt volume cap bonds and as-of-right 4 percent LIHTC, Section 8 Project-Based Vouchers (PBVs) via NYCHA, recycled bond financing, and HOME funds flowing through HPD’s Senior Affordable Rental Apartments (SARA) program. The most recent phase of the project was insured via HUD’s Risk Share Program.2
Nehemiah Spring Creek Senior Residences

Source: SLCE Architects, https://www.slcearch.com/project/nehemiah-spring-creek/
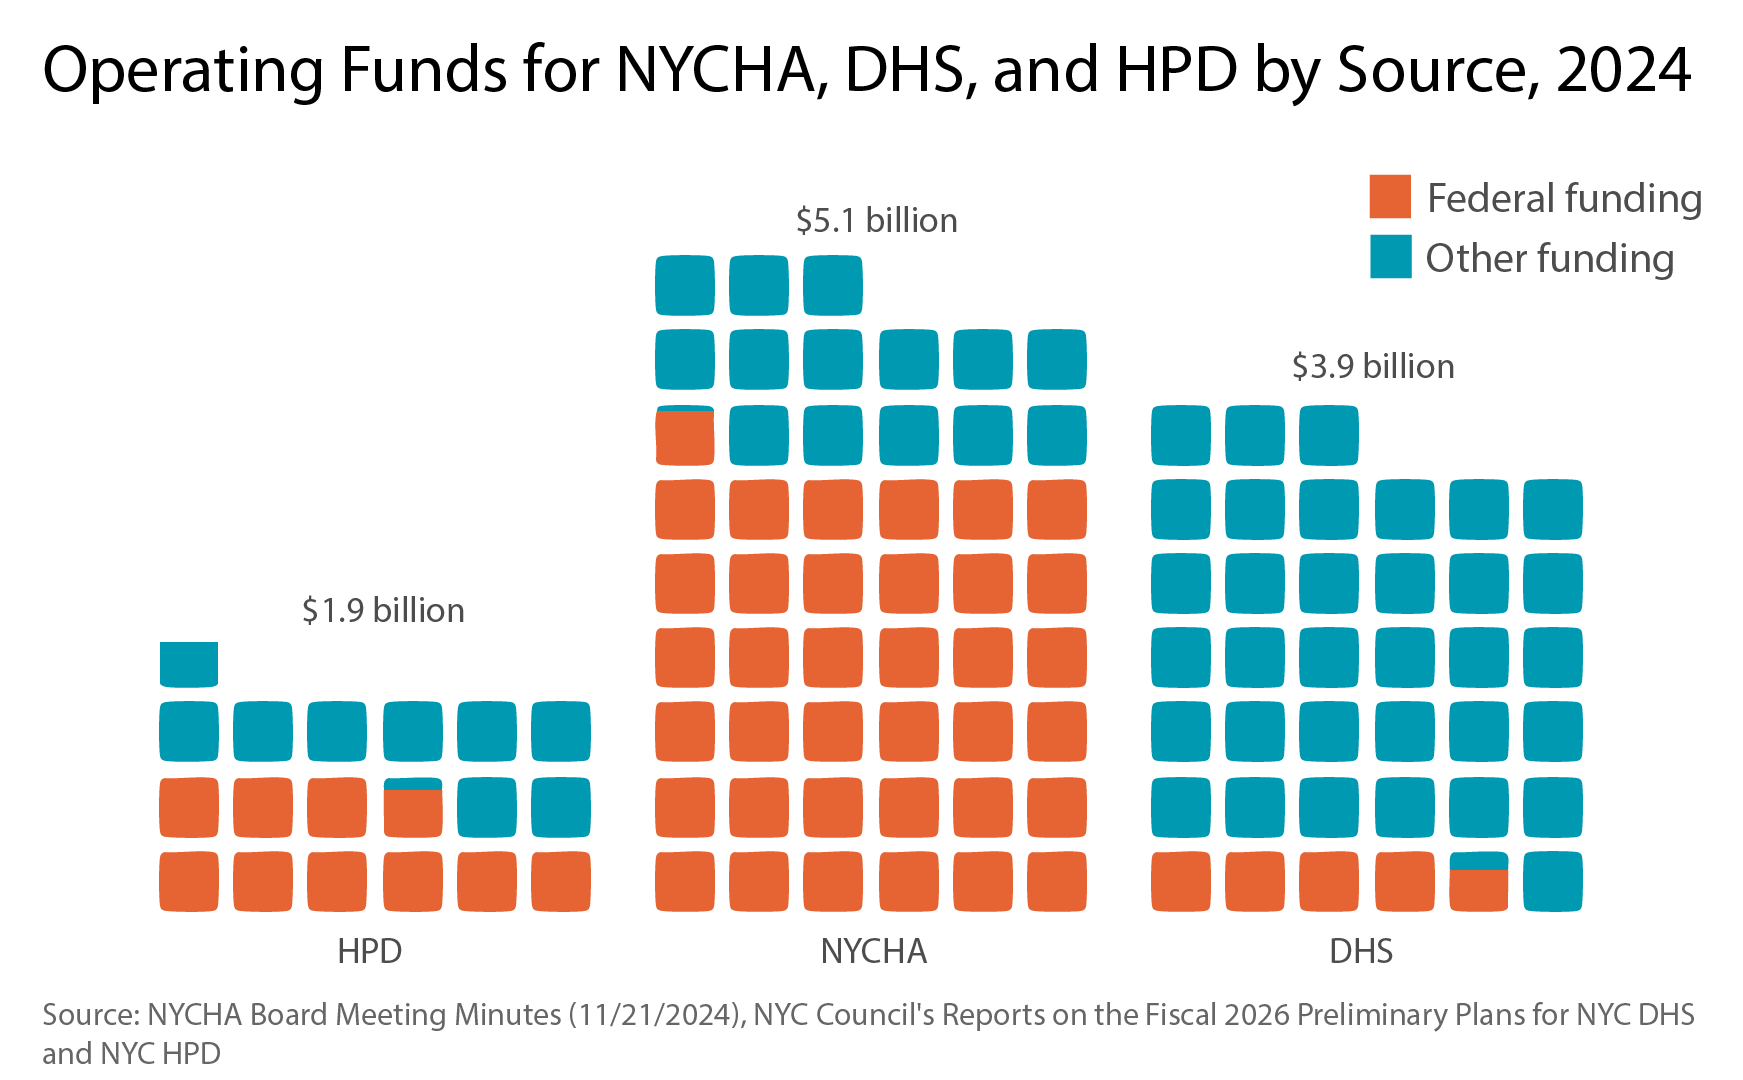
In 2024, federal funding accounted for the majority of the operating budgets of the Department of Housing Preservation and Development and the New York City Housing Authority, and a significant share of the Department of Homeless Services’ operating budget.
In 2024, federal funding accounted for 54 percent of HPD’s operating budget, totaling more than $972 million; 75 percent of NYCHA’s operating budget, totaling more than $3.7 billion; and 12 percent of the Department of Homeless Services’ (DHS) operating budget, totaling more than $465 million. These totals, illustrated in Figure 2, underscore the extent to which the city’s core housing and homeless operations rely on federal funding.
Figure 2:
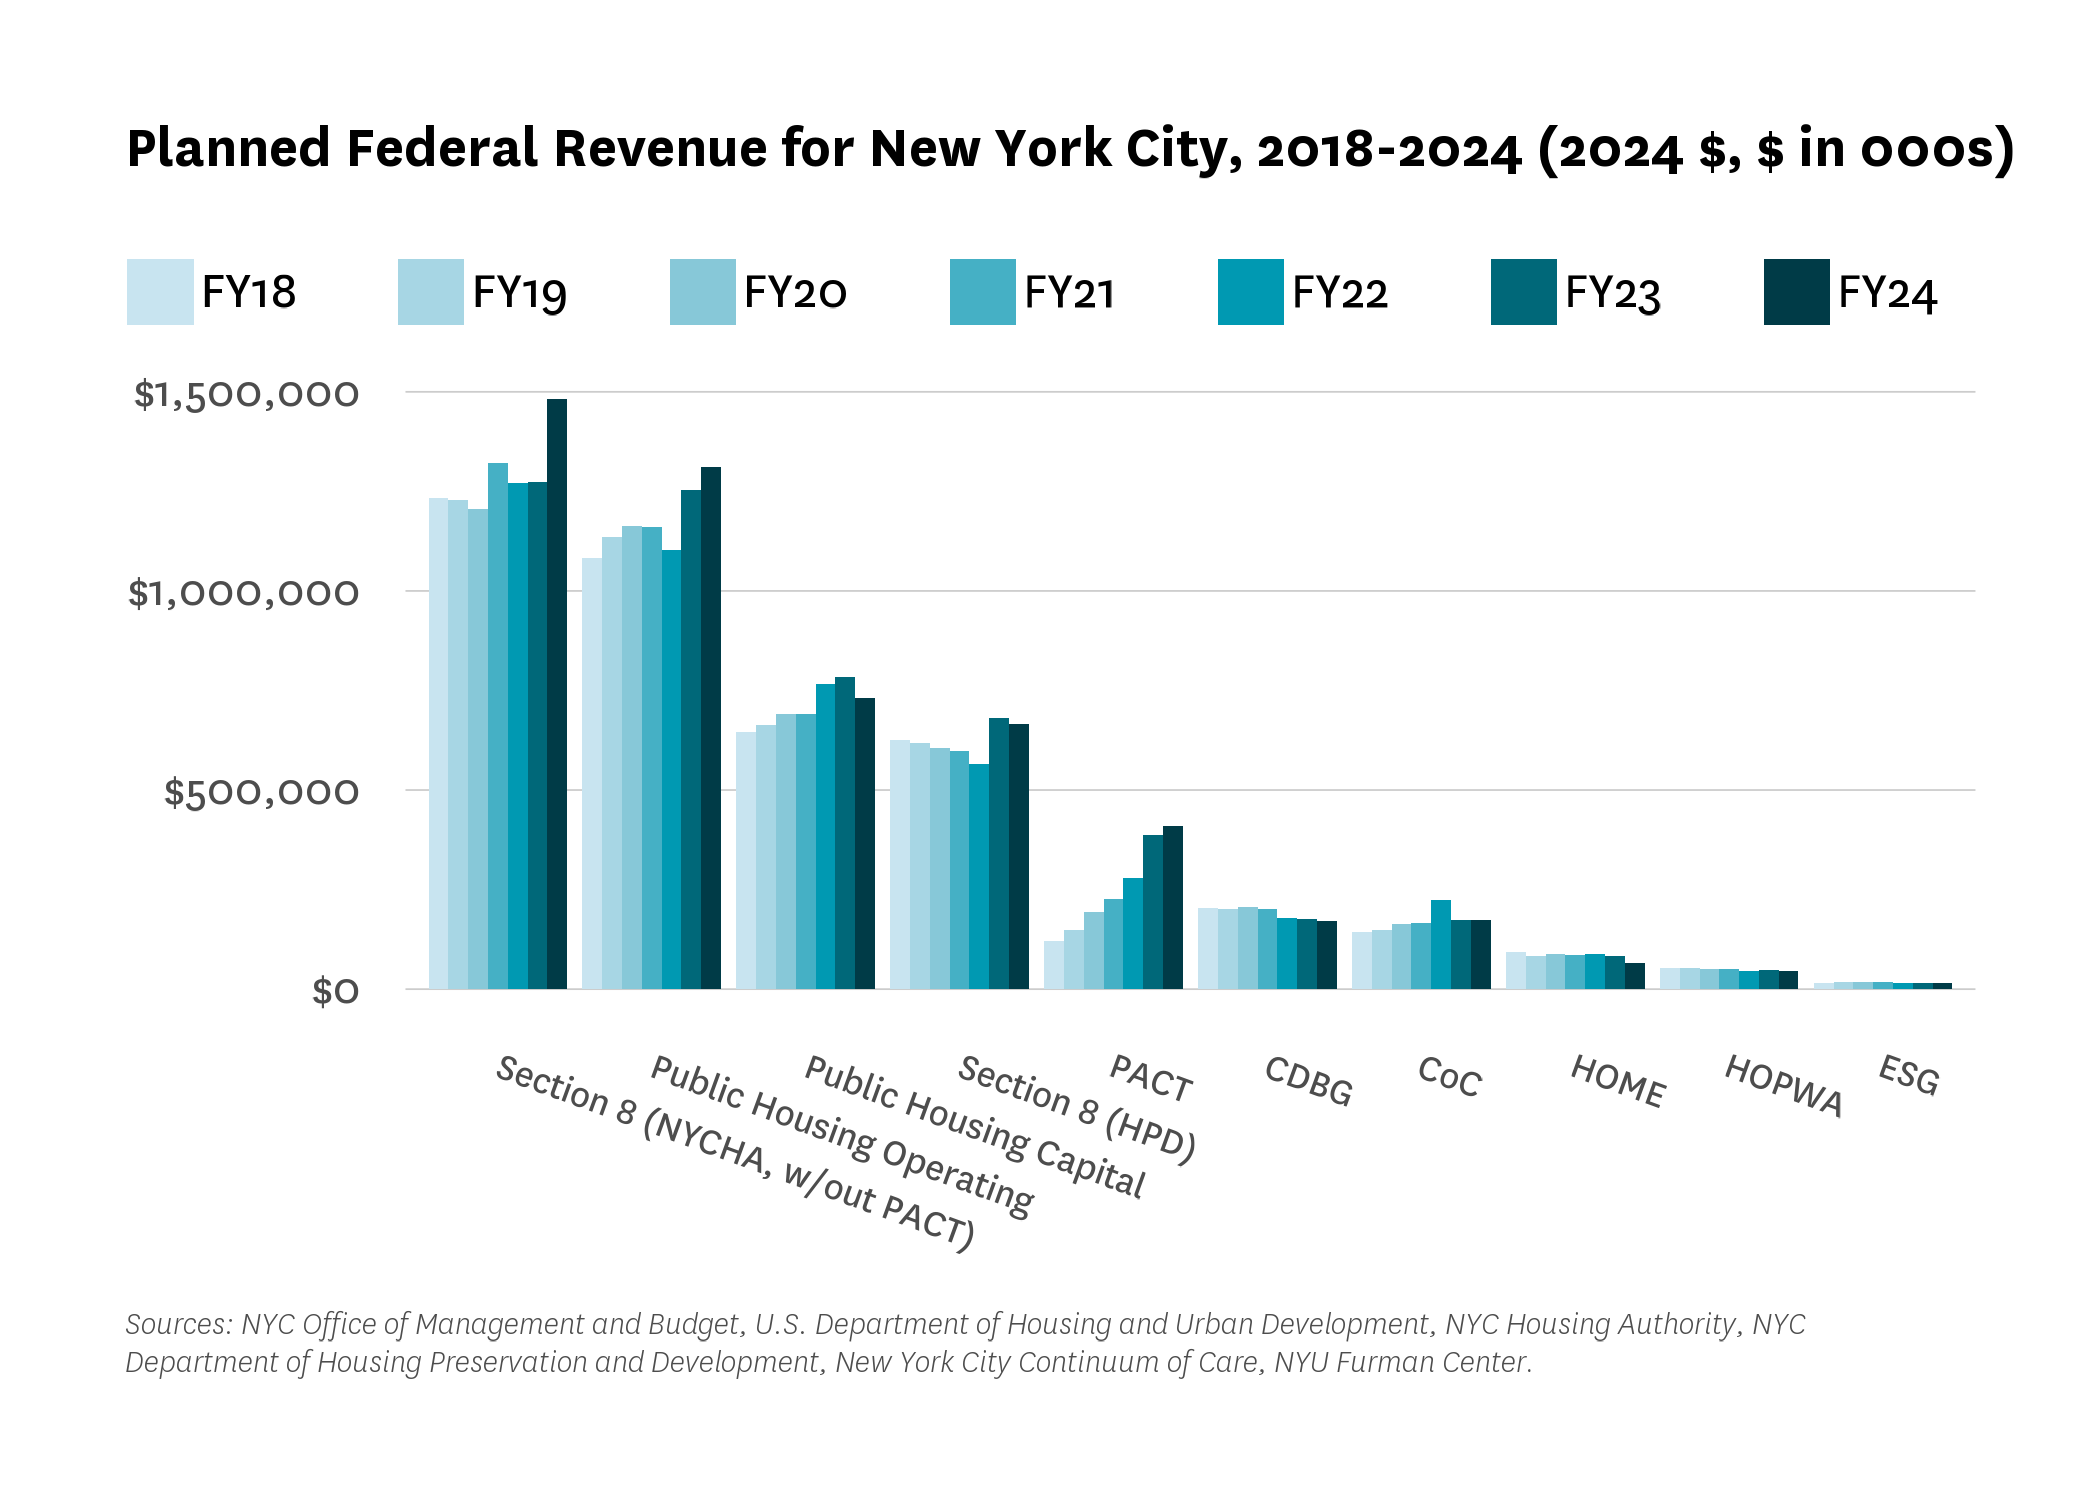
After adjusting for inflation, federal funding for Community Development Block Grants, the HOME Investment Partnership Program, Housing Opportunities for Persons With AIDS, and Emergency Solutions Grants has decreased over the past seven years. Funding levels for the other key programs increased in real terms over the same period.
While some programs, like CDBG, remained relatively stable in nominal terms over the last seven years, their funding has declined after adjusting for inflation (Figure 3). HOME was the only program that saw a decrease in funding in nominal terms. However, after adjusting for inflation, annual funding for CDBG, HOME, HOPWA, and ESG have all decreased since 2018.
In contrast, some of the larger programs have seen notable increases in funding. The PACT program in New York City has increased in size in real terms because Congress allowed more public housing units to be eligible for conversion,3and NYCHA has expanded its use of the program.4 In addition, the cost of the NYCHA and HPD Housing Choice Voucher programs have increased due to increases in contract rents, changes in the household income of voucher holders, and a rise in the Fair Market Rents set by HUD.
Figure 3:
To illustrate the scale and role of federal housing and homelessness funding in New York City, the sections below describe the key federal programs by funding type.5 For each type, the report outlines the structure of the program and funding amounts from a national perspective and then explains how the program is implemented in New York City. Where possible, the report also provides maps to show how federal funds flow into New York City’s neighborhoods.
I. Direct Funding Supports Public Housing, Housing Choice Vouchers and Project Based Rental Assistance
The most significant source of federal support for housing in New York City is the money Congress allocates to support public housing and Section 8 HCVs. In 2024, the planned federal revenue for NYCHA’s public housing (Section 9) operating subsidy was $1.3 billion across more than 154,000 households. Another $408 million was planned to subsidize rents in units rehabbed and converted under NYCHA’s PACT program across more than 21,000 units. Combined, NYCHA and HPD budgeted more than $2.1 billion in federal funds for HCV programs across almost 123,000 households not covered by the PACT program.
1. Public Housing and Converted Developments
NYCHA is the nation’s oldest and largest public housing authority (PHA). NYCHA owns and manages 244 public housing developments, funded by HUD under Section 9 of the 1937 U.S. Housing Act. These developments house around 301,370 individuals in 154,198 households.6 In addition to managing public housing, NYCHA administers federal funds for HCVs and works with private and non-profit partners to fund conversions under its PACT program.7 As of January 2025, 106,483 households received HCV assistance through NYCHA for vouchers those households can use to rent units in market rate or subsidized buildings, and 43,940 residents lived in 23,367 units managed under the PACT program.8
a. Public Housing and NYCHA’s Section 9 Operating Subsidy
NYCHA’s public housing tenants generally pay 30 percent of their income–or, if applicable, their public assistance shelter allowance–toward rent. HUD provides an operating subsidy to NYCHA and other PHAs to fund maintenance and other operating costs that cannot be covered by rental revenue alone. The overall appropriation for the public housing operating fund for public housing nationwide was $5.5 billion last year.9 NYCHA expected to receive $1.3 billion in operating subsidies based on the statutory formula.
To qualify for public housing, households must be low-income, which HUD defines as having household income at admission that is 80 percent or less of the area median income (AMI).10 Additionally, at least 40 percent of public housing admissions must have incomes below 30 percent AMI.11 The average public housing family’s income in New York City is $25,057 and the average monthly rent is $588. 12
NYCHA, and PHAs across the country, occupy a unique role in the housing market by providing permanent, deeply affordable housing to very low-income households who are often priced out of the private rental market. Due to long-term disinvestment in an aging housing stock, the long tenure of existing tenants (the average tenure of a NYCHA public housing resident is 26.3 years)13 and restrictions on the construction of new public housing units,14 there are not many new admissions each year. Across the country, 1.6 million people live in public housing, a population that increasingly comprises older adults and people with disabilities.15
b. Public Housing Capital Programs and NYCHA’s Use of the Federal Capital Fund, PACT and the Preservation Trust
The Public Housing Capital Fund:
Federal capital funding for the public housing subsidized under Section 9 has not kept up with long-term capital needs, leaving many developments in significant disrepair. HUD estimated in 2023 that public housing authorities nationwide were facing a collective capital need of $115 billion.16 Nevertheless, in 2024, Congress appropriated only $3.4 billion nationwide for the federal public housing capital fund. NYCHA, which faces a 20 year capital need estimated to be at least $78.3 billion (54% of which covers repairs that “require replacement immediately or in the next year”),17 received more than $732.3 million according to a funding formula set by HUD.18
The Rental Assistance Demonstration Program:
To address this persistent funding gap, the Obama administration launched the rental assistance demonstration (RAD) program, allowing public housing units to convert from Section 9 subsidies to PBVs or PBRA funded under the Section 8 program.19 Because the per unit operating subsidies provided under Section 8 are larger than Section 9, and are adjusted over time based on HUD’s calculations of market rents, and because funding is promised under long term funding contracts that can be leveraged, converting public housing to the Section 8 program provides PHAs with more funds to meet operating expenses and fund capital improvements. Under RAD, housing authorities can use project-based Section 8 contracts to leverage public and private debt and equity to invest in developments.
The Permanent Affordability Commitment Together Program and the Public Housing Preservation Trust:
To build on the RAD model, New York City has established two large-scale conversion efforts–PACT and the NYC Public Housing Preservation Trust20–to expand access to capital and accelerate building and apartment upgrades across its public housing portfolio in order to address deterioration of the buildings.
In New York City under PACT, NYCHA enters into a long-term ground lease with private and non-profit partners, who rehabilitate the properties and serve as the property manager.21 NYCHA retains ownership of the buildings and supervises the partner’s management.22 Under PACT, NYCHA had converted 20,704 rehabilitated units, serving 18,588 households, with Section 8 financing as of March 202423 and has converted 25,332 units as of October 2024.24
The average PACT household’s income is $27,169, and the average monthly household rent is $592.25 We estimate that more than $408 million in federal funds through vouchers supported the PACT program’s operations in 2024.
In 2022, the New York State legislature established a new entity, the Public Housing Preservation Trust, which was authorized to rehabilitate up to 25,000 NYCHA public housing units. Under the Trust’s model, NYCHA leverages Section 8 contracts to raise funds to support the rehabilitation of the properties, but NYCHA remains the manager of the property. The Trust also ensures resident representation on its nine-member board.26 Since 2023, three developments housing a total of 1,567 households have agreed to be rehabilitated through the Trust’s model.27
How Public Housing and PACT Dollars Flow into New York City’s Neighborhoods:
Some neighborhoods in New York City would be more significantly affected than others by a loss in federal funds supporting these programs. Figure 4 shows NYCHA and PACT properties across the city. While some sections of the city contain no NYCHA properties, NYCHA operates housing developments across all five boroughs, with larger concentrations in the south Bronx, northern Manhattan, the Lower East Side, and parts of Brooklyn. There is also a concentration of single family homes and duplexes managed by NYCHA in Queens.28 PACT developments are concentrated in some of the same neighborhoods, including the south Bronx, northern Manhattan, and parts of Brooklyn. Neighborhoods with high concentrations of public housing and PACT developments would feel the effects of cuts to Section 9 and Section 8 funding most acutely. Cuts to those programs could result in a variety of negative impacts, including hindering NYCHA’s ability to perform maintenance on units and building systems that are already facing significant capital needs.
Figure 4: NYCHA and PACT Properties (2024)
Sources: New York City Housing Authority data on NYCHA and PACT properties (2024), NYU Furman Center.
2. Section 8 Housing Choice Voucher
The Section 8 HCV program is the largest rental assistance initiative in the U.S.29 The program provides rental assistance to low-income households through tenant-based vouchers, which are allocated to a specific household that chooses where to use the voucher, and project-based vouchers, which are tied to specific housing units. HUD allocates vouchers to individual PHAs, which then distribute them to eligible, selected households.30 5.2 million people in 2.3 million households receive vouchers across the country31 at a cost of more than $32 billion in fiscal year 2024.32 According to HUD 2022 administrative data, almost 40 percent of tenants who received Section 8 rental assistance are children, and 16 percent were over 61 years old. In addition, a quarter of recipients were disabled.33
To be eligible for a Section 8 HCV, households must be very low-income, which HUD defines as earning 50 percent of AMI or less.34 Across each PHA program, 75 percent of voucher holders must have incomes that are less than 30 percent of AMI.35 Recipients are responsible for paying 30 percent of their annual income toward rent and utilities.36
New York City:
In New York City, HCVs are administered by NYCHA, HCR, and HPD. In 2022, almost 123,000 households used HCVs in New York City, 99,000 of which were tenant-based vouchers.37
a. Tenant-Based Vouchers
Under the HCV tenant-based voucher program, households may choose their own home, including their current apartment. The building owner receives the equivalent of the gap between what the tenant can pay (30% of household income) and the local payment standard established by HUD, typically at the metropolitan area level.38 Landlords are provided a monthly subsidy directly by the PHA.39
New York City:
In New York City, 98,516 households receive tenant-based vouchers, which make up about 80 percent of the city’s HCVs. About 4 percent of the city’s renter population uses tenant-based HCVs. In 2022, the median income of a voucher household in New York City was just $13,255.40 The city’s voucher households pay an average of $475 towards an average monthly rent of $1,768, and the program is effective at lowering rent burdens for the households fortunate enough to access it.41
Figure 5 shows the number of HCV tenant-based voucher holders by community district in 2022. These data are limited to federally funded vouchers allocated via HPD and NYCHA, which make up 93 percent of the city’s tenant-based vouchers. The remaining seven percent of vouchers are issued by HCR. Voucher holders are highly concentrated in neighborhoods with lower rents on average than those of renters overall, including the Fordham-Bedford Park-Norwood, Morris Heights-Mount Hope, and Highbridge-Concourse neighborhoods in the Bronx, East New York-Cypress Hills in Brooklyn, and Washington Heights-Inwood in Manhattan. In addition, the Greenpoint-Williamsburg and Coney Island-Brighton Beach and Borough Park-Kensington neighborhoods in Brooklyn are also home to a high number of voucher holders.
If federal funding for vouchers is reduced (or not accurately adjusted for inflation), some families that would have otherwise received vouchers will not have access to the program. In addition, some families that already have a voucher may lose it, likely placing those households at risk of eviction as they are unable to pay the full rent. A funding reduction would also impact operating incomes for landlords that rely on monthly voucher payments, putting the financial stability of these properties at risk. This map shows the neighborhoods with the highest concentration of voucher holders, areas that would suffer the most if the program were cut.
Figure 5: Number of Voucher Holders, New York City (2022)
Sources: U.S. Department of Housing and Urban Development (HUD) administrative data on public and assisted housing programs (2022), U.S. Census Bureau American Community Survey, New York City Department of City Planning, MapPLUTO 23v3.1, NYU Furman Center.
b. Project-Based Vouchers
Another component of the HCV program is the Project-Based Voucher (PBV) program. PBVs are tied to a specific property whose owner contracts with a PHA. Currently, there are almost 900 housing authorities nationwide42 with over 530,000 tenants in around 290,000 units that participate.43 The demographic profile of households assisted through PBVs is broadly similar to that of households in the HCV program.
The federal government does not provide separate funding for PBVs used outside the RAD program. Rather, local housing authorities can elect to allocate up to 20 percent of their Section 8 voucher authorization to these vouchers.44 PHAs can allocate another 10 percent of their Section 8 voucher authorization (so up to 30 percent) if they operate in an area where the voucher is difficult to use (e.g. where the vacancy rate is less than 4 percent).45 Because the program is unit-specific, housing authorities enter into long-term contracts—typically up to 20 years—with property owners, with the option to renew.46 PBVs are a source of funding for the preservation and construction of new affordable housing supply because they can be leveraged to raise additional sources of capital. Similar to HCVs, tenants in PBV units pay 30 percent of their income in rent and rely on the same payment standards and income limits as Section 8. Nationally, PBVs are more likely to be used in high-poverty neighborhoods.47 The tenant population is majority female, resides in urban areas, and does not have a college degree. The plurality of recipients are black, and the most represented age groups are those under 18 or over 62 years old.48
New York City:
As of 2022, 24,364 households in New York City used PBVs, 17,533 (72%) of whom received their voucher through NYCHA.49 Of NYCHA’s PBV units, 89 percent were in PACT properties in 2024;50 in the map below, we show the remaining PBV properties, which are heavily concentrated in the South Bronx and Northern Manhattan, as well as the Lower East Side and portions of Brooklyn (Figure 6). A reduction in funding for PBVs would impact those neighborhoods most dramatically, as tenants would struggle to make up the difference necessary to pay the full rent payment and remain stably housed. As a result, property owners would see declines in net operating income, putting maintenance and the financial viability of PBV properties at risk, potentially leading to foreclosures. Such cuts could also have spillover effects on the neighborhood, risking blight.
Figure 6: Project-Based Voucher Properties (2024)
Sources: U.S. Department of Housing and Urban Development (HUD) data on Project-Based Vouchers (2024), NYU Furman Center.
3. Section 8 Project-Based Rental Assistance
Project-Based Rental Assistance is part of the Section 8 program and similarly provides subsidies to low-income and extremely low-income households. Similar to PBVs, this program is connected to units within designated developments. Private owners contract with HUD or local PHAs (e.g. under the Section 8 Moderate Rehabilitation program). Nationally, the program assists nearly 2 million people in 1.2 million units at a cost of more than $16 billion.51
Families or individuals eligible for PBRA must be low-income, which HUD defines as up to 80 percent of AMI. At least 40 percent of the subsidized units within a housing development must be provided to extremely low income households, which is defined to include households up to 30 percent of AMI. Similar to other programs, tenants pay 30 percent of their income on rent and utilities, the rest of which is subsidized through federal funds.52
New York City:
In New York City, HPD provides PBRA through its Section 8 Moderate Rehabilitation program and its Shelter Plus Care program under the CoC, outlined below.53 HUD also directly administers PBRA subsidy to units, including units serving elderly and disabled tenants across New York City through programs like Section 202 Supportive Housing for the Elderly and Section 811 Supportive Housing for Persons with Disabilities. Across all these programs (and others, including the Section 236 preservation program), more than 59,000 units in New York City received subsidy at a cost of close to $1.3 billion in fiscal year 2023. The median household income for assisted households was $15,384.54
If federal funding for PBRA is cut without replacement from another source, tenants in units that lose subsidy will struggle to pay their rent. In New York City, the population served by PBRA includes elderly, disabled, and formerly homeless individuals. Such a scenario could also have serious downstream impacts on the financial health of PBRA properties.
II. Housing-Related Block Grants Support A Range of Programs, From Code Enforcement to New Construction to Programs to Combat Homelessness
HUD allocates federal block grants to localities, territories, and states using formulas based on various factors.55 Congress appropriated more than $9 billion across the block grant programs for the 2024 fiscal year: $3.3 billion for CDBG, $1.3 billion for HOME, more than $4 billion for homeless assistance grants, and $505 million for HOPWA.56
In the 2024 program year, New York City expected to receive nearly $298 million across four HUD formula block grant programs: more than $171 million for CDBG; close to $66 million for HOME; close to $15 million for ESG; and more than $45.6 million for HOPWA.57
1. Community Development Block Grants
The CDBG program is large, with $3.3 billion in formula grants allocated across the country in fiscal year 2024.58 Seventy percent of CDBG funding is allocated directly to eligible communities on a formula basis.59 Eligible communities must be principal cities of Metropolitan Statistical Areas (MSAs), other metropolitan cities with a population of 50,000 or higher, or qualified urban counties with a population of 200,000 or higher.60 The remaining 30 percent of CDBG funding is allocated to the states, which then distribute the funds to smaller communities.61 The amount of money each grantee receives annually is determined through a statutory dual formula that uses measures of community needs including poverty, overcrowding, the age of housing, and population growth in comparison to other metropolitan areas.62
CDBG funds must be used to meet one of three objectives: benefitting low- and moderate-income people, preventing or eliminating slums or blight, or meeting other urgent community development needs that pose an immediate, serious threat to health or welfare. A minimum of 70 percent of expenditures must be used for the benefit of low- and moderate-income people.63
New York City:
The city planned to spend almost $276 million in CDBG funds in 2024. Almost all of New York City’s planned CDBG funds were directed to housing-related programs, with 6.5 percent of funds targeted to other uses like education, food pantries, and services and hotlines for victims of crime and domestic violence. Of the remaining $256.5 million spent on housing-related programs, the main uses were code enforcement ($58.7 million); lead-based paint testing and abatement and general renovation of NYCHA properties ($52.1 million); HPD’s Emergency Repair Program (ERP) ($46.7 million); HPD’s Alternative Enforcement Program which corrects immediately hazardous violations in apartment buildings ($11.3 million); and emergency relocation services for households forced to move due to a vacate order or fires ($25.8 million). HPD also uses CDBG to fund its rehabilitation program for tax-foreclosed housing ($10.0 million), its demolition program ($9.9 million) and for administrative purposes to operate these programs ($8.9 million).64
Figure 7 below shows the community districts where HPD spent CDBG funds in 2024 on code enforcement and emergency repairs when an owner was failing to address a hazardous condition.65 The community districts with the highest levels of spending on emergency repairs in 2024 were Fordham/University Heights ($4.3 million), Bedford Stuyvesant ($3.7 million), and East New York-Starrett City ($2.9 million); these neighborhoods would likely be most impacted by cuts to the CDBG program’s emergency repair work. Without backfill from the state or local government, reductions in CDBG funding could lead to a decline in quality and safety of units in these and other neighborhoods, and potentially affect the maintenance and quality of surrounding buildings through spillovers.
Figure 7: Emergency Repair Work Charges (2024)
Sources: NYC Department of Housing Preservation and Development open market order charges data (2024), NYU Furman Center.
2. HOME Investment Partnerships Program
The HOME Investment Partnership program66 provides federal block grants to state and local governments to fund the creation of affordable housing and/or provide rental assistance for low-income households.67 HOME is most often used in senior housing.
In fiscal year 2025, Congress appropriated $1.25 billion to the program.68 60 percent of the funds are allocated to local governments, and the remaining 40 percent to the states. In fiscal year 2024, all 50 states (as well as the District of Columbia, Puerto Rico, and four insular areas) received HOME funds, with a median award of $8 million. Additionally, 632 localities and consortia received HOME grants, with a median award of $660,000. HOME funds can be used to support affordable housing for low-income households, including new construction or rehabilitation of owner-occupied or rental housing, and for assistance to home buyers and tenants. HOME-funded projects must meet the following affordability requirements for specified periods of time: residents of HOME-funded units must be households earning no more than 80 percent of AMI, and at least 90 percent of households living in HOME-funded units and/or receiving tenant-based rental assistance must earn no more than 60 percent of AMI.69
HOME funds are awarded by a formula consisting of six factors, including “the number of units in a jurisdiction that are substandard or unaffordable, the age of a jurisdiction’s housing, and the number of families living below the poverty line in the jurisdiction.”70
New York City:
HOME funds for New York City are allocated to HPD.71 In FY 2024, HPD planned for $66 million in HOME funds. HPD allocated more than $51 million (76%) for the development of multi-family affordable housing. HPD also planned to spend $8.2 million (12%) of the funds on homeownership assistance via the HomeFirst Down Payment Assistance Program, $1 million (1.5%) on tenant-based rental assistance, and $6.7 million (10%) on administrative costs.72 If funding for the HOME program was cut and not replaced, the city would see a reduction in its ability to fund the construction of new affordable housing, as well as affordable homeownership and rental assistance.
3. Emergency Solutions Grants
Emergency Solutions Grants (ESG) are designed to enable unhoused individuals and families to move toward independent living. The funding can be used for street outreach, emergency shelter renovation, homeless prevention, rapid re-housing, data collection, and administration.73
New York City:
New York City is a direct recipient of ESG funds, administered by the Department of Social Services (DSS). The city’s 2024 Annual Action Plan reports that the city expected to allocate $7.5 million of a total of $14.9 million to provide emergency shelter and essential services to adults without minor children; $905,000 for street outreach and drop-in services to facilitate placements in temporary and permanent housing; $3.1 million for homelessness prevention programs; and $3.3 million for the City’s Coordinated Assessment and Placement System, a web-based platform used by a network of advocates, non-profits, government agencies and others to assess, connect and place persons experiencing homelessness into permanent housing.74
4. Housing Opportunities for People with AIDS
The Housing Opportunities for People with AIDS program aims to provide housing assistance and supportive services to low-income persons living with HIV/AIDS and who have incomes at or below 80 percent of AMI. Municipalities are awarded 90 percent of HOPWA funding based on their population of people living with HIV/AIDS, and nonprofits receive 10 percent of those funds via a competitive grant process.75 HOPWA can be used for acquisition, rehabilitation, or construction of new housing units; facility operations; rental assistance; homeless prevention; and health care.76
New York City:
In New York City, the Department of Health and Mental Hygiene (DOHMH) administers the HOPWA program. According to New York City’s 2024 Annual Action Plan, DOHMH planned to spend a total of $34.3 million to identify, secure, and provide permanent housing or supportive housing to people living with HIV/AIDS in New York City. HOPWA also funds tenant-based rental assistance, permanent housing placements, and homelessness prevention for people living with HIV/AIDS. This funding would provide services to 2,382 individuals and housing for approximately 2,100 households.77
III. Competitive Grant Programs
Some federal funding for housing is distributed through competitive grant programs in which nonprofits, governments, and other providers propose funding for specific projects. The most notable of these is the CoC program administered by HUD, which directed $326 million to New York State in 2024, close to $174 million of which was planned to go to New York City.
1. Continuum of Care
The CoC program distributes funds to eligible entities to provide services to individuals and families experiencing homelessness in order to help them achieve long-term stability.78 The program distributed $3.6 billion in fiscal year 2024 for thousands of projects throughout the country.
CoC funding is allocated through an annual competitive process to non-profit organizations, states and local governments and may be used for programs that involve permanent housing, transitional housing, supportive services only, homelessness management information systems, and/or homelessness prevention.
New York State and New York City:
The New York City CoC is governed by a steering committee, which consists of 17 members and includes representatives from relevant coalitions, government agencies, individual non-profits, and people with lived experiences of homelessness.79 In fiscal year 2024, New York State received over $326 million in funds from the CoC program, of which New York City received $173.7 million.80 The grant supports shelters, rapid rehousing programs, rental assistance, scattered site housing, single-room occupancy (SRO) housing, and supportive housing. In the fiscal year 2024 competition, the New York City CoC included 187 different projects from almost 75 different providers in their application to HUD.81
IV. Federal Direct Spending is Used for a Variety of Housing Programs in New York City
Federal funds pay for many services that the city would be hard-pressed to fund from its own budget. In describing the programs, we hope to drive home the potential effects that federal cuts could have on basic housing services that affect homeowners, landlords and renters living in unsubsidized housing and on the operation, construction, and rehabilitation of subsidized affordable housing. We also hope the above summaries make clear the diverse uses of federal funds. Federal money is used to fund rental assistance for very low-income renters, and it also funds the city’s code enforcement and emergency repair programs and NYCHA’s operations, which are critical to provide a baseline level of service for distressed properties. Federal money is used to construct new housing and to fund homelessness programs. Cuts (or level funding that does not keep up with inflation) to these programs would have the greatest effect on particular neighborhoods, and we have also highlighted these neighborhoods at most risk.
V. Tax Expenditures Support Investment in the Construction and Preservation of Multifamily Housing
Tax expenditures refer to revenue losses attributable to provisions of the tax code that allow a special exclusion, exemption or deduction from income that would otherwise be taxed. Such foregone tax revenues are an alternative to direct spending because they encourage investment in affordable housing or make construction or operation of the housing less costly. We focus here on two of the tax expenditures focused on multifamily housing development. First, we discuss the Low-Income Housing Tax Credit program, which is critical to the city and which reduces corporate income tax liability to incentivize investment in the production of affordable housing. LIHTC, the federal government’s largest program to subsidize the development and preservation of affordable housing, cost $13.6 billion in foregone federal tax revenue in 2024.82 In total, we estimate that the 4% and 9% LIHTC programs generate approximately $833 million in equity investment annually in New York City’s affordable housing developments—$667 million from 4% credits and $166 million from 9% credits.
Second, we explore the Opportunity Zone program, which the current HUD Secretary has lauded, saying that, as a result of the program, “one million people have gotten lifted off the poverty rolls. Home values […] have risen, while rents did not go up [… and] families are able to build brand-new foundations for their lives.”83 OZ provides tax incentives for investments made in distressed census tracts. The U.S. Department of the Treasury estimates that OZs will cost $3.0 billion in foregone revenue in 2024 and $3.1 billion in 2025.84
1. Low-Income Housing Tax Credits
LIHTC is the federal government’s largest source of support to subsidize the development and preservation of affordable housing. 85 LIHTC provides a dollar-for-dollar reduction in federal corporate income tax liability for taxpayers that invest in rental housing that serves very low-income and low-income households. 86 As of January 2024, it is estimated that LIHTC has contributed to the development and preservation of over 3.5 million units nationwide since its establishment by the Tax Reform Act of 1986. 87
To be eligible for the credit, a development must reserve a minimum share of units for lower-income households, using one of three federally defined set-aside options: either 20 percent of units for households earning no more than 50 percent of area median income (AMI); 40 percent of units for households earning no more than 60 percent of AMI; or 40 percent of units at varying income levels that average no more than 60 percent of AMI, with no unit exceeding 80 percent.88 In New York City, housing agencies layer on stricter affordability standards as a condition of receiving local financing or tax-exempt bonds. For example, many bond-financed projects must reserve at least 25 percent of units for households earning no more than 60 percent of AMI—exceeding federal minimums even as projects remain structured to comply with one of the federally required set-aside tests.89
Across the nation, state Housing Finance Agencies (HFAs) and sub-allocating agencies administer two types of LIHTCs: the 9 percent credit (“9% credits”), awarded competitively and designed to cover up to 70 percent of a project’s low-income unit development costs; and the 4 percent credit (“4% credits”), available as-of-right for projects in which tax-exempt bonds cover at least 50 percent of aggregate development costs (“50% Test”).90 Allocating agencies use Qualified Allocation Plans (QAPs) to set the criteria for awarding 9% credits.91 Projects located in federally designated Qualified Census Tracts (QCTs) or Difficult Development Areas (DDAs) are eligible for a “basis boost,” which increases the amount of tax credit equity a project can generate.92
New York City:
To fund the construction of New York City’s affordable housing developments, 9% credits may be allocated by either HCR, a state agency, or HPD, a city agency.93 For tax-exempt private activity bonds which generate 4% credits, the bond issuer may be HCR or the New York City Housing Development Corporation (HDC), a city-focused public benefit corporation.94 While 4% credits are not subject to competitive scoring, their allocation is still discretionary and subject to significant oversight, including compliance with federal program rules, the 50% test, caps on the allowed bond volume that can be used, and local policy requirements.95 Each year, HDC issues tax-exempt private activity bonds96 to finance the construction of income-restricted housing. In recent years, HDC has allocated an average of $800 million in tax-exempt private activity bond proceeds annually to finance affordable housing developments in New York City.
If these bonds finance at least 50 percent of the project’s aggregate basis (the “50% test”), that also makes the project eligible for 4% credits under federal law. This pairing—tax-exempt bond proceeds, which are lent into projects as below-market debt, alongside as-of-right tax credits, which generate additional equity when sold to investors—makes 4% credits an especially powerful financing tool of affordable housing.
Tax-exempt bond financing sustains New York City’s affordable housing pipeline. Portions of bond proceeds can also be “recycled” to finance additional projects. This combination of tax-exempt lending capital and as-of-right LIHTC equity plays a critical—though often overlooked—role in financing affordable housing in New York City.
In addition to as-of-right 4 percent credits, New York City receives a limited annual allocation of competitive 9 percent LIHTCs through New York State. These credits provide a deeper level of financial assistance than 4 percent credits and are typically reserved for smaller-scale developments that often include supportive services.
On average, the city has awarded roughly $16.6 million in 9 percent credits annually over the past four years.97 Because these credits are claimed over a 10-year period and are also traded at par, they generate a total of about $166 million in LIHTC tax credits each year.98
In total, we estimate that the 4% and 9% LIHTC programs generate $833 million in equity investment annually in New York City’s affordable housing developments—$667 million from 4% credits and $166 million from 9% credits. These equity investments support affordable housing development and preservation in New York City, delivered not through direct appropriations but via the federal tax code. In addition, the 4% program relies on approximately $800 million in tax-exempt bond proceeds annually, which are lent into projects as below-market debt and can be partially recycled to finance additional development. Together, these sources of capital—bond financing and tax credit equity—play a powerful role in financing the city’s affordable housing pipeline.
HUD research shows that, nationwide, almost half of tenants living in a LIHTC unit have incomes below the federal poverty level.99 Some research suggests that LIHTC developments lead to significant rent savings for residents,100 revitalize low-income neighborhoods,101 provide access to better schools for residents than recipients of other forms of housing assistance,102 and significantly reduce crime.103
Figure 8 below maps LIHTC 9-percent and 4-percent properties,104 QCTs, and DDAs. The map shows the extent to which LIHTC is concentrated in certain neighborhoods and also reveals how the location of LIHTC developments relates to QCTs and DDAs (boundaries which change annually) in which the program encourages investment. LIHTC properties follow a similar pattern as other programs mapped in this section, like NYCHA, PACT, and project-based Section 8, concentrating in the south Bronx, northern Manhattan, the Lower East Side, and parts of Brooklyn.
Figure 8: Low-Income Housing Tax Credit (LIHTC) Properties
Sources: U.S. Department of Housing and Urban Development (HUD) data on LIHTC (2022), QCTs, and DDAs (2025), New York State Division of Housing and Community Renewal (HCR) data on LIHTC (2023), NYU Furman Center.
2. Opportunity Zones
The OZ program provides federal tax advantages to taxpayers making certain investments in distressed census tracts, known as Qualified Opportunity Zones (QOZs). Created by the 2017 Tax Cuts and Jobs Act and implemented in 2018, the program’s final regulations were issued in December 2019.105
a. How Tracts Were Designated as Qualified Opportunity Zones
Tracts were eligible for designation if the tract had a poverty rate of at least 20 percent, or a median income below 80 percent of the greater of the statewide or metropolitan area median income.106 States were also permitted to designate up to 5 percent of their QOZs from tracts that did not meet those criteria but were adjacent to tracts that did, as long as they had a median family income that did not exceed 125 percent of the neighboring eligible tract.107 Each state’s governor then selected up to 25 percent of eligible tracts in their state to be designated QOZs, and the Secretary of the Treasury certified and designated tracts as a QOZ. Designations last for 10 years.
Nationwide, 7,826 census tracts were designated as QOZs, with another 33,392 eligible but not designated (out of 73,056 tracts total nationwide).108 At the end of 2020, investments in OZs were somewhat concentrated: 52 percent of designated QOZs had not received any investment through the program, 26 percent had received a single investment, while 18 percent of tracts received investments from between two and five Qualified Opportunity Funds (QOFs), and four percent of tracts had received investment from more than five funds.109 A similar analysis using tax filings through 2022 found that investment was also “concentrated in census tracts with growing populations and home values, in urban areas, within relatively prosperous counties, and in areas of the country experiencing more growth.”110
Designation in New York:
Out of 878 eligible tracts in New York City, 306 tracts in New York City were designated OZs by Governor Andrew Cuomo in 2018.111 41 percent are in Brooklyn, 25 percent in the Bronx, 20 percent in Queens, 12 percent in Manhattan, and 3 percent in Staten Island (see Figure 9).112 The median household income of New York City OZ residents is $56,121, 68 percent of citywide median income.113
b. How the Program and the Tax Benefit Works
Investors can receive tax benefits under the OZ program by reinvesting capital gains into QOFs within 180 days of realizing those gains.114 These funds must then deploy at least 90 percent of their assets into “qualified opportunity zone property” – businesses or real estate located in designated OZs that meet certain criteria.115
For real estate investments to qualify, the QOF had to acquire the property after December 31, 2017 then either substantially improve the property or change its use.116 To show substantial improvement, the QOF must invest in improvements over a 30-month period totalling at least 100 percent of the value of the buildings.117 These requirements typically steer QOF investments toward large-scale rehabilitation or new construction projects that are already well-capitalized and shovel-ready.
The OZ program reduces capital gains taxes in three ways:
- Deferral of Gain: First, taxes that would have been due on capital gains realized (which need not be in an opportunity zone) are deferred until December 31, 2026, if those gains were invested in the QOF (the amount of the old gain invested is the “qualified opportunity investment”).118
- Step-Up of Opportunity Zones Investments’ Basis: The investor can step up their basis in the qualified opportunity investment (upon a sale or on December 31, 2026, whichever is earlier), depending on how long they held that investment. Stepping up their basis in the investment allows the investor to decrease the capital gains for which taxes are owed. If they hold the investment for 5 years, the basis is increased by 10 percent, and if held for 7 years, they can step-up the basis by 15 percent.119
- Exclusion of Opportunity Zone Investments’ Gain: Third, if the qualified investment is held for at least ten years, the basis for the qualified investment steps up to the fair market value on the date the qualified opportunity investment is sold–in effect any capital gains accrued during the investment period are then not taxed.
New York State decoupled its state capital gains taxes from federal calculations for the OZ program for the first two benefits (deferral and step up in basis), but has not yet decoupled from the third.120
QOFs self-certify and self-report through an IRS form and are not required to report much detail on the QOFs or their individual property investments.121 As such, there is little data available on OZ investments. The most recent and comprehensive published research on QOFs and OZ investments (analyzing IRS filings through 2022) found $89 billion held in QOFs nationwide, with 75 percent of total investment in real estate and 93 percent of total investment in urban areas.122
c. Existing Research on Opportunity Zones
Research on the impact of OZs is mixed. One early study of OZs nationwide in 2018-2019 found that the policy had little-to-no impact on housing prices in OZ tracts, with weak evidence that it might have increased residential permitting.123 Another study measuring the interaction between LIHTC projects and OZs nationwide through 2020 found no statistically significant effect of LIHTC investment in terms of completed units, projects, or dollars.124 However, a 2022 study found evidence that OZs saw a 2.9 percentage point increase in residential and commercial development, with greater impacts in neighborhoods with more available land, lower housing values, and more elastic housing supply.125 A different study of real estate transactions nationwide through 2019 found a 4-6 percent increase in residential property prices in OZs and some evidence of spillover effects in neighboring tracts but did not find significant changes in the volume of sales.126
While the OZ program was designed to steer capital to distressed communities, research has shown that OZ investors have often focused their investments in OZs with expensive real estate markets,127 higher incomes, lower levels of unemployment, and a larger share of college graduates.128 The program’s eligibility criteria make this possible, particularly in New York City, where it is not uncommon for a census tract to meet the 20 percent poverty threshold while also being situated in a high-income market. For example, the Citizens Budget Commission of New York found that six percent of the designated tracts were in “high-poverty, high-income” tracts, meaning they met the poverty threshold but had median family incomes in excess of $100,000.129
OZ investments have frequently flowed into tracts with higher pre-existing levels of investment and population growth–areas that were likely to attract development even without the tax incentive.130 Indeed, research has suggested that many of the tax benefits of the OZ program flowed to investments that would have occurred regardless of the program,131 raising questions about the program’s efficacy in channeling investments into disadvantaged communities. 132 Research has also suggested that the direct incidence of the tax subsidy primarily benefits investor households in the 99th percentile of national income.133
Despite limited data and mixed evidence of impact, the Opportunity Zone program has quickly become the largest federal economic development tax expenditure by cost, estimated to be $3.5 billion each year through 2022.134 Despite the size of the program, the absence of centralized reporting or data collection creates little opportunity for oversight or accountability. The regulations ask for self-certification of fund and investment qualification, and while there has been some minor auditing of some funds, there is essentially no oversight of the privileged investments.
Another major critique of the OZ program is that it relies on 2011–2015 poverty and income data to determine tract eligibility, and those designations have not been updated. This means that the program risks being increasingly misaligned with current local conditions (especially in a dynamic market like New York City). As a result, the OZ program may be delivering billions of dollars in federal tax benefits with limited returns for the communities it was intended to support.
Figure 9: Designated and Eligible Opportunity Zones
Sources: U.S. Department of the Treasury Opportunity Zone data, NYC Department of Housing Preservation and Development Eligible Census Tract data, NYU Furman Center.
VI. Other Programs
This report focuses on the major HUD-funded programs and federal tax expenditures that directly support affordable rental housing and homelessness efforts in New York City. It does not attempt to provide a comprehensive accounting of all federal housing programs. Several other federal initiatives—while not examined in detail here—play a vital role in the broader housing landscape and are essential to the financing and operation of affordable housing across the country. These include Fannie Mae and Freddie Mac’s credit enhancement for tax-exempt bonds, their multifamily lending platforms, and other federal loan programs such as FHA-HFA risk-sharing and direct lending initiatives. In addition, significant federal subsidies for homeownership, including the mortgage interest deduction and the State and Local Tax Deduction (SALT), fall outside the scope of this review. Their exclusion should not be read as a judgment about their importance but rather as a reflection of this report’s focus on the programs most directly tied to the rental housing and homelessness systems in New York City.
Read the rest of the report:
Footnotes
- [1] For more information on the budget analysis, please see the technical appendix.
- [2] Interview with New York City Housing Development Corporation staff; New York City Housing Development Corporation. (2019). Memorandum: Multi-Family Housing Revenue Bonds, 2019 Series B & C; Approval of a Mortgage Loan and Approval of Liquidity Facilities. https://www.nychdc.com/sites/default/files/2021-01/Memo-MFHRB%202019%20Series%20B%20and%20C%20Approval%20of%20a%20Mortgage%20Loan%20and%20Approval%20of%20Liquidity%20Facilities.pdf; New York City Housing Development Corporation. (2023). Notice of Public Hearing: Proposed Financing. https://www.nychdc.com/sites/default/files/2023-11/TEFRA%20NOTICE%20-%20November%2017%2C%202023%20-%20VF.pdf; Monadnock Development. (2024). Nehemiah Spring Creek – Site 26A. https://monadnockdevelopment.com/project/nehemiah-spring-creek-site-26a/
- [3] Hayes, C., & Gerken, M. (2019). The future of public housing: Rental Assistance Demonstration fact sheet. Urban Institute. https://www.urban.org/sites/default/files/publication/101436/the_future_of_public_housing_rental_assistance_demonstration_1.pdf
- [4] The PACT program cost is estimated based on the per-unit cost of a NYCHA PACT voucher multiplied by the number of units that had converted to PACT units at the same moment in time in a given year. These estimates are subtracted from the Section 8 funding in each year. For more information, please see the technical appendix.
- [5] Note that this analysis may not include federal funding that flows through New York State’s Department of Housing and Community Renewal (HCR) to New York City but is challenging to isolate (such as funding for HCR’s Vital Brooklyn Initiative).
- [6] New York City Housing Authority. (2025). Preliminary Mayor’s management report: Fiscal year 2025. https://www.nyc.gov/assets/operations/downloads/pdf/pmmr2025/nycha.pdf
- [7] NYU Furman Center for Real Estate and Urban Policy. Public housing (PH). https://www.furmancenter.org/coredata/directory/entry/public-housing
- [8] New York City Housing Authority. (2025). Preliminary Mayor’s management report: Fiscal year 2025. https://www.nyc.gov/assets/operations/downloads/pdf/pmmr2025/nycha.pdf
- [9] National Low Income Housing Coalition. (2024, March 04). Despite tight topline funding, advocates and key congressional champions secure increased funding for HUD programs in FY24 spending bill. https://nlihc.org/resource/despite-tight-topline-funding-advocates-and-key-congressional-champions-secure-increased
- [10] Public Housing Eligibility, 24 C.F.R. § 960.201(a)(1)-(2) (2025); Definitions, 24 C.F.R. § 5.603(b) (2025) (defining “low income family”).
- [11] Tenant Selection Policies, 24 CFR § 960.202(b)(1) (2025) (targeting requirement); 24 CFR § 5.603(b) (defining “extremely low-income family”). See also: New York City Housing Authority. (2024). Admissions and continued occupancy policy. https://www.nyc.gov/assets/nycha/downloads/pdf/admissions-and-continued-occupancy-policy-acop-final.pdf
- [12] New York City Housing Authority. (2024). NYCHA fact sheet. https://www.nyc.gov/assets/nycha/downloads/pdf/NYCHA_Fact_Sheet.pdf
- [13] New York City Housing Authority. (2024). NYCHA fact sheet. https://www.nyc.gov/assets/nycha/downloads/pdf/NYCHA_Fact_Sheet.pdf. As of January 2025, the NYCHA Resident Data Book reported that public housing households spent an average of 27.2 years in public housing. See: New York City Housing Authority (2025). Resident data book summary. https://www.nyc.gov/assets/nycha/downloads/pdf/Resident-Data-Book-Summary.pdf
- [14] United States Housing Act of 1937 § 9(g)(3), 42 U.S.C. § 1437g(g)(3) (2025) (limiting new construction).
- [15] Popkin, S.J. (2024). Lessons from 40 years of public housing policy. Urban Institute. https://www.urban.org/sites/default/files/2024-06/Lessons_from_40_Years_Public_Housing.pdf
- [16] Office of Recapitalization. (2023). Reflections on 10 years of public housing conversions. U.S. Department of Housing and Urban Development. https://www.hud.gov/sites/dfiles/Housing/documents/RAD_10-Years_Letter.pdf. Also see: Abt Associates Inc. (2010). Capital needs in the public housing program: Contract # C-DEN-02277-TO001, revised final report. Prepared for U.S. Department of Housing and Urban Development. https://www.hud.gov/sites/documents/ph_capital_needs.pdf
- [17] New York City Housing Authority. (2024). New York City Housing Authority adopted budget: Financial Plan FY2024-FY2028. https://www.nyc.gov/assets/nycha/downloads/pdf/2024-2028-NYCHA-Budget-Book.pdf
- [18] HUD Capital Fund Formula, 24 CFR § 905.400 (2025).
- [19] U.S. Department of Housing and Urban Development. Rental Assistance Demonstration (RAD). https://www.hud.gov/RAD
- [20] New York City Public Housing Preservation Trust. (2024). Strategic plan: September 2024 – August 2025. https://static1.squarespace.com/static/656e4be2f13c27552bd037ce/t/671a952672a6a521317150c6/1729795366584/Strategic+Plan+2024+%28Final%29.pdf
- [21] Popkin, S.J. (2024). Lessons from 40 years of public housing policy. Urban Institute. https://www.urban.org/sites/default2024-06/Lessons_from_40_Years_Public_Housing.pdf; New York City Housing Authority. Permanent Affordability Commitment Together (PACT). https://www.nyc.gov/site/nycha/about/pact.page
- [22] New York City Housing Authority. Permanent Affordability Commitment Together (PACT). https://www.nyc.gov/site/nycha/about/pact.page
- [23] New York City Housing Authority. (2024). NYCHA fact sheet. https://www.nyc.gov/assets/nycha/downloads/pdf/NYCHA_Fact_Sheet.pdf
- [24] New York City Housing Authority (2024). Final PHA Agency Plan. https://www.nyc.gov/assets/nycha/downloads/pdf/NYCHA_Final_AnnualPlanFY25_10-15-24.pdf
- [25] New York City Housing Authority. (2024). NYCHA fact sheet. https://www.nyc.gov/assets/nycha/downloads/pdf/NYCHA_Fact_Sheet.pdf
- [26] New York City Housing Authority. Public Housing Preservation Trust. https://www.nyc.gov/site/nycha/about/public-housing-preservation-trust.page
- [27] New York City Public Housing Preservation Trust. (2024). Strategic plan: September 2024 – August 2025. https://static1.squarespace.com/static/656e4be2f13c27552bd037ce/t/671a952672a6a521317150c6/1729795366584/Strategic+Plan+2024+%28Final%29.pdf. In April 2025, residents of a fourth development, Hylan Houses, voted for rehabilitation through the Trust model. See: New York City Public Housing Preservation Trust. Preservation program. https://www.preservationtrust.org/trustmod
- [28] New York City Housing Authority. FHA Homes program. https://www.nyc.gov/site/nycha/residents/homeownership-program.page
- [29] Gartland, E., Mazzara, A., Fischer, W. & Kasprak N. (2025). Where households using federal rental assistance live. Center on Budget and Policy Priorities. https://www.cbpp.org/research/housing/where-households-using-federal-rental-assistance-live
- [30] NYU Furman Center for Real Estate and Urban Policy. Section 8 Housing Choice Voucher program. https://www.furmancenter.org/directory/section-8-housing-choice-voucher-program/
- [31] Center on Budget and Policy Priorities. (2024). Policy basics: The Housing Choice Voucher program. https://www.cbpp.org/research/housing/the-housing-choice-voucher-program
- [32] National Low Income Housing Coalition. (2025). FY25 budget chart for selected federal housing programs. https://nlihc.org/sites/default/files/Enacted_HUD_Budget-Chart_FY25.pdf
- [33] Center on Budget and Policy Priorities. (2024). Policy basics: The Housing Choice Voucher program. https://www.cbpp.org/research/housing/the-housing-choice-voucher-program
- [34] Eligibility and Targeting, 24 C.F.R. § 982.201(b)(1)(i) (2025); 24 C.F.R. § 5.603(b)) (defining “very low income family”). New York City Housing Authority. (2025). Housing Choice Voucher program administrative plan. https://www.nyc.gov/assets/nycha/downloads/pdf/hcpvadministrative.pdf
- [35] 24 C.F.R. § 982.201(b)(2). There are some exceptions that allow families with incomes up to 80 percent AMI to be admitted to the program if other requirements are met. See 24 C.F.R. §982.201(b).
- [36] However, households can pay a higher percentage of their income towards rent if their rent is greater than the local payment standard. Small Area Fair Market Rents (SAFMRs) adjust these benchmarks to the ZIP Code level to better reflect local rental markets, but they are not required or permitted for HCVs in all jurisdictions. See: U.S. Department of Housing and Urban Development. Small Area Fair Market Rents. https://www.hud.gov/helping-americans/housing-choice-vouchers-safmr
- [37] NYU Furman Center for Real Estate and Urban Policy. (2024) State of the city 2023: The use of Housing Choice Vouchers in New York City. https://www.furmancenter.org/soc-report/state-of-new-york-citys-housing-and-neighborhoods-in-2023/the-use-of-housing-choice-vouchers-in-new-york-city/
- [38] Small Area Fair Market Rents (SAFMRs) adjust these benchmarks to the ZIP Code level to better reflect local rental markets, but they are not required or permitted for HCVs in all jurisdictions. See: U.S. Department of Housing and Urban Development. Small Area Fair Market Rents. https://www.hud.gov/helping-americans/housing-choice-vouchers-safmr
- [39] NYU Furman Center for Real Estate and Urban Policy. Section 8 Housing Choice Voucher program(HCV). . https://www.furmancenter.org/directory/section-8-housing-choice-voucher-program/
- [40] NYU Furman Center for Real Estate and Urban Policy. (2024). State of the city 2023: The use of Housing Choice Vouchers in New York City. https://www.furmancenter.org/soc-report/state-of-new-york-citys-housing-and-neighborhoods-in-2023/the-use-of-housing-choice-vouchers-in-new-york-city/
- [41] NYU Furman Center for Real Estate and Urban Policy. (2024). State of the city 2023: The use of Housing Choice Vouchers in New York City. https://www.furmancenter.org/soc-report/state-of-new-york-citys-housing-and-neighborhoods-in-2023/the-use-of-housing-choice-vouchers-in-new-york-city/
- [42] U.S. Department of Housing and Urban Development. (2024). Housing Choice Voucher data dashboard. https://www.hud.gov/program_offices/public_indian_housing/programs/hcv/dashboard
- [43] Center on Budget and Policy Priorities. (2024). Policy basics: Project-Based Vouchers. https://www.cbpp.org/research/housing/project-based-vouchers
- [44] U.S. Department of Housing and Urban Development. Project-Based Vouchers. https://www.hud.gov/helping-americans/housing-choice-vouchers-project
- [45] Project-Based Voucher (PBV) Program, 24 C.F.R. § 983.6 (2025) (maximum number of PBV units), § 983.3 (2025) (PBV definitions). RAD PBVs do not count against these caps. HUD also published new rules in 2024 providing a set of allowances so PHAs could exclude certain units from both the project-specific and program-specific caps. See: U.S. Department of Housing and Urban Development, Office of Public and Indian Housing. (2024). HOTMA final rule improvements to the PBV and HCV programs. https://www.hud.gov/sites/dfiles/PIH/documents/HOTMA%20Final%20Rule%20Improvements%20to%20the%20PBV%20and%20HCV%20Programs%20(05-15-24).pdf
- [46] PBVs can only be attached to a maximum of 40 percent of the units in a given property. 24 C.F.R. § 983.54(b) (income-mixing requirement).
- [47] Teles, D. & Oneto, A. D. (2024). Project basing housing choice: What we know and need to know about Project-Based Vouchers. Cityscape, 26(2). https://www.huduser.gov/portal/periodicals/cityscape/vol26num2/ch12.pdf
- [48] Center on Budget and Policy Priorities. (2024). Policy basics: Project-Based Vouchers. https://www.cbpp.org/research/housing/project-based-vouchers
- [49] NYU Furman Center for Real Estate and Urban Policy. (2024). State of the city 2023: The use of Housing Choice Vouchers in New York City. https://www.furmancenter.org/soc-report/state-of-new-york-citys-housing-and-neighborhoods-in-2023/the-use-of-housing-choice-vouchers-in-new-york-city/
- [50] New York City Housing Authority. (2024). NYCHA fact sheet. https://www.nyc.gov/assets/nycha/downloads/pdf/NYCHA_Fact_Sheet.pdf
- [51] Center on Budget and Policy Priorities. (2024). Policy basics: Section 8 Project-Based Rental Assistance. https://www.cbpp.org/research/housing/section-8-project-based-rental-assistance2024 Project-Based Rental Assistance budget overview.
- [52] Center on Budget and Policy Priorities. (2024). Policy basics: Section 8 Project-Based Rental Assistance. https://www.cbpp.org/research/housing/section-8-project-based-rental-assistance
- [53] NYC Department of Housing Preservation and Development. Other rental subsidy programs. https://www.nyc.gov/site/hpd/services-and-information/other-rental-subsidy-programs.page
- [54] U.S. Department of Housing and Urban Development. (2025). Community Assessment Reporting Tool. https://egis.hud.gov/cart/#
- [55] Each year, jurisdictions that receive federal block grants are required to submit an Annual Action Plan outlining how funds will be used and to report progress through a performance review. Eligible recipients include metropolitan cities, urban counties, territories, and states, the first three of which can subgrant funds to nonprofits. For some programs, states must subgrant all funding to local government and/or nonprofits. In addition, for some block grant programs, metropolitan cities, urban counties, and states must match grant funds. See: U.S. Department of Housing and Urban Development. Community Development Block Grant program. https://www.hud.gov/hud-partners/community-cdbgHOME overview. https://www.hudexchange.info/programs/home/home-overview/HOPWA eligibility requirements. https://www.hudexchange.info/programs/hopwa/hopwa-eligibility-requirements/ESG requirements. https://www.hudexchange.info/programs/esg/esg-requirements/Emergency Solutions Grants (ESG) program. https://files.hudexchange.info/resources/documents/EmergencySolutionsGrantsProgramFactSheet.pdf
- [56] National Low Income Housing Coalition. (2025, March). FY25 budget chart for selected federal housing programs. https://nlihc.org/sites/default/files/Enacted_HUD_Budget-Chart_FY25.pdf
- [57] New York City Mayor’s Office of Operations. (2024). 2024 annual action plan: Proposed consolidated plan. https://www.nyc.gov/assets/consolidatedplan/downloads/pdf/2024-Annual-Action-Plan-FINAL-w.-cover-7.24.24.pdf
- [58] National Low Income Housing Coalition. (2024). FY24 budget chart for selected federal housing programs. https://nlihc.org/sites/default/files/Final_HUD-USDA_Budget-Chart_FY24.pdf
- [59] U.S. Department of Housing and Urban Development, Office of Community Planning and Development. (2025). Community Development Fund budget overview. https://www.hud.gov/sites/dfiles/CFO/documents/2025_CJ_Program_-_CDF.pdf
- [60] HUD Exchange. CDBG entitlement program eligibility requirements. https://www.hudexchange.info/programs/cdbg-entitlement/cdbg-entitlement-program-eligibility-requirements/
- [61] U.S. Department of Housing and Urban Development, Office of Community Planning and Development. (2025). Community Development Fund budget overview. https://www.hud.gov/sites/dfiles/CFO/documents/2025_CJ_Program_-_CDF.pdf
- [62] HUD Exchange. CDBG entitlement program eligibility requirements. https://hudexchange.info/programs/cdbg-entitlement/cdbg-entitlement-program-eligibility-requirements
- [63] HUD Exchange. CDBG entitlement program eligibility requirements. https://www.hudexchange.info/programs/cdbg-entitlement/cdbg-entitlement-program-eligibility-requirements
- [64] New York City Mayor’s Office of Operations. (2024). 2024 annual action plan: Proposed consolidated plan. https://www.nyc.gov/assets/consolidatedplan/downloads/pdf/2024-Annual-Action-Plan-FINAL-w.-cover-7.24.24.pdf
- [65] The map shows the total number of Open Market Order Charges created in 2024. Those work orders are created through HPD’s Emergency Repair Program, Alternative Enforcement program, and Demolition program, all funded via CDBG funds.
- [66] HOME was created through the Cranston-Gonzalez National Affordable Housing of 1990 and is administered by HUD. See: NYU Furman Center for Real Estate and Urban Policy. HOME Investment Partnership (HOME). https://www.furmancenter.org/directory/home-investment-partnership-program/
- [67] HUD Exchange. (2025). HOME overview. https://www.hudexchange.info/programs/home/home-overview/
- [68] Watson, H. G. (2024). An overview of the HOME Investment Partnerships program. Library of Congress, Congressional Research Service. https://www.congress.gov/crs-product/R40118
- [69] Watson, H. G. (2024). An overview of the HOME Investment Partnerships program. Library of Congress, Congressional Research Service. https://www.congress.gov/crs-product/R40118
- [70] Watson, H. G. (2024). An overview of the HOME Investment Partnerships program. Library of Congress, Congressional Research Service. https://www.congress.gov/crs-product/R40118
- [71] NYU Furman Center for Real Estate and Urban Policy. HOME Investment Partnership (HOME). https://www.furmancenter.org/directory/home-investment-partnership-program/
- [72] New York City Mayor’s Office of Operations. (2024). 2024 annual action plan: Proposed consolidated plan. https://www.nyc.gov/assets/consolidatedplan/downloads/pdf/2024-Annual-Action-Plan-FINAL-w.-cover-7.
- [73] NYU Furman Center for Real Estate and Urban Policy. Emergency Solutions Grants (ESG). https://www.furmancenter.org/directory/emergency-shelter-grants/
- [74] New York City Mayor’s Office of Operations. (2024). 2024 annual action plan: Proposed consolidated plan. https://www.nyc.gov/assets/consolidatedplan/downloads/pdf/2024-Annual-Action-Plan-FINAL-w.-cover-7.24.24.pdf
- [75] HUD Exchange. HOPWA eligibility requirements. https://www.hudexchange.info/programs/hopwa/hopwa-eligibility-requirements/
- [76] NYU Furman Center for Real Estate and Urban Policy. Housing Opportunities for People with AIDS (HOPWA). https://www.furmancenter.org/directory/housing-opportunities-for-people-with-aids/
- [77] New York City Mayor’s Office of Operations. (2024). 2024 annual action plan: Proposed consolidated plan. https://www.nyc.gov/assets/consolidatedplan/downloads/pdf/2024-Annual-Action-Plan-FINAL-w.-cover-7.24.24.pdf
- [78] Mitchell, M. (2021). McKinney-Vento homeless assistance programs. National Alliance to End Homelessness. https://nlihc.org/sites/default/files/AG-2021/04-17_Homeless-Assistance-McKinney-Vento.pdf
- [79] New York City Continuum of Care. Steering Committee. https://www.nyc.gov/site/nycccoc/committees/steering-committee.page
- [80] U.S. Department of Housing and Urban Development. Fiscal year 2024 Continuum of Care competition: Homeless assistance award report. https://www.hud.gov/sites/dfiles/CPD/documents/CoC/CoC-2024-NY_Press.pdf
- [81] New York City Continuum of Care. (2024). Re: FY2024 NOFO application – NYC Continuum of Care (NY600). https://www.nyc.gov/assets/nycccoc/downloads/pdf/Notification%20of%20Projects%20Accepted%2010.15.204%20Final.pdf
- [82] NYU Furman Center for Real Estate and Urban Policy. (2017). The effects of the Low-Income Housing Tax Credit (LIHTC). https://www.furmancenter.org/publication/the-effects-of-the-low-income-housing-tax-credit-lihtc-2/; U.S. Department of the Treasury, Office of Tax Analysis. (2024, November 27). Tax expenditure budget for fiscal year 2026. https://home.treasury.gov/systemfiles/131/Tax-Expenditures-FY2026.pdf
- [83] Colton, E. (2025, March 30). HUD chief showcases how private-public partnerships uplift economically neglected areas in Philly tour. Fox News. https://www.foxnews.com/politics/hud-chief-showcases-how-private-public-partnerships-uplift-economically-distressed-areas-philly-tour?msockid=0987ba15177d64062fabaf2416a965cd
- [84] U.S. Department of the Treasury, Office of Tax Analysis. (2024, November 27). Tax expenditure budget for fiscal year 2026. https://home.treasury.gov/system/files/131/Tax-Expenditures-FY2026.pdf
- [85] Keightley, M. P. (2023). An introduction to the Low-Income Housing Tax Credit. Library of Congress, Congressional Research Service. https://www.congress.gov/crs-product/RS22389
- [86] NYU Furman Center for Real Estate and Urban Policy. Low-Income Housing Tax Credit (LIHTC). https://www.furmancenter.org/coredata/directory/entry/low-income-housing-tax-credit
- [87] Tax Policy Center. (2024). What is the Low-Income Housing Tax Credit and how does it work? https://taxpolicycenter.org/briefing-book/what-low-income-housing-tax-credit-and-how-does-it-work
- [88] See Low-Income Housing Credit, I.R.C. § 42(g)(1). The income-averaging option was added by the Consolidated Appropriations Act of 2018, Pub. L. No. 115–141, div. T, § 103 (2018) (average income test for low-income housing credit).
- [89] For example, New York City Housing Development Corporation (HDC) and Department of Housing Preservation and Development (HPD) typically require bond-financed 4% LIHTC projects to meet a “25-60” threshold as a local policy standard. See Novogradac. LIHTC Glossary: 25-60 Test. https://www.novoco.com/resource-centers/affordable-housing-tax-credits/lihtc-lexicon
- [90] NYU Furman Center for Real Estate and Urban Policy. (2025). Low-Income Housing Tax Credit (LIHTC). https://www.furmancenter.org/directory/low-income-housing-tax-credit/. The bill introduced by the Chair of the House Ways and Means Committee in May 2025 proposed lowering the threshold to a 25 percent test. H.R. Con. Res. 14, 119th Cong. § 11109 (2025).
- [91] City of New York Department of Housing Preservation and Development. (2025, March). 2025 Low Income Housing Tax Credit Qualified Allocation Plan. https://www.nyc.gov/assets/hpd/downloads/pdfs/services/2025-qualified-allocation-plan.pdf
- [92] HUD User. Qualified census tract table generator. HUD Office of Policy Development and Research. https://www.huduser.gov/portal/qct/index.html
- [93] New York State Homes and Community Renewal. Low-Income Housing Tax Credit Low-income housing tax credit program (9%) LIHTC program – DHCR administered). https://hcr.ny.gov/low-income-housing-credit-program-9pctRFPLow Income Housing Tax Credits. https://www.nyc.gov/site/hpd/services-and-information/lihtc.page
- [94] New York City Housing Development Corporation. Develop. https://www.nychdc.com/develop
- [95] While bond volume is capped annually at the state level, another important financing source associated with the use of tax-exempt bonds is recycled tax-exempt bonds—previously issued bonds that were unused or repaid early and can be reissued for new affordable housing projects. Although recycled bonds cannot be used to continually unlock 4-percent credits, they remain an important source of capital that can be used to finance affordable housing development.
- [96] Tax-exempt private activity bonds are a type of municipal bond issued by state or local governments to finance projects that primarily benefit private entities but serve a public purpose—such as affordable rental housing, infrastructure, or nonprofit facilities—where the interest earned by bondholders is exempt from federal income tax if specific federal requirements are met under the Internal Revenue Code.
- [97] New York City Housing Preservation and Development. Low Income Housing Tax Credits. https://www.nyc.gov/site/hpd/services-and-information/lihtc.page
- [98] See Technical Appendix for details on this calculation.
- [99] NYU Furman Center for Real Estate and Urban Policy. (2017). The effects of the Low-Income Housing Tax Credit (LIHTC). https://www.furmancenter.org/publication/the-effects-of-the-low-income-housing-tax-credit-lihtc-2/; U.S. Department of Housing and Urban Development. (2017). Understanding whom the LIHTC program serves. https://www.huduser.gov/portal/sites/default/files/pdf/LIHTC-TenantReport-2014.pdf. See updated HUD report: U.S. Department of Housing and Urban Development. (2019). Understanding whom the LIHTC program serves. https://www.huduser.gov/portal/sites/default/files/pdf/LIHTC-TenantReport-2017.pdf
- [100] Oluku, U., & Cheng, S. (2024). The Low-Income Housing Tax Credit program: A multicity rent savings analysis. Housing Policy Debate, 34(3), 326–352. https://doi.org/10.1080/10511482.2022.2070651
- [101] Diamond, R., & McQuade, T. (2019). Who wants affordable housing in their backyard? An equilibrium analysis of low-income property development. Journal of Political Economy, 127(3), 1063–1117. https://doi.org/10.1086/701354
- [102] Ellen, I. G., & Horn, K. (2018). Housing and educational opportunity: Characteristics of local schools near families with federal housing assistance. Poverty & Race Research Action Council. https://www.furmancenter.orgHousingLocationSchools2018.pdf
- [103] Freedman, M., & Owens, E. G. (2011). Low-income housing development and crime. Journal of Urban Economics, 70(2–3), 115–131. https://doi.org/10.1016/j.jue.2011.04.001
- [104] Note that the map does not include LIHTC Year 15 Program projects.
- [105] I.R.C. § 1.1400Z–2 (2018); Investing in Qualified Opportunity Funds, 85 Fed. Reg. 1866-2001 (Jan. 13, 2020).
- [106] This was based on 2011-2015 ACS 5-year estimates. I.R.C. § 1400Z–1; I.R.C. § 45D(e). The bill introduced by the Chair of the House Ways and Means Committee in May 2025 proposed narrowing the criteria for new designations—only tracts with a poverty rate of at least 20 percent (and a median income below 125 percent) or a median income below 70 percent would be eligible to be designated. H.R. Con. Res. 14, 119th Cong. § 11102(a) (2025).
- [107] I.R.C. § 1400Z–1(e). The bill introduced by the Chair of the House Ways and Means Committee in May 2025 proposed eliminating the option to designate contiguous tracts. H.R. Con. Res. 14, 119th Cong. § 11102(b) (2025).
- [108] Coyne, D., & Johnson, C. (2023, July). Use of the Opportunity Zone tax incentive: What the tax data tell us. U.S. Department of the Treasury, Office of Tax Analysis. https://home.treasury.gov/system/files/131/WP-123.pdf
- [109] Coyne, D., & Johnson, C. (2023, July). Use of the Opportunity Zone tax incentive: What the tax data tell us. U.S. Department of the Treasury, Office of Tax Analysis. https://home.treasury.gov/system131/WP-123.pdf
- [110] Corinth, K., Coyne, D., Feldman, N., & Johnson, C. (2025, January).The targeting of place-based policies: The New Markets Tax Credit versus Opportunity Zones. National Bureau of Economic Research. https://www.nber.org/papers/w33414.
- [111] Interview with HDC/HPD staff; see also: Citizens Housing and Planning Council. NYC’s Opportunity Zones: Interactive map. https://chpcny.org/visualization/nycs-opportunity-zones-interactive-map/
- [112] Yildirim, Y., & Lee, E. (2020, January). Socioeconomic profile of the Qualified Opportunity Zones in New York. Baruch College, Steven L. Newman Real Estate Institute. https://zicklin.baruch.cuny.edu/wp-content/uploads/sites/10/2023/03/Opportunity-Zones_NREI-Research-Report_January-2020.pdf
- [113] Yildirim, Y., & Lee, E. (2020, January). Socioeconomic profile of the Qualified Opportunity Zones in New York. Baruch College, Steven L. Newman Real Estate Institute. https://zicklin.baruch.cuny.edu/wp-content/uploads/sites/10/2023/03/Opportunity-Zones_NREI-Research-Report_January-2020.pdf
- [114] I.R.C. § 1400Z-2(a)(1)(A).
- [115] I.R.C. § 1400Z-2(d)(1).
- [116] I.R.C. § 1400Z-2(d)(2)(D).
- [117] I.R.C. § 1400Z-2(d)(2)(D)(ii).
- [118] I.R.C. § 1400Z-2(a)-(b). In other words, if an investor sells stock or real estate (including outside an OZ), and their original investment was purchased for $1 million and is now being sold for $2 million, they have realized capital gains of $1 million, which they invest into a QOF. Instead of being taxed on those capital gains upon a sale, the investor can defer payment of that tax until the end of 2026 if they invest the gain as a qualified opportunity investment. This deferral for a set period of time is the easiest benefit to assign a value to at the time the investment is being made, though it is not clear housing developers can raise equity efficiently based on the value of this benefit.
- [119] I.R.C. § 1400Z-2(b)(2)(B). In other words, while the original investor is still paying tax on the gains made by their qualified OZ investment, they are stepping up the basis of that $1 million qualified OZ investment for the purpose of calculating capital gains taxes. The qualified OZ investment is stepped-up by $100,000 after 5 years and by $150,000 after 7 years. So, if that qualified investment gained in value by $1 million, the capital gains, for the purpose of assessing the tax, is now considered to be $900,000 at the 5 year mark or $850,000 at the 7 year mark rather than $1 million, which leads to tax savings. The bill introduced by the Chair of the House Ways and Means Committee in May 2025 proposed eliminating the step–up in basis in year 7. H.R. Con. Res. 14, 119th Cong. § 11102(a) (2025).
- [120] BDO USA. New York State 2022 budget decouples opportunity zone tax benefits from federal tax benefits. https://www.bdo.com/insights/tax/new-york-state-2022-budget-decouples-opportunity-zone-tax-benefits-from-federal-tax-benefits
- [121] U.S. Department of the Treasury, Internal Revenue Service. Form 8996: Qualified Opportunity Fund (Rev. December 2021). https://www.irs.gov/pub/irs-pdf/f8996.pdf.
- [122] Corinth, K., Coyne, D., Feldman, N., & Johnson, C. (2025, January). The targeting of place-based policies: The New Markets Tax Credit versus Opportunity Zones. National Bureau of Economic Research. https://www.nber.org/papers/w33414
- [123] Chen, J., Glaeser, E., & Wessel, D. (2023). The (non-)effect of opportunity zones on housing prices. Journal of Urban Economics, 133. https://doi.org/10.1016/j.jue.2022.103451
- [124] Snidal, M., Haupert, T., & Li, G. (2023). Low value and hard to stack: Opportunity Zones and the Low-Income Housing Tax Credit. Journal of Urban Affairs, 133, 1-17. https://doi.org/10.1080/07352166.2023.2245076
- [125] Wheeler, H. (2022). Locally optimal place-based policies: Evidence from opportunity zones [Working paper]. https://hbwheeler.github.io/files/JMP_HW.pdf
- [126] Bekkerman, R., et al. (2024). The impact of the Opportunity Zone program on residential real estate. Manufacturing & Service Operations Management, 26(6), 2142-2159. https://doi.org/10.1287/msom.2024.0746
- [127] Bekkerman, R., et al. (2024). The impact of the Opportunity Zone program on residential real estate. Manufacturing & Service Operations Management, 26(6), 2142-2159. https://doi.org/10.1287/msom.2024.0746
- [128] Kennedy, P., & Wheeler, H. (2021). Neighborhood-level investment from the U.S. Opportunity Zone program: Early evidence. https://www.dropbox.com/scl/fi/8scqr7v3wbl304vumnens/OZ_investment.pdf?rlkey=g8lou9xsh1lxwrvtq2o9ubbys&e=1&dl=0The targeting of place-based policies: The New Markets Tax Credit versus Opportunity Zones. National Bureau of Economic Research. https://www.nber.org/papers/w33414
- [129] Campion, S. (2019, August). Opportunity Zones in New York State and New York City. Citizens Budget Commission of New York. https://cbcny.org/research/opportunity-zones-new-york-state-and-city
- [130] Kennedy, P., & Wheeler, H. (2022). Neighborhood-level investment from the U.S. Opportunity Zone program: Early evidence. https://www.dropbox.com/scl/fi/8scqr7v3wbl304vumnens/OZ_investment.pdf?rlkey=g8lou9xsh1lxwrvtq2o9ubbys&e=1&dl=0The targeting of place-based policies: The New Markets Tax Credit versus Opportunity Zones. National Bureau of Economic Research. https://www.nber.org/papers/w33414
- [131] Corinth, K., & Feldman, N. (2024). Are Opportunity Zones an effective place-based policy?Journal of Economic Perspectives, 38(3), 113–136. https://doi.org/10.1257/jep.38.3.113
- [132] Coyne, D., & Johnson, C. (2023, July). Use of the Opportunity Zone tax incentive: What the tax data tell us. U.S. Department of the Treasury, Office of Tax Analysis. https://home.treasury.gov/system/files/131/WP-123.pdf
- [133] Kennedy, P., & Wheeler, H. (2022). Neighborhood-level investment from the U.S. Opportunity Zone program: Early evidence. https://www.dropbox.com/scl/fi/8scqr7v3wbl304vumnens/OZ_investment.pdf?rlkey=g8lou9xsh1lxwrvtq2o9ubbys&e=1&dl=0
- [134] Coyne, D., & Johnson, C. (2023, July). Use of the Opportunity Zone tax incentive: What the tax data tell us. U.S. Department of the Treasury, Office of Tax Analysis. https://home.treasury.gov/system/files/131/WP-123.pdf