
State of Homeowners and Their Homes 2024
This section summarizes key trends in homeownership, home financing, and residential property values in New York City, as illustrated in the charts that follow. While the citywide homeownership rate has remained largely stable over the past decade, the financial and market conditions that shape how households enter, sustain, and benefit from homeownership have changed. Rising interest rates, shifts in mortgage activity, cost burdens, and uneven property value trends have influenced the accessibility and outcomes of homeownership across different neighborhoods and demographic groups. Unless otherwise noted, all income and property value figures in this section are adjusted for inflation and presented in 2023 dollars.
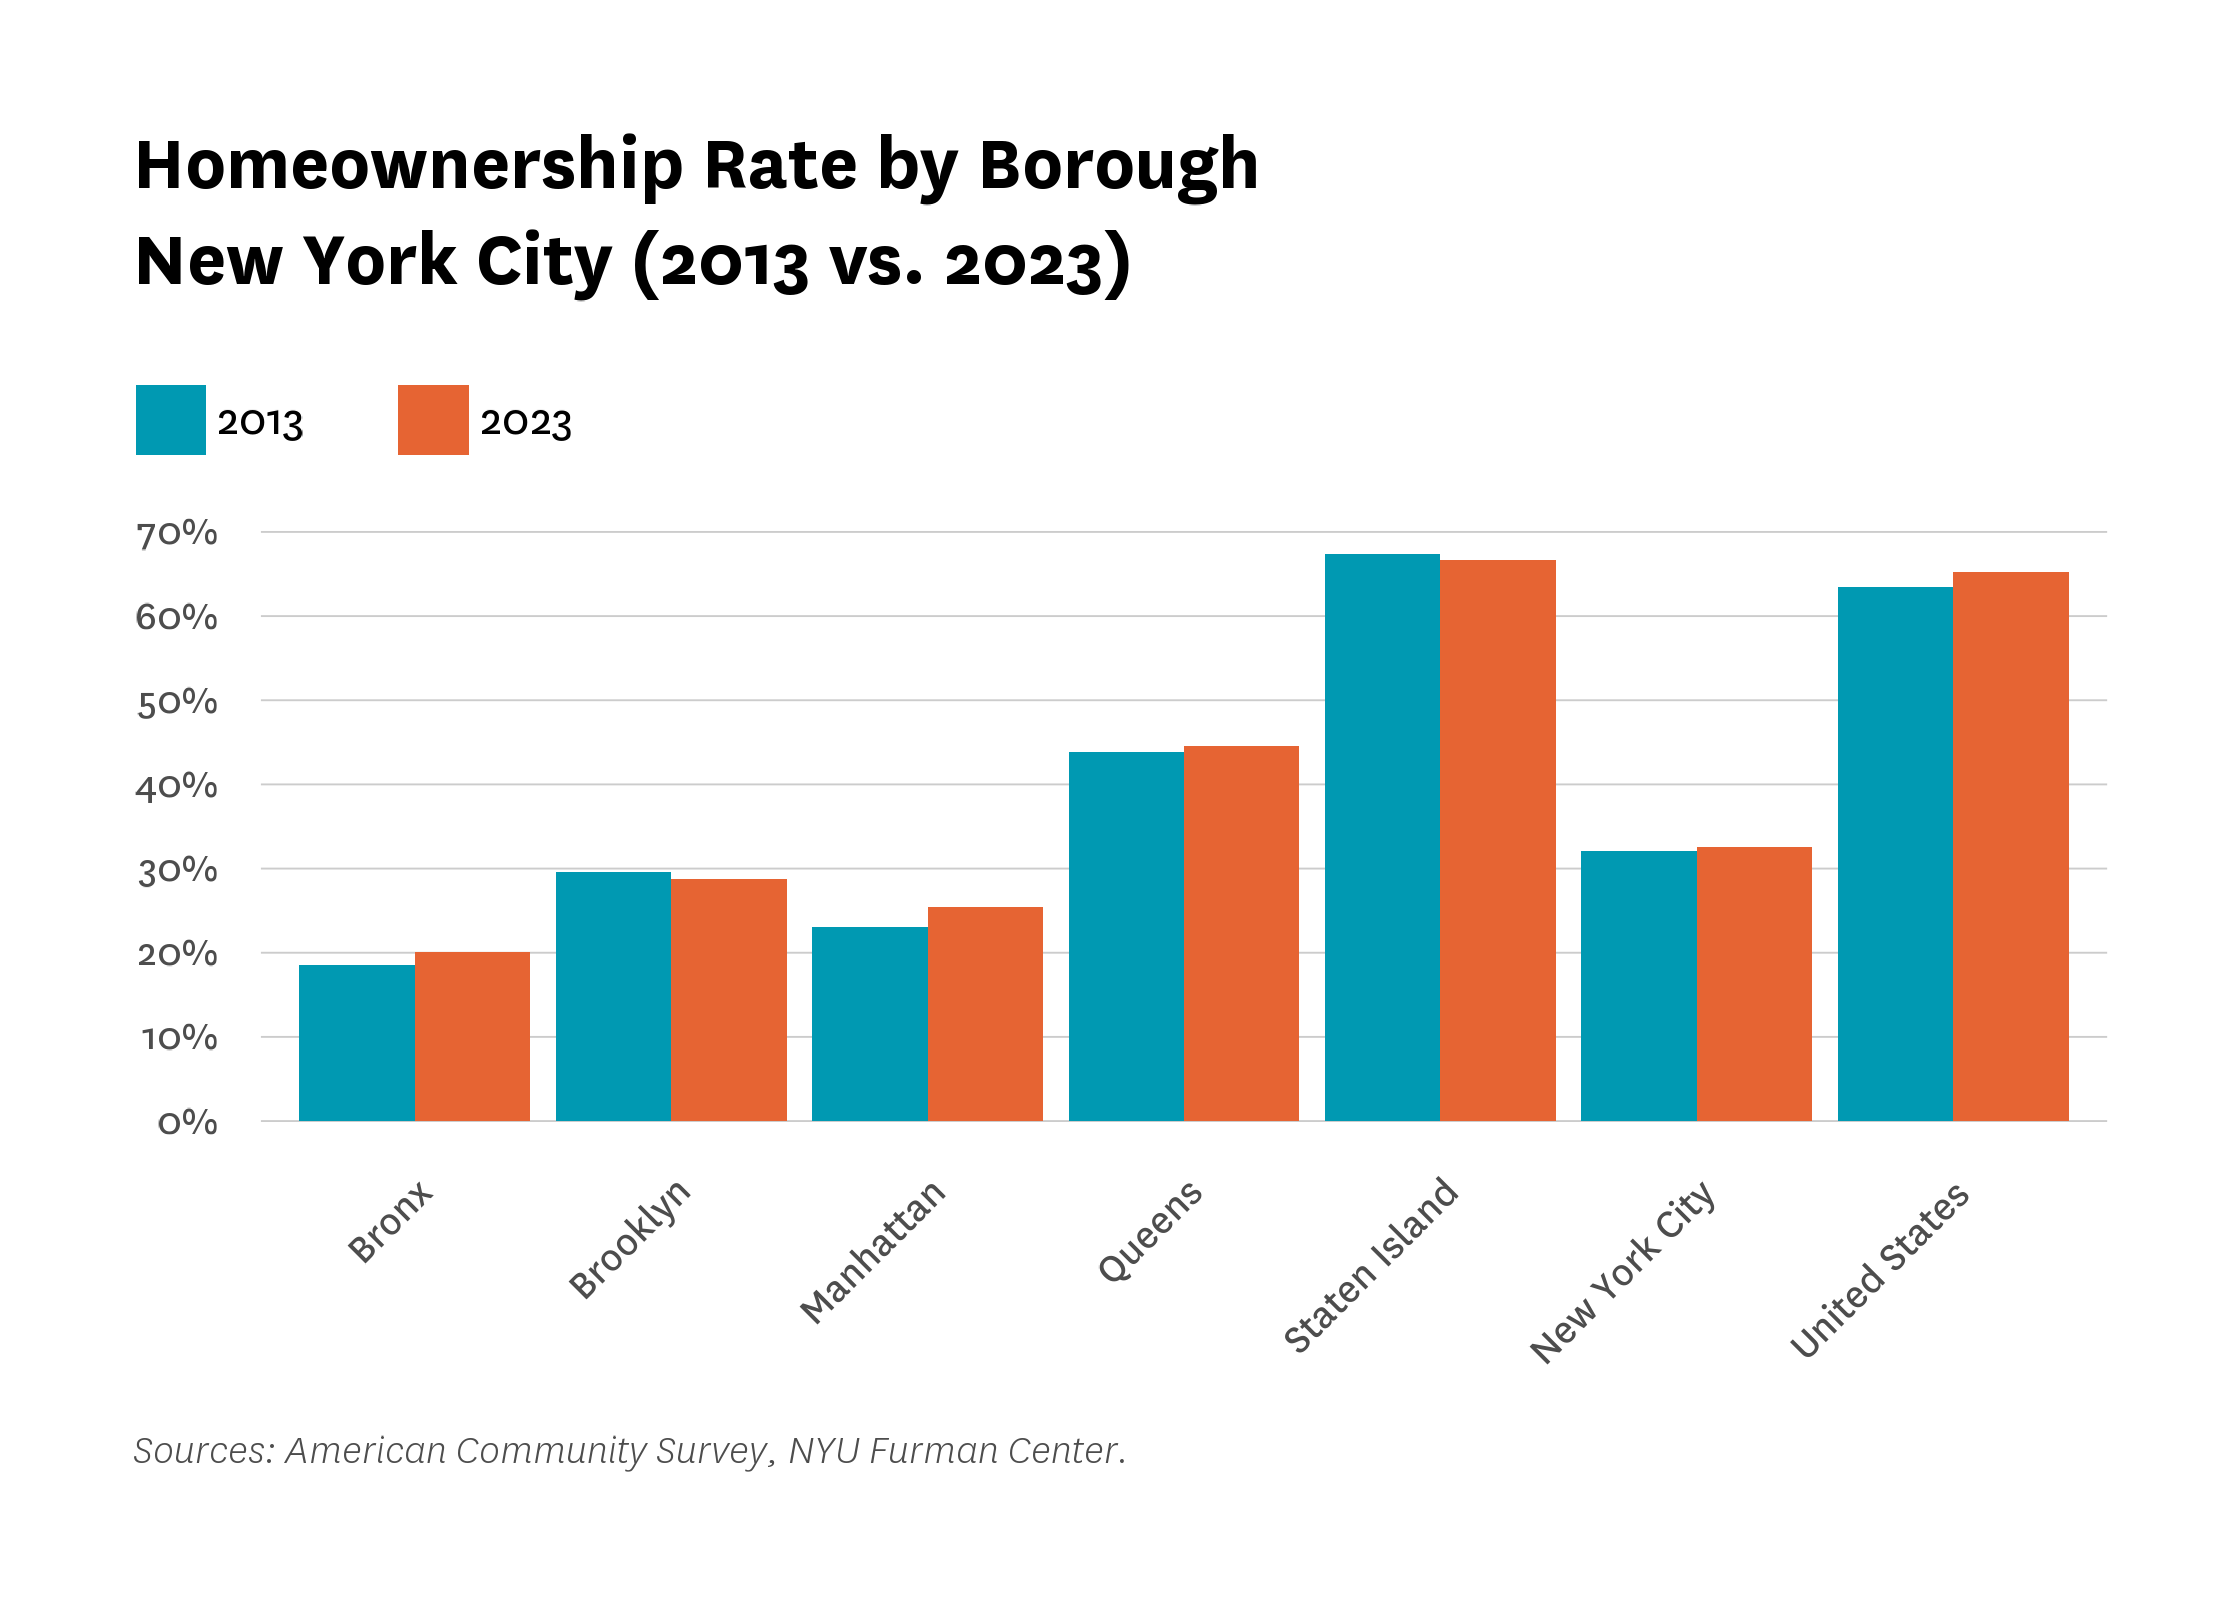
The homeownership rate in New York City has neither grown nor contracted in a meaningful way over the past decade, increasing only slightly—from 32.0 percent in 2013 to 32.5 percent in 2023 (Figure 1). Staten Island consistently reported the highest homeownership rate at 66.6 percent, which remains above the national average of 65.2 percent. Queens had the second-highest rate at 44.6 percent, while Manhattan (25.4 percent), Brooklyn (28.7 percent), and the Bronx (20.1 percent) remained well below the citywide average. Only Brooklyn and Staten Island experienced modest declines in homeownership over the period.
Figure 1:
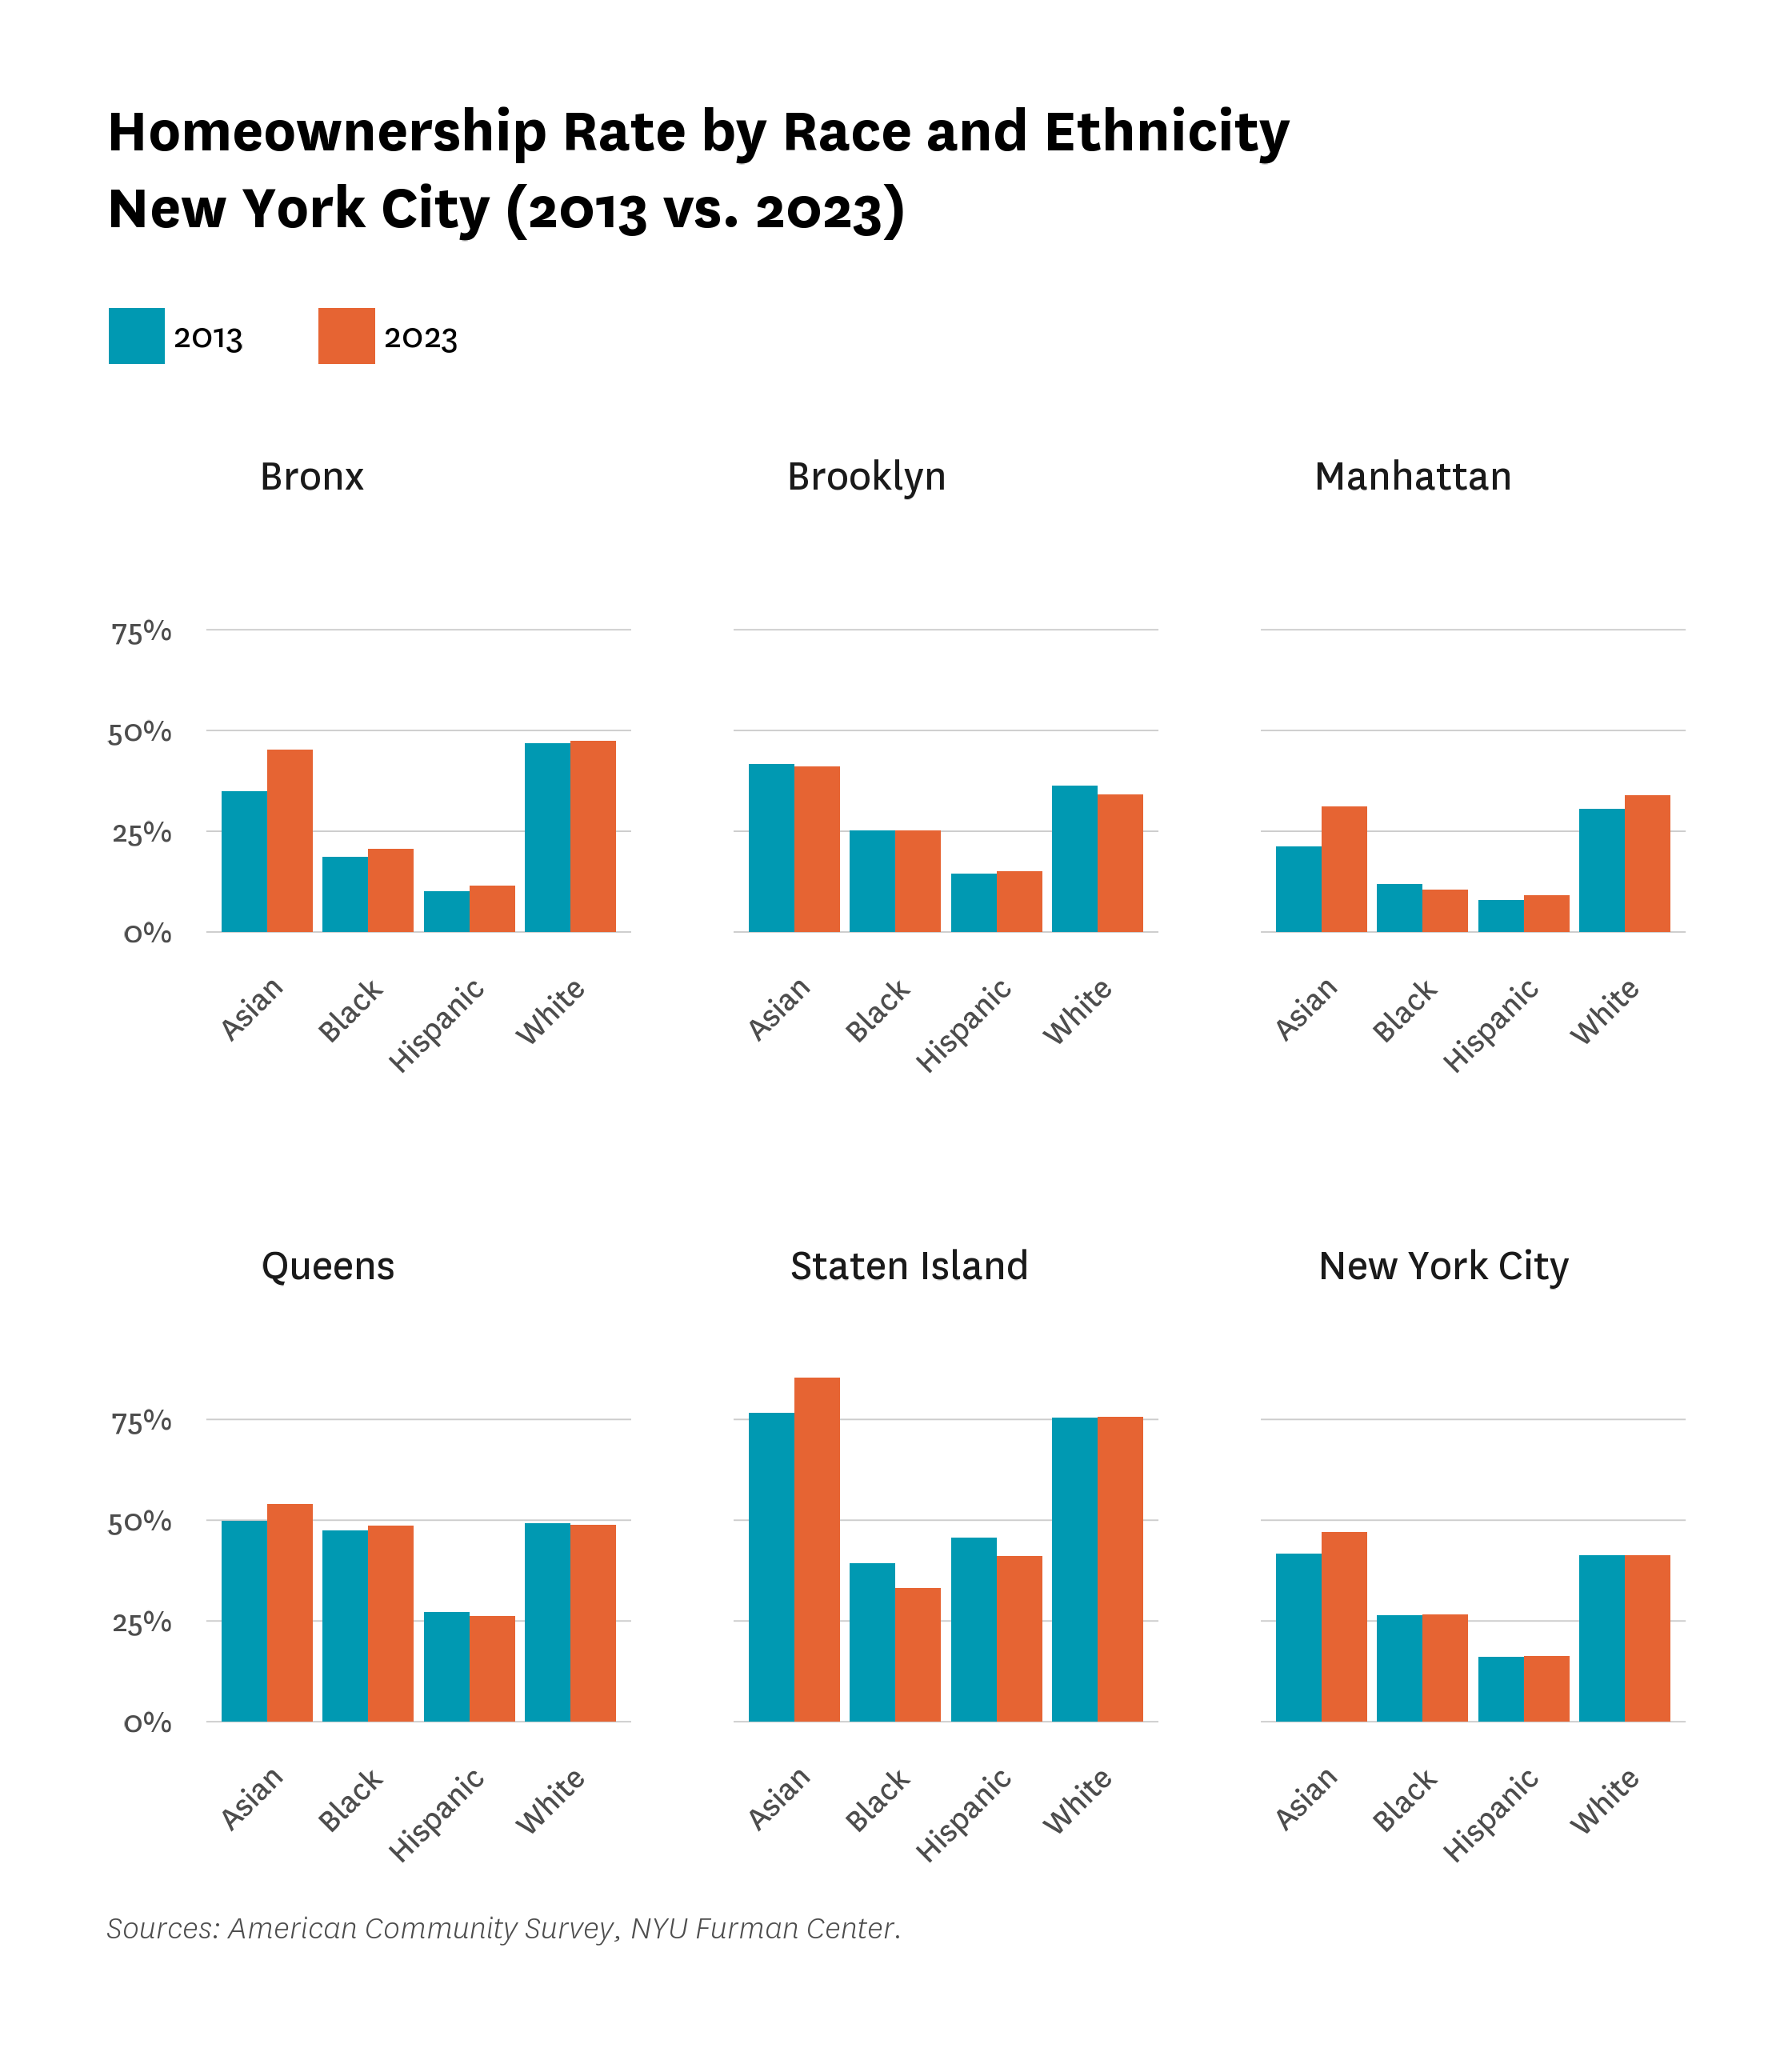
Despite this overall stability, homeownership outcomes varied widely across racial and ethnic groups. As shown in Figure 2, Asian households had the highest homeownership rate in 2023 at 47.1 percent, followed by white households at 41.3 percent. Black and Hispanic households had significantly lower rates at 26.7 percent and 16.4 percent, respectively. The widest disparities were observed in Staten Island, where homeownership rates for Asian and white households exceeded those of Black and Hispanic households by more than 40 percentage points. The Bronx and Manhattan also showed large racial gaps, while Queens had the smallest, with just a 0.2-point difference between Black and white households.
Over the past decade, Asian households saw the largest citywide increase in homeownership—rising by 5.5 percentage points—at least 5.2 percentage points more than any other racial or ethnic group. Meanwhile, white homeownership declined slightly citywide (by 0.1 percentage points), and Black and Hispanic rates declined in several boroughs. For example, Black homeownership declined in Brooklyn, Manhattan, and Staten Island, and Hispanic homeownership declined in Queens and Staten Island. These changes contributed to persistent disparities in ownership across race and geography.
Figure 2:
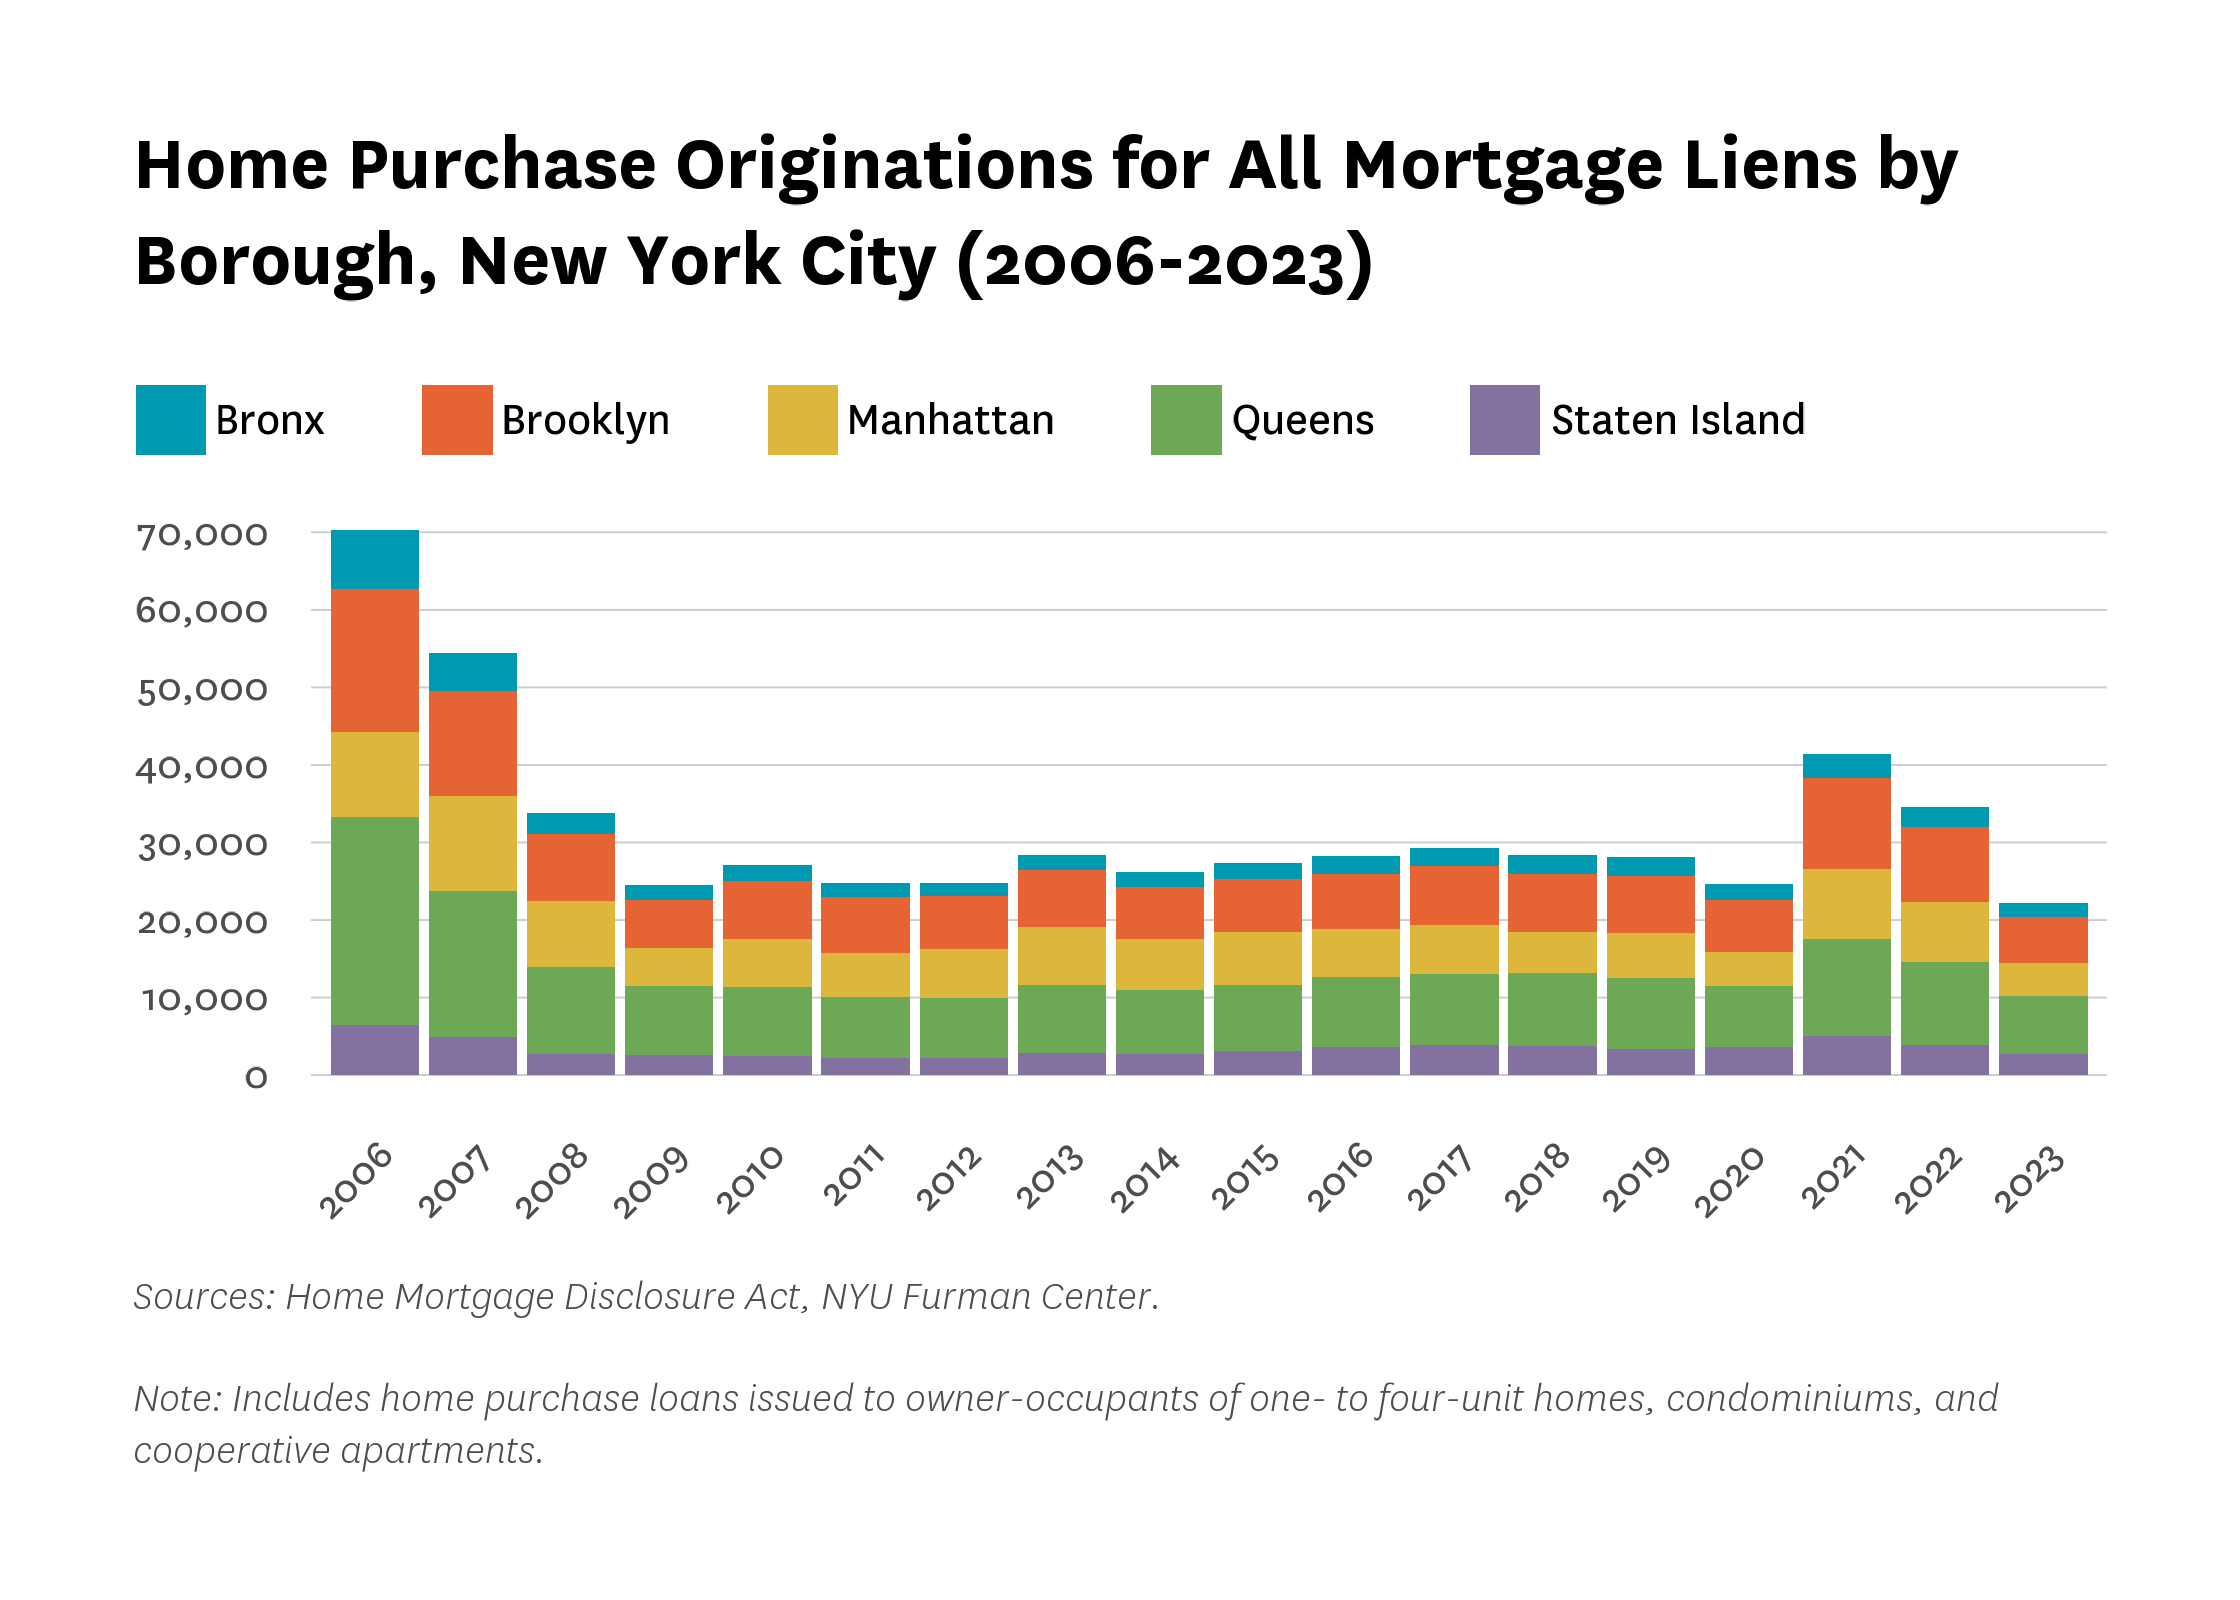
Mortgage activity shifted markedly in 2023. Following elevated borrowing during the pandemic, mortgage-financed home purchase originations declined across all boroughs (Figure 3), reaching 22,193—the lowest level since the Furman Center began tracking this metric in 2006. This followed a 67.8 percent increase in 2021 during a period of historically low interest rates,1 and a 16.6 percent drop in 2022. In 2023, Manhattan saw the steepest year-over-year decline in originations (43.3 percent), while the Bronx had the smallest (28.4 percent). The drop in mortgage activity may reflect both reduced homebuying and a rise in all-cash or nontraditional transactions.
Figure 3:
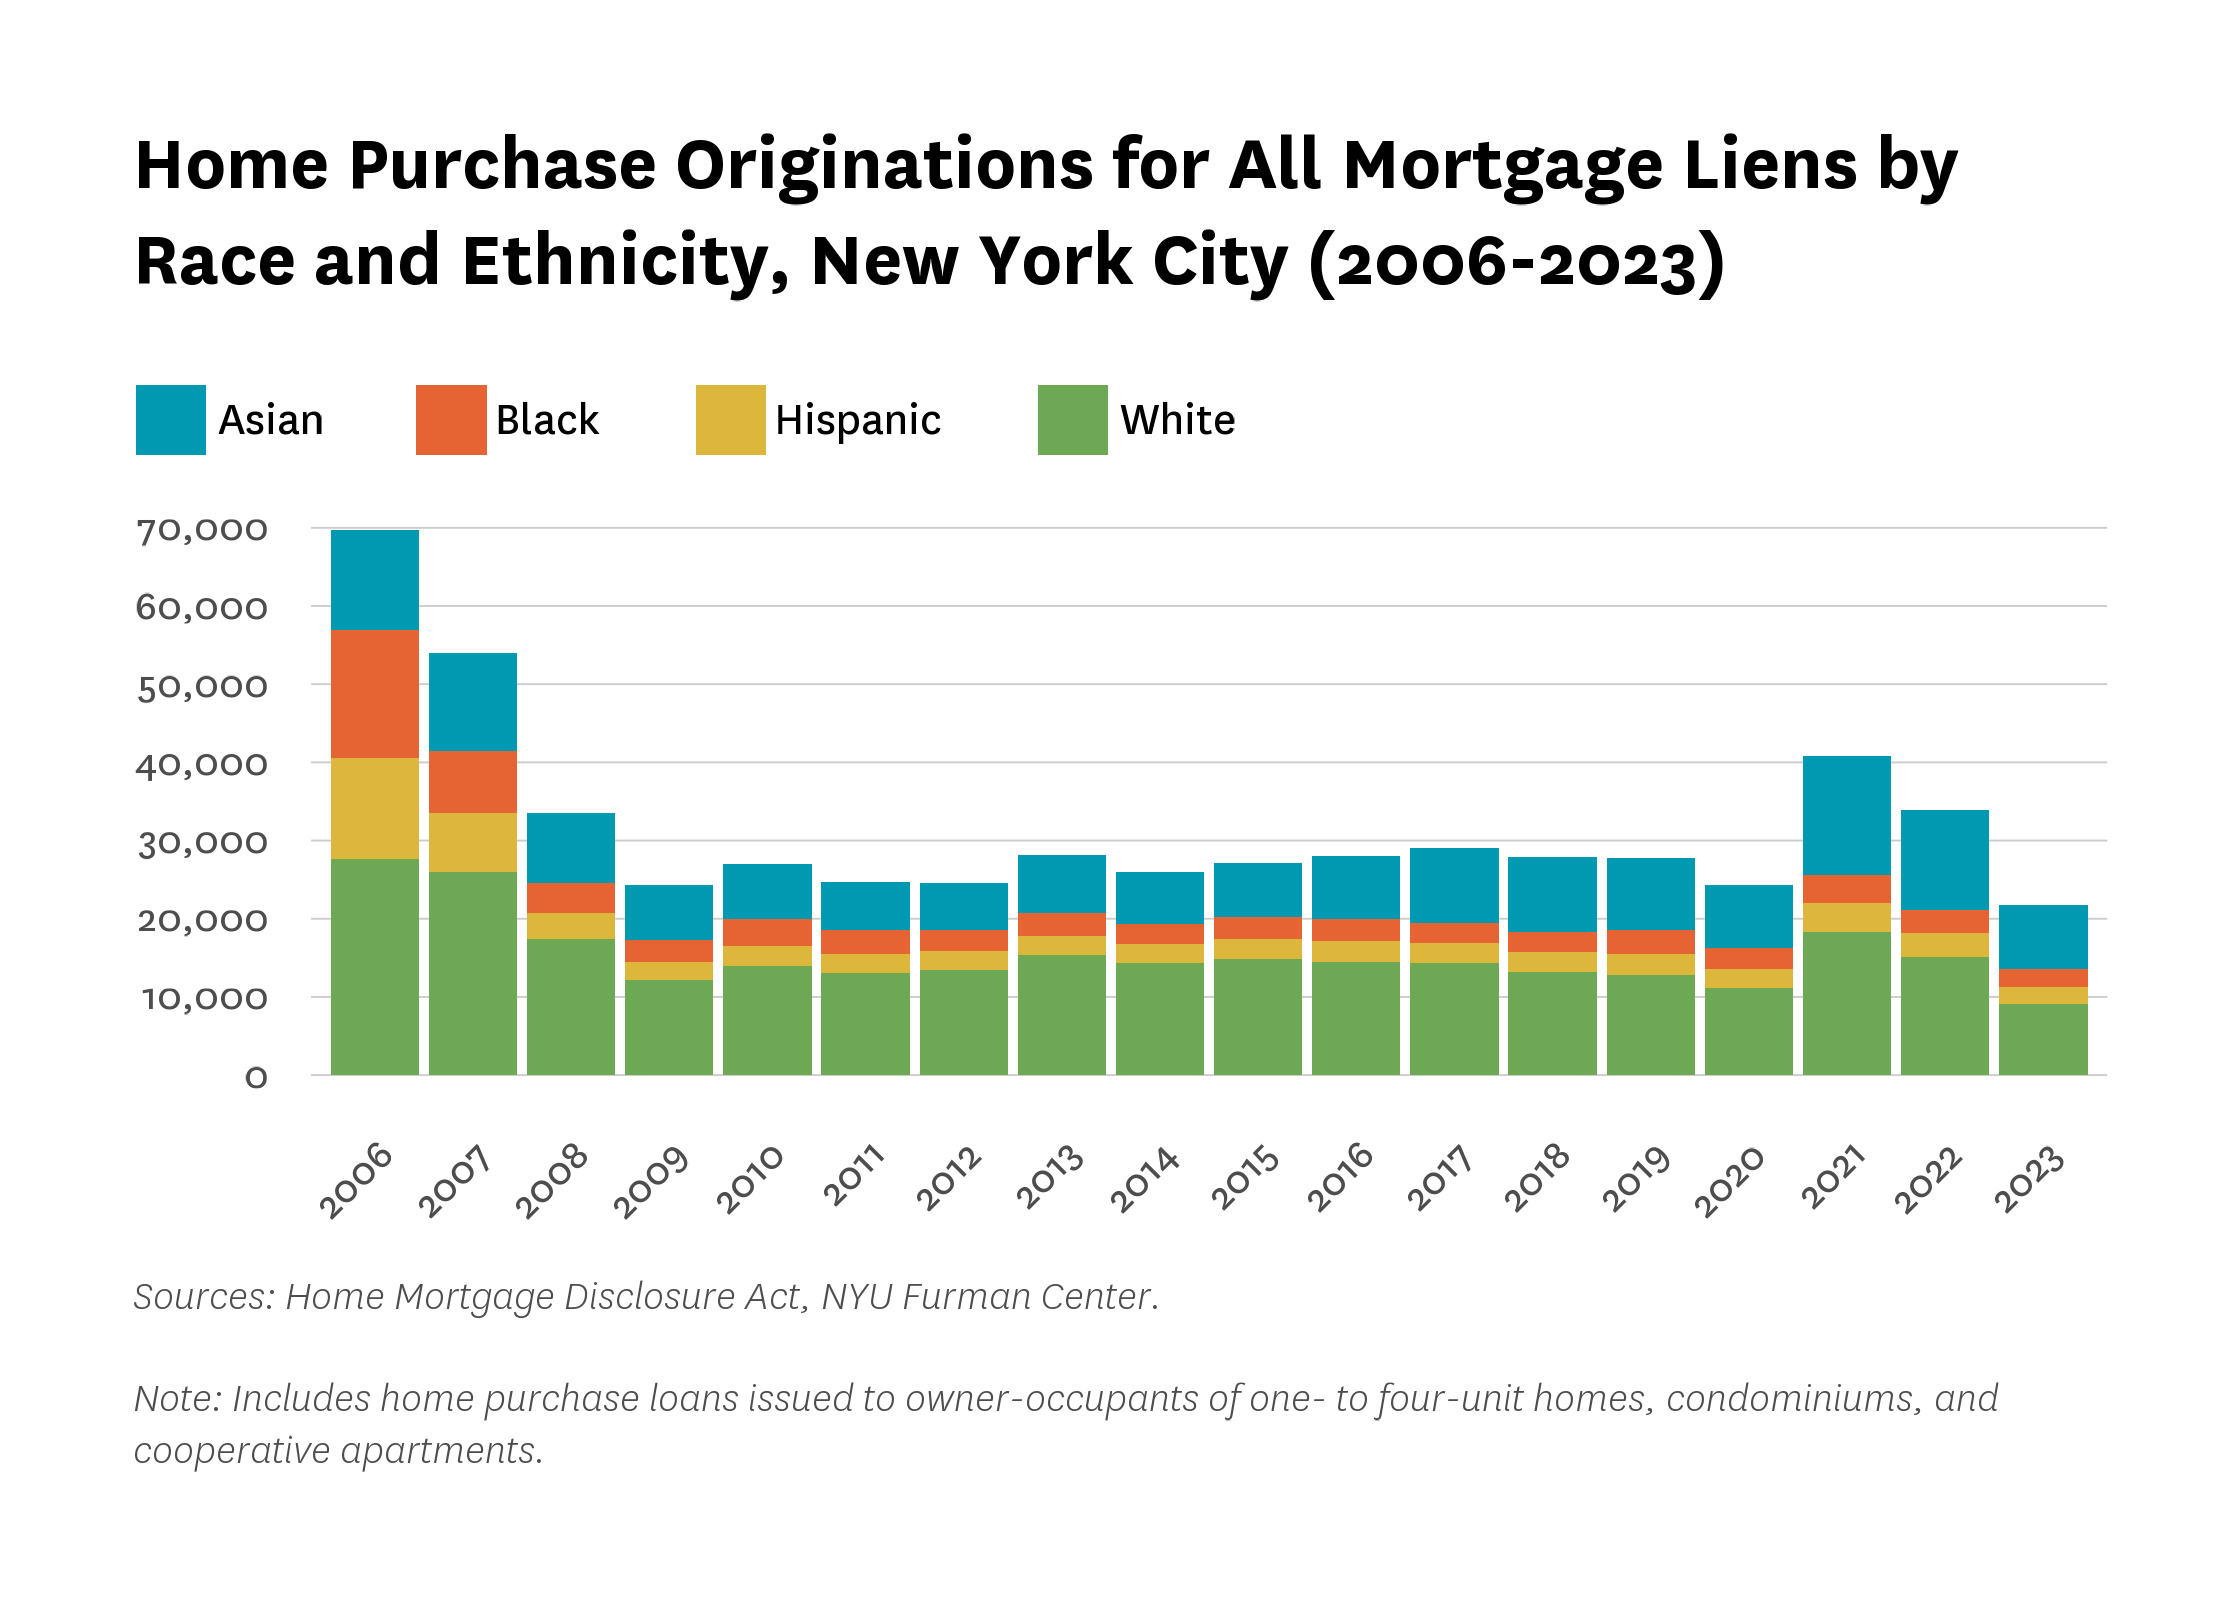
The slowdown in mortgage activity was broad-based, extending across racial and ethnic groups. As shown in Figure 4, all racial and ethnic groups experienced a drop in mortgage originations between 2022 and 2023. White borrowers experienced the largest decline (39.6 percent) but continued to represent the largest share of originations (41.9 percent). Black and Hispanic borrowers each made up about 10 percent of total originations in 2023, experiencing declines of 23.0 percent and 28.7 percent, respectively.
Figure 4:
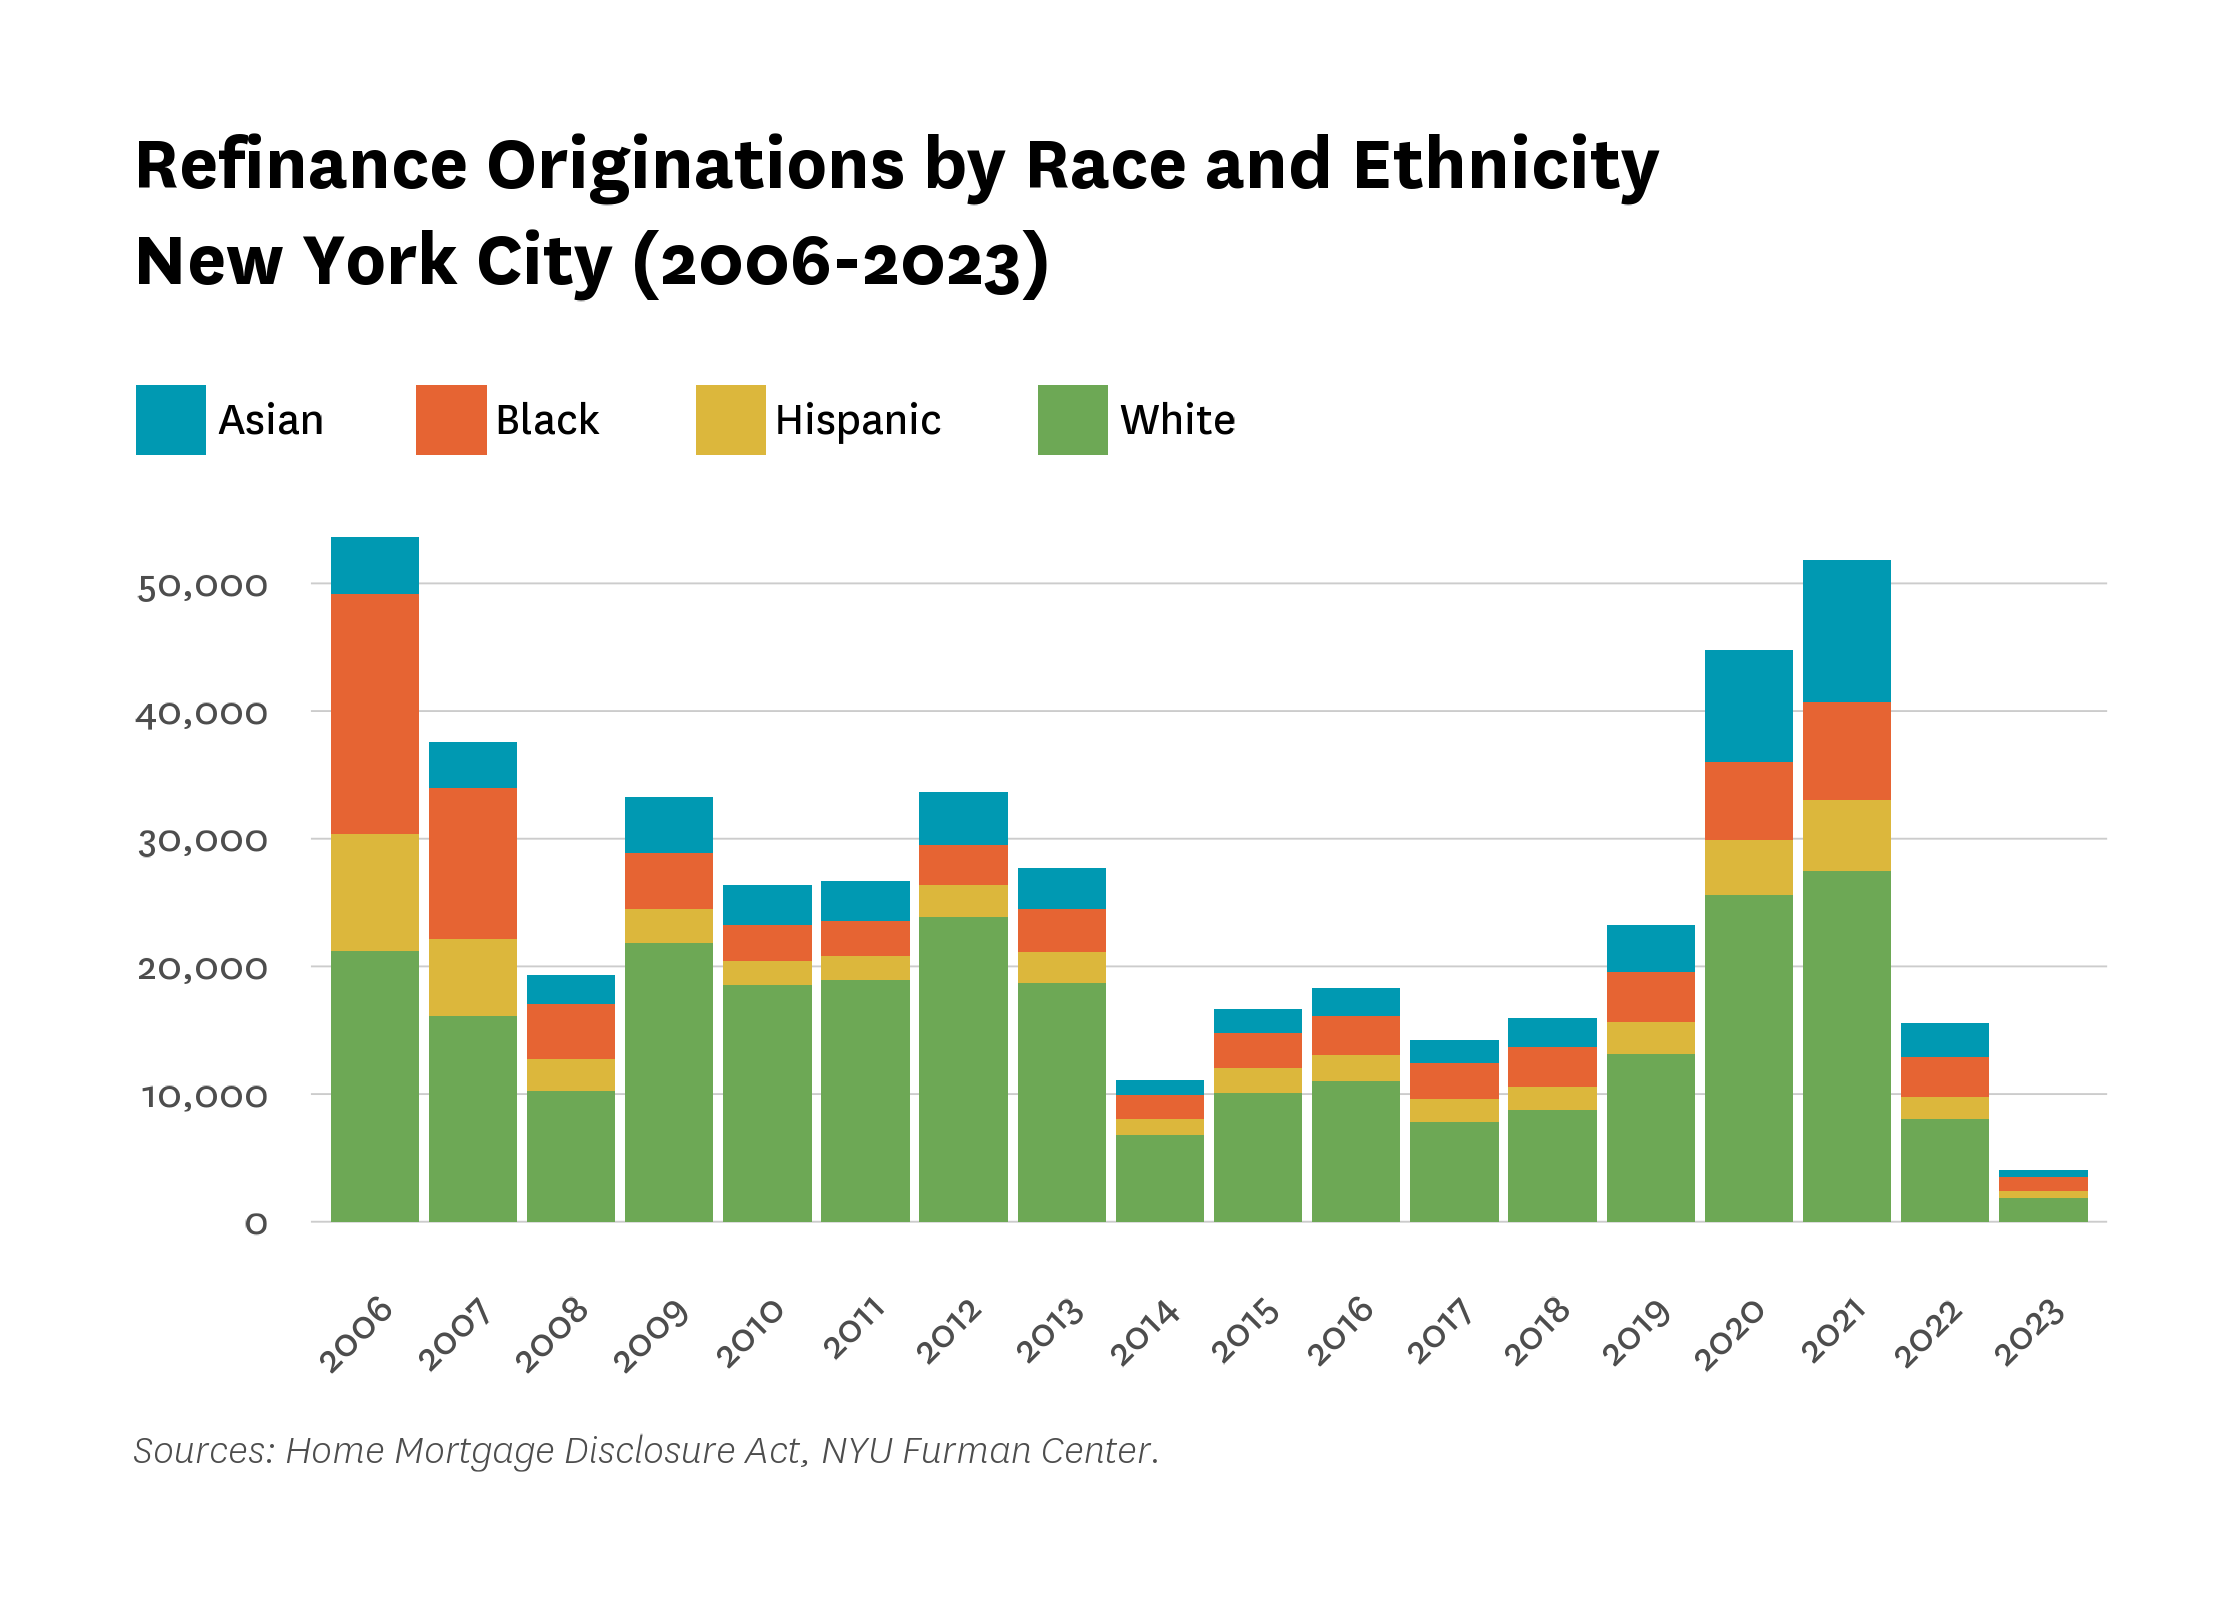
Refinancing activity followed similar patterns. Citywide, the number of refinance originations dropped from 15,794 in 2022 to 4,141 in 2023—a 73.8 percent decrease. The sharpest declines occurred in Manhattan and Brooklyn (Figure 5). As shown in Figure 6, white and Asian borrowers experienced the largest percentage declines (76.4 and 80.2 percent, respectively), while Black and Hispanic borrowers saw smaller but still substantial decreases (62.8 and 72.3 percent). These shifts coincided with rising interest rates, which likely contributed to reduced borrowing.
Figure 5:
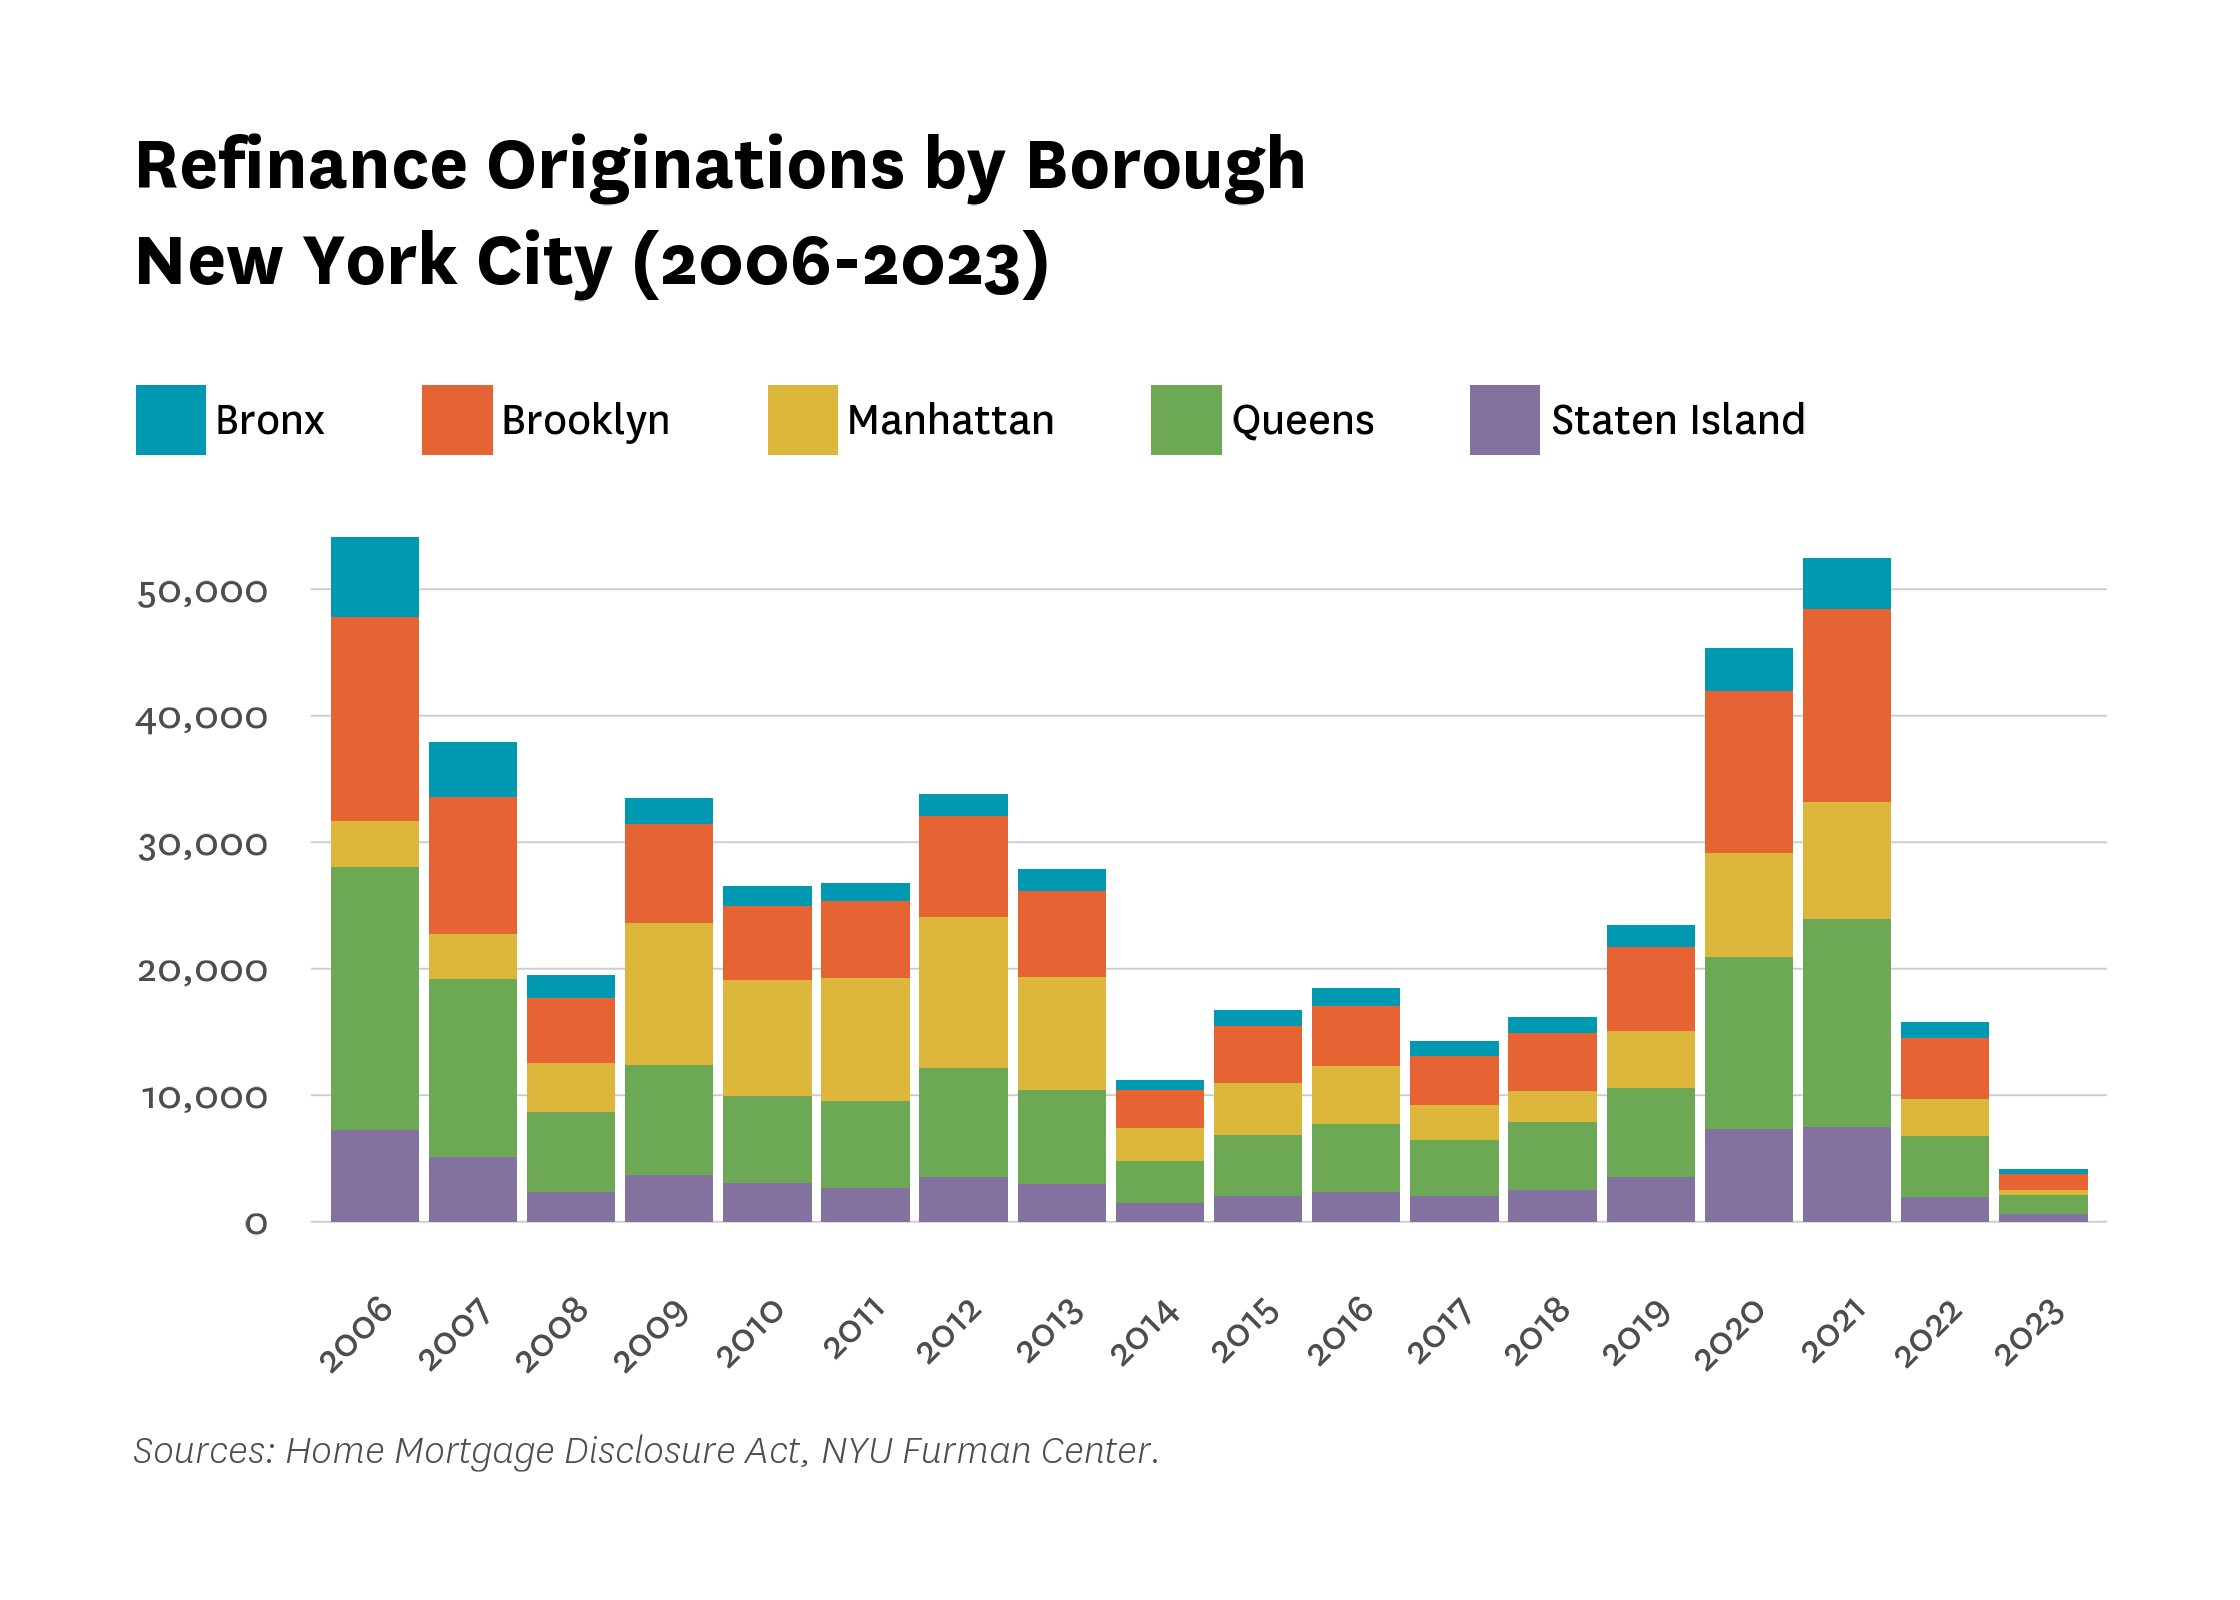
Figure 6:
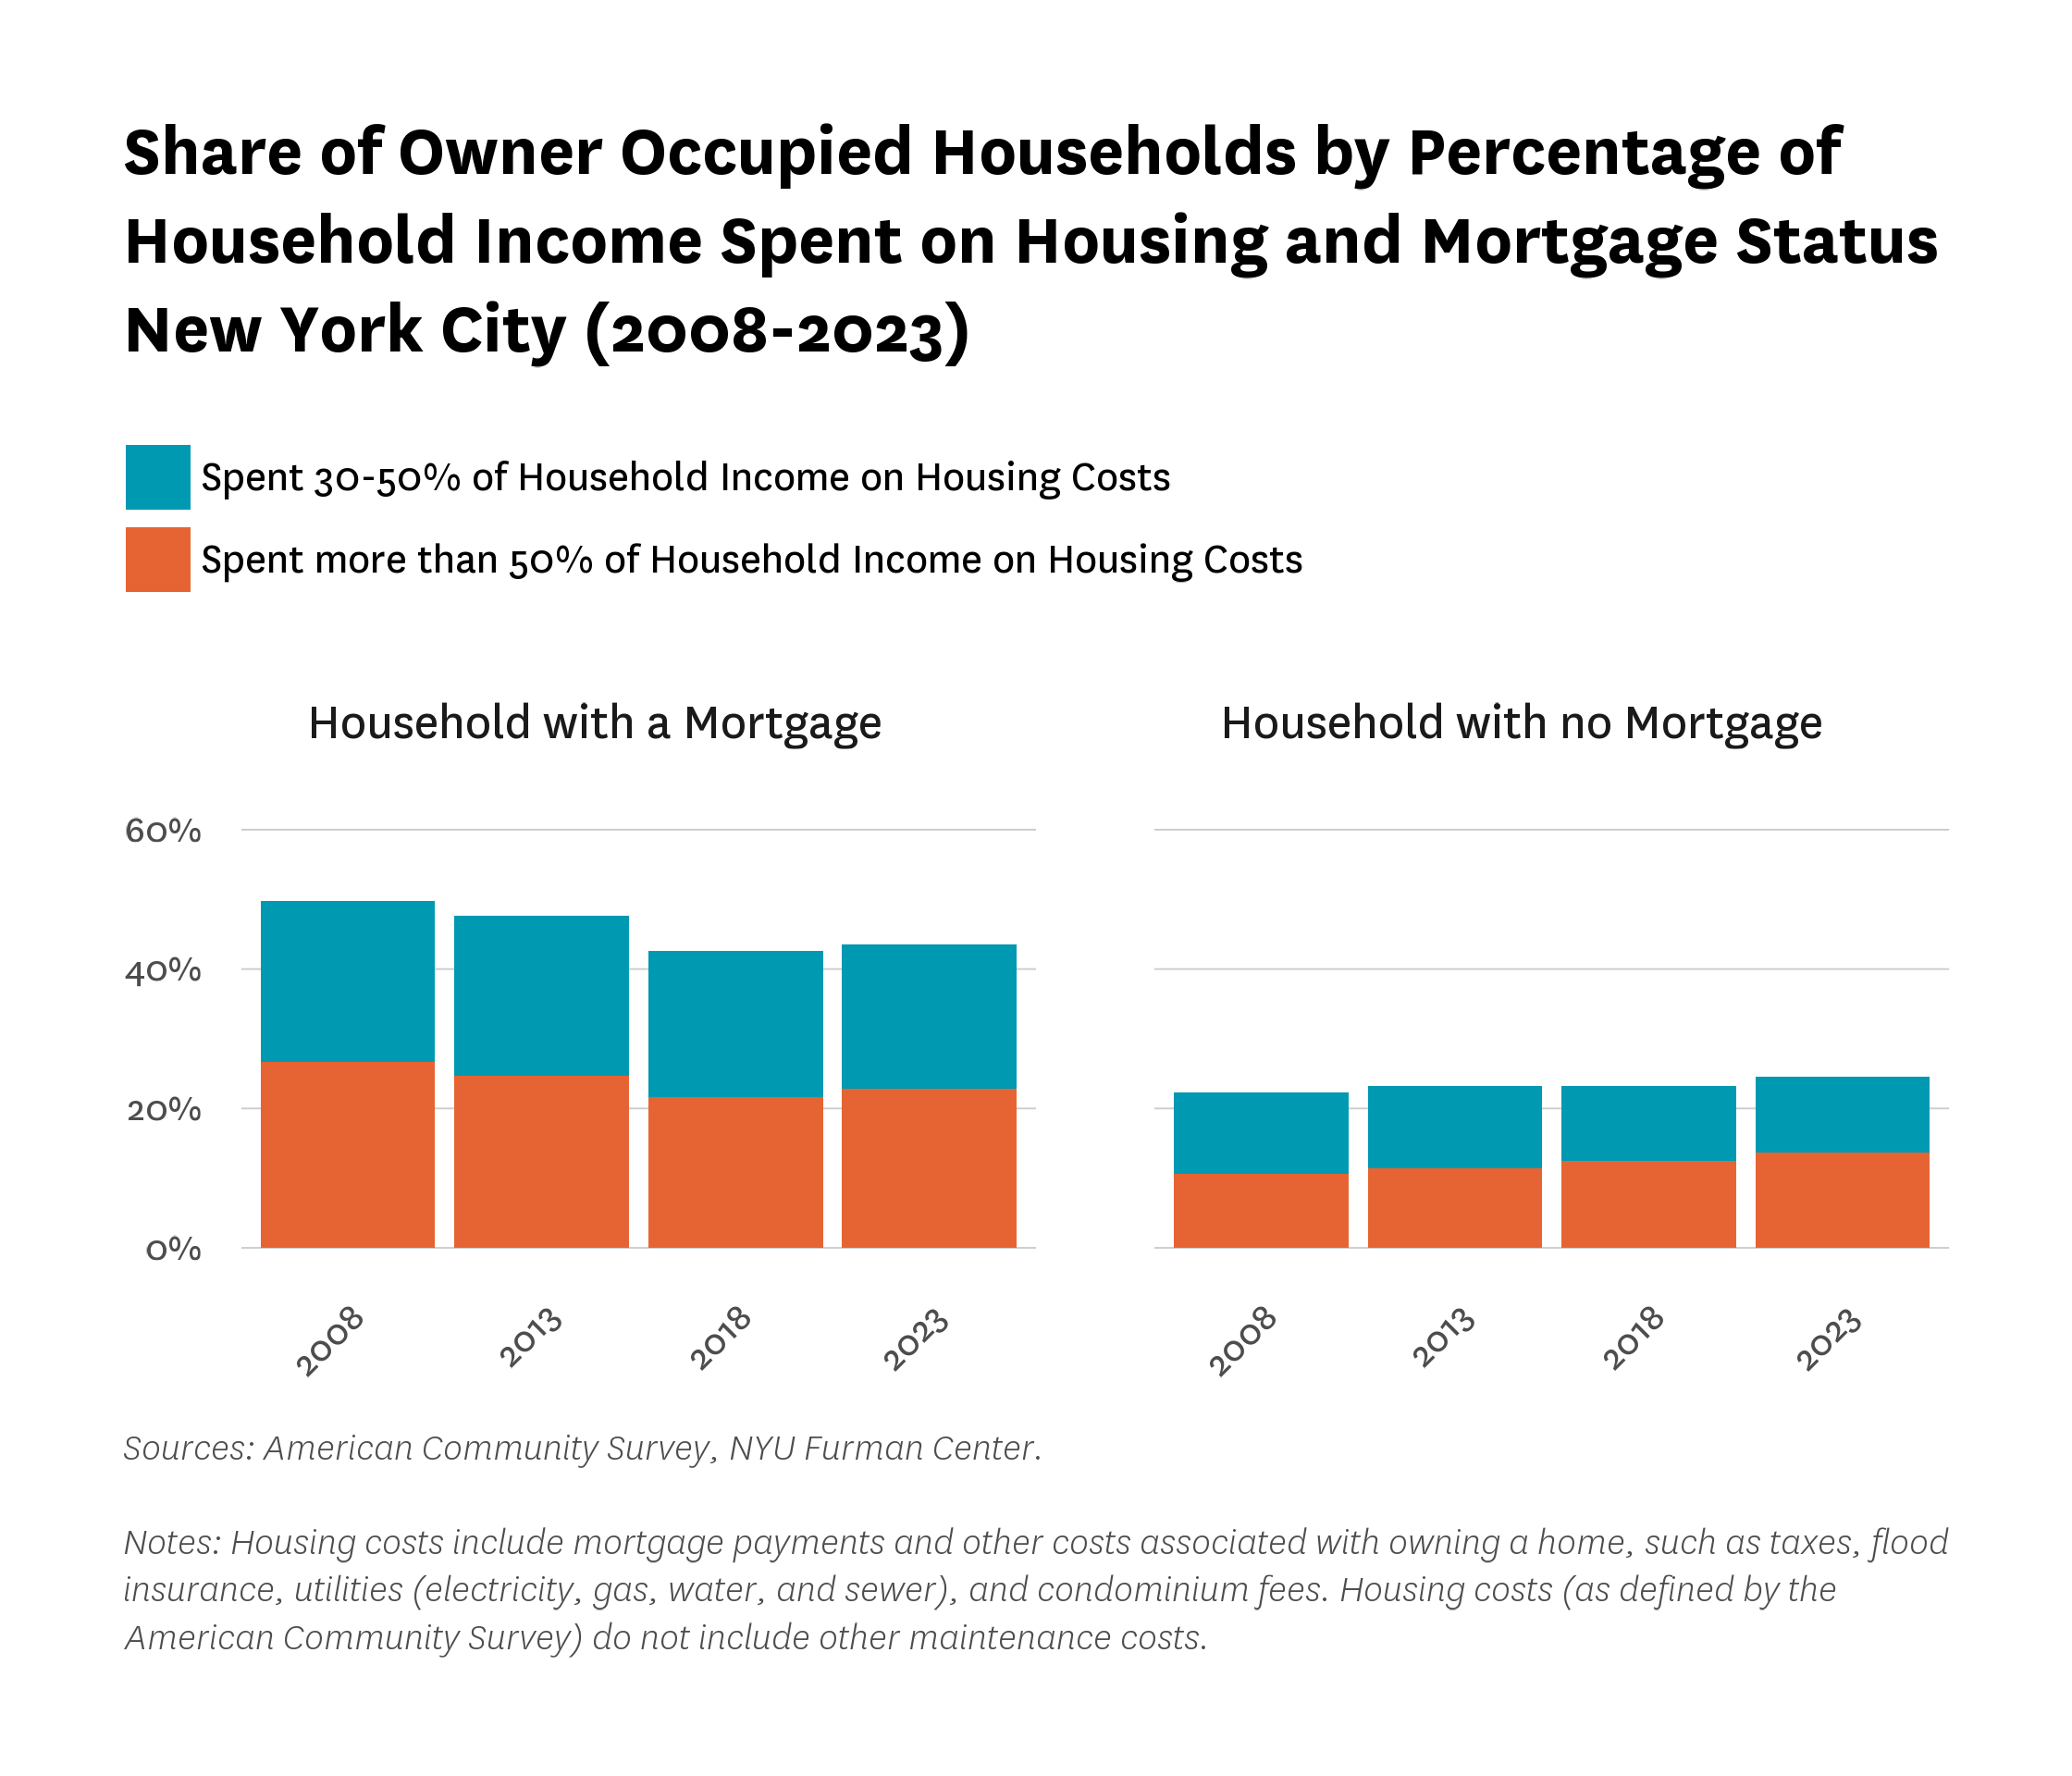
Recent data show that affordability challenges have persisted for many owners, particularly those with outstanding mortgages. As illustrated in Figure 7, the share of mortgage-holders spending more than half of their income on housing declined from 26.7 percent in 2008 to 21.7 percent in 2018, then rose modestly to 22.8 percent by 2023. Owners without a mortgage continued to face lower rates of severe cost burden, though their rates also rose slightly—from 10.7 percent in 2008 to 13.7 percent in 2023. The severe burden rate for owners without a mortgage remained 9.1 percentage points lower than for those with a mortgage.
Figure 7:
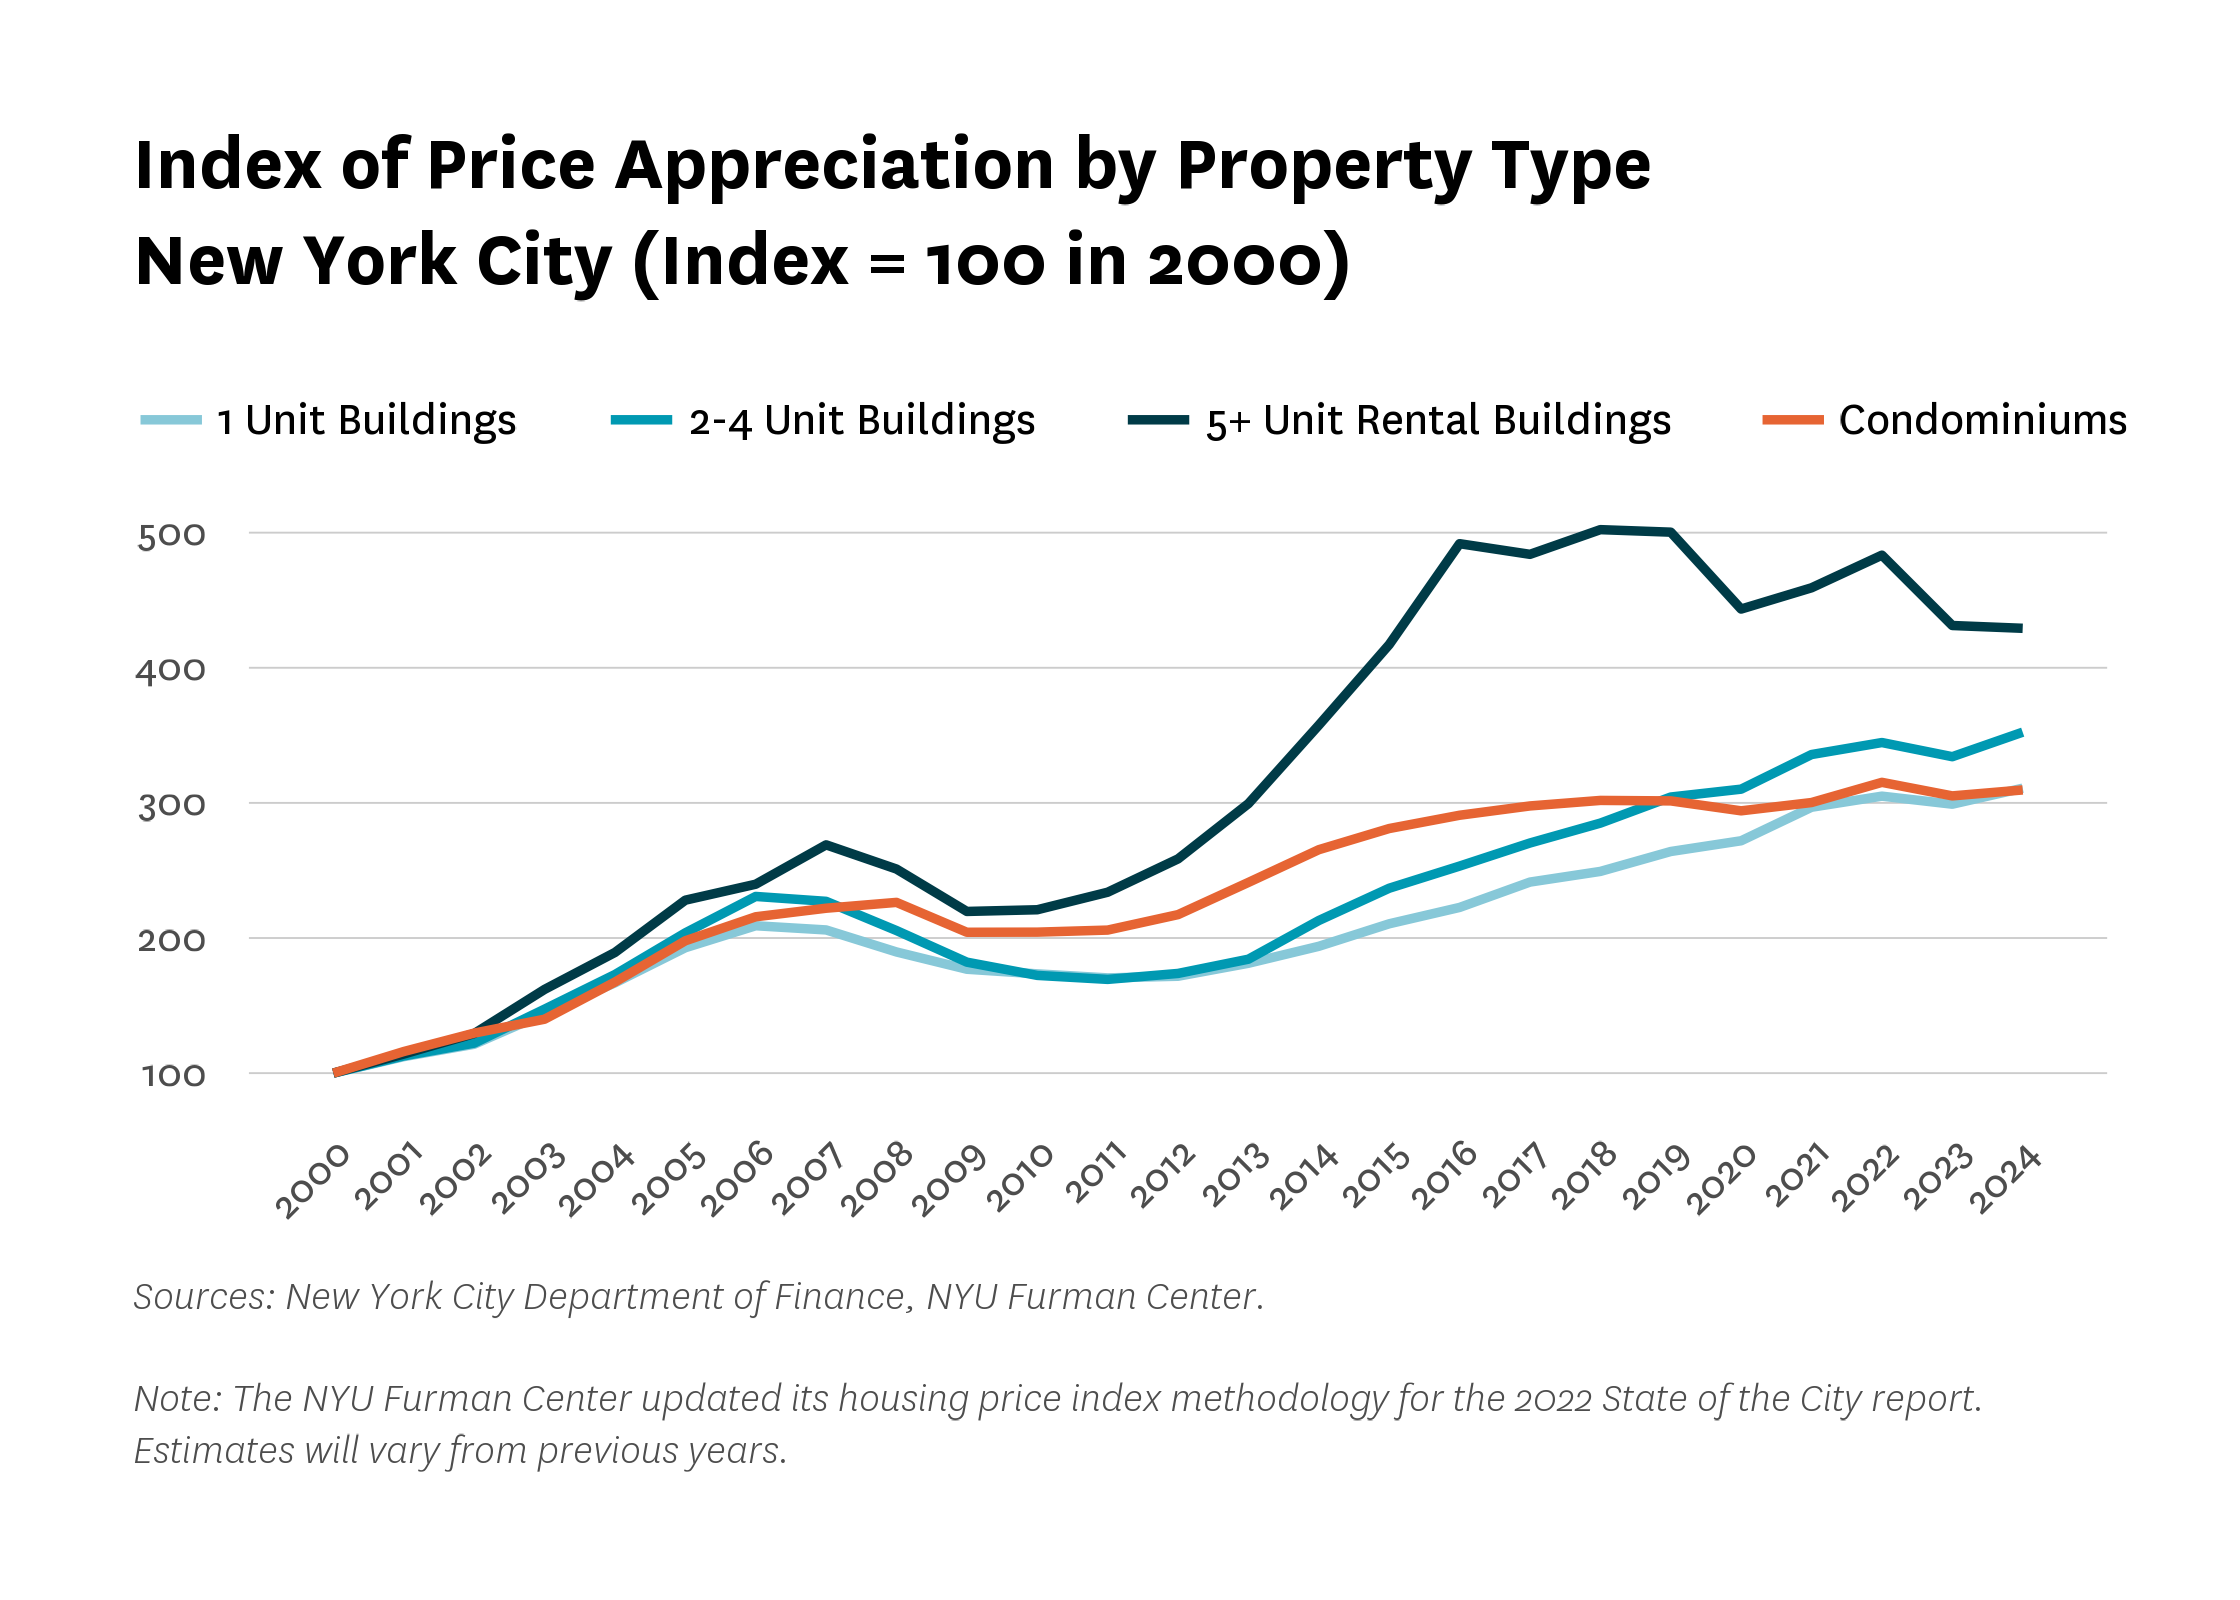
Residential property values continued to rise in most parts of the city. As shown in Figure 8, values increased across all boroughs in 2024 except Manhattan, with the largest gains recorded in the Bronx (23.5 percentage points) and Staten Island (15.4 points). Figure 9 highlights differences by property type: one- to four-unit homes and condominiums saw moderate price appreciation, while larger rental buildings declined to their lowest value since 2015. The prevalence of five-or-more-unit buildings in Manhattan may be contributing to the borough’s recent decline in residential values. Since 2000, values for one- to four-unit homes and condominiums have more than tripled, while values for buildings with five or more units have more than quadrupled.
Figure 8:
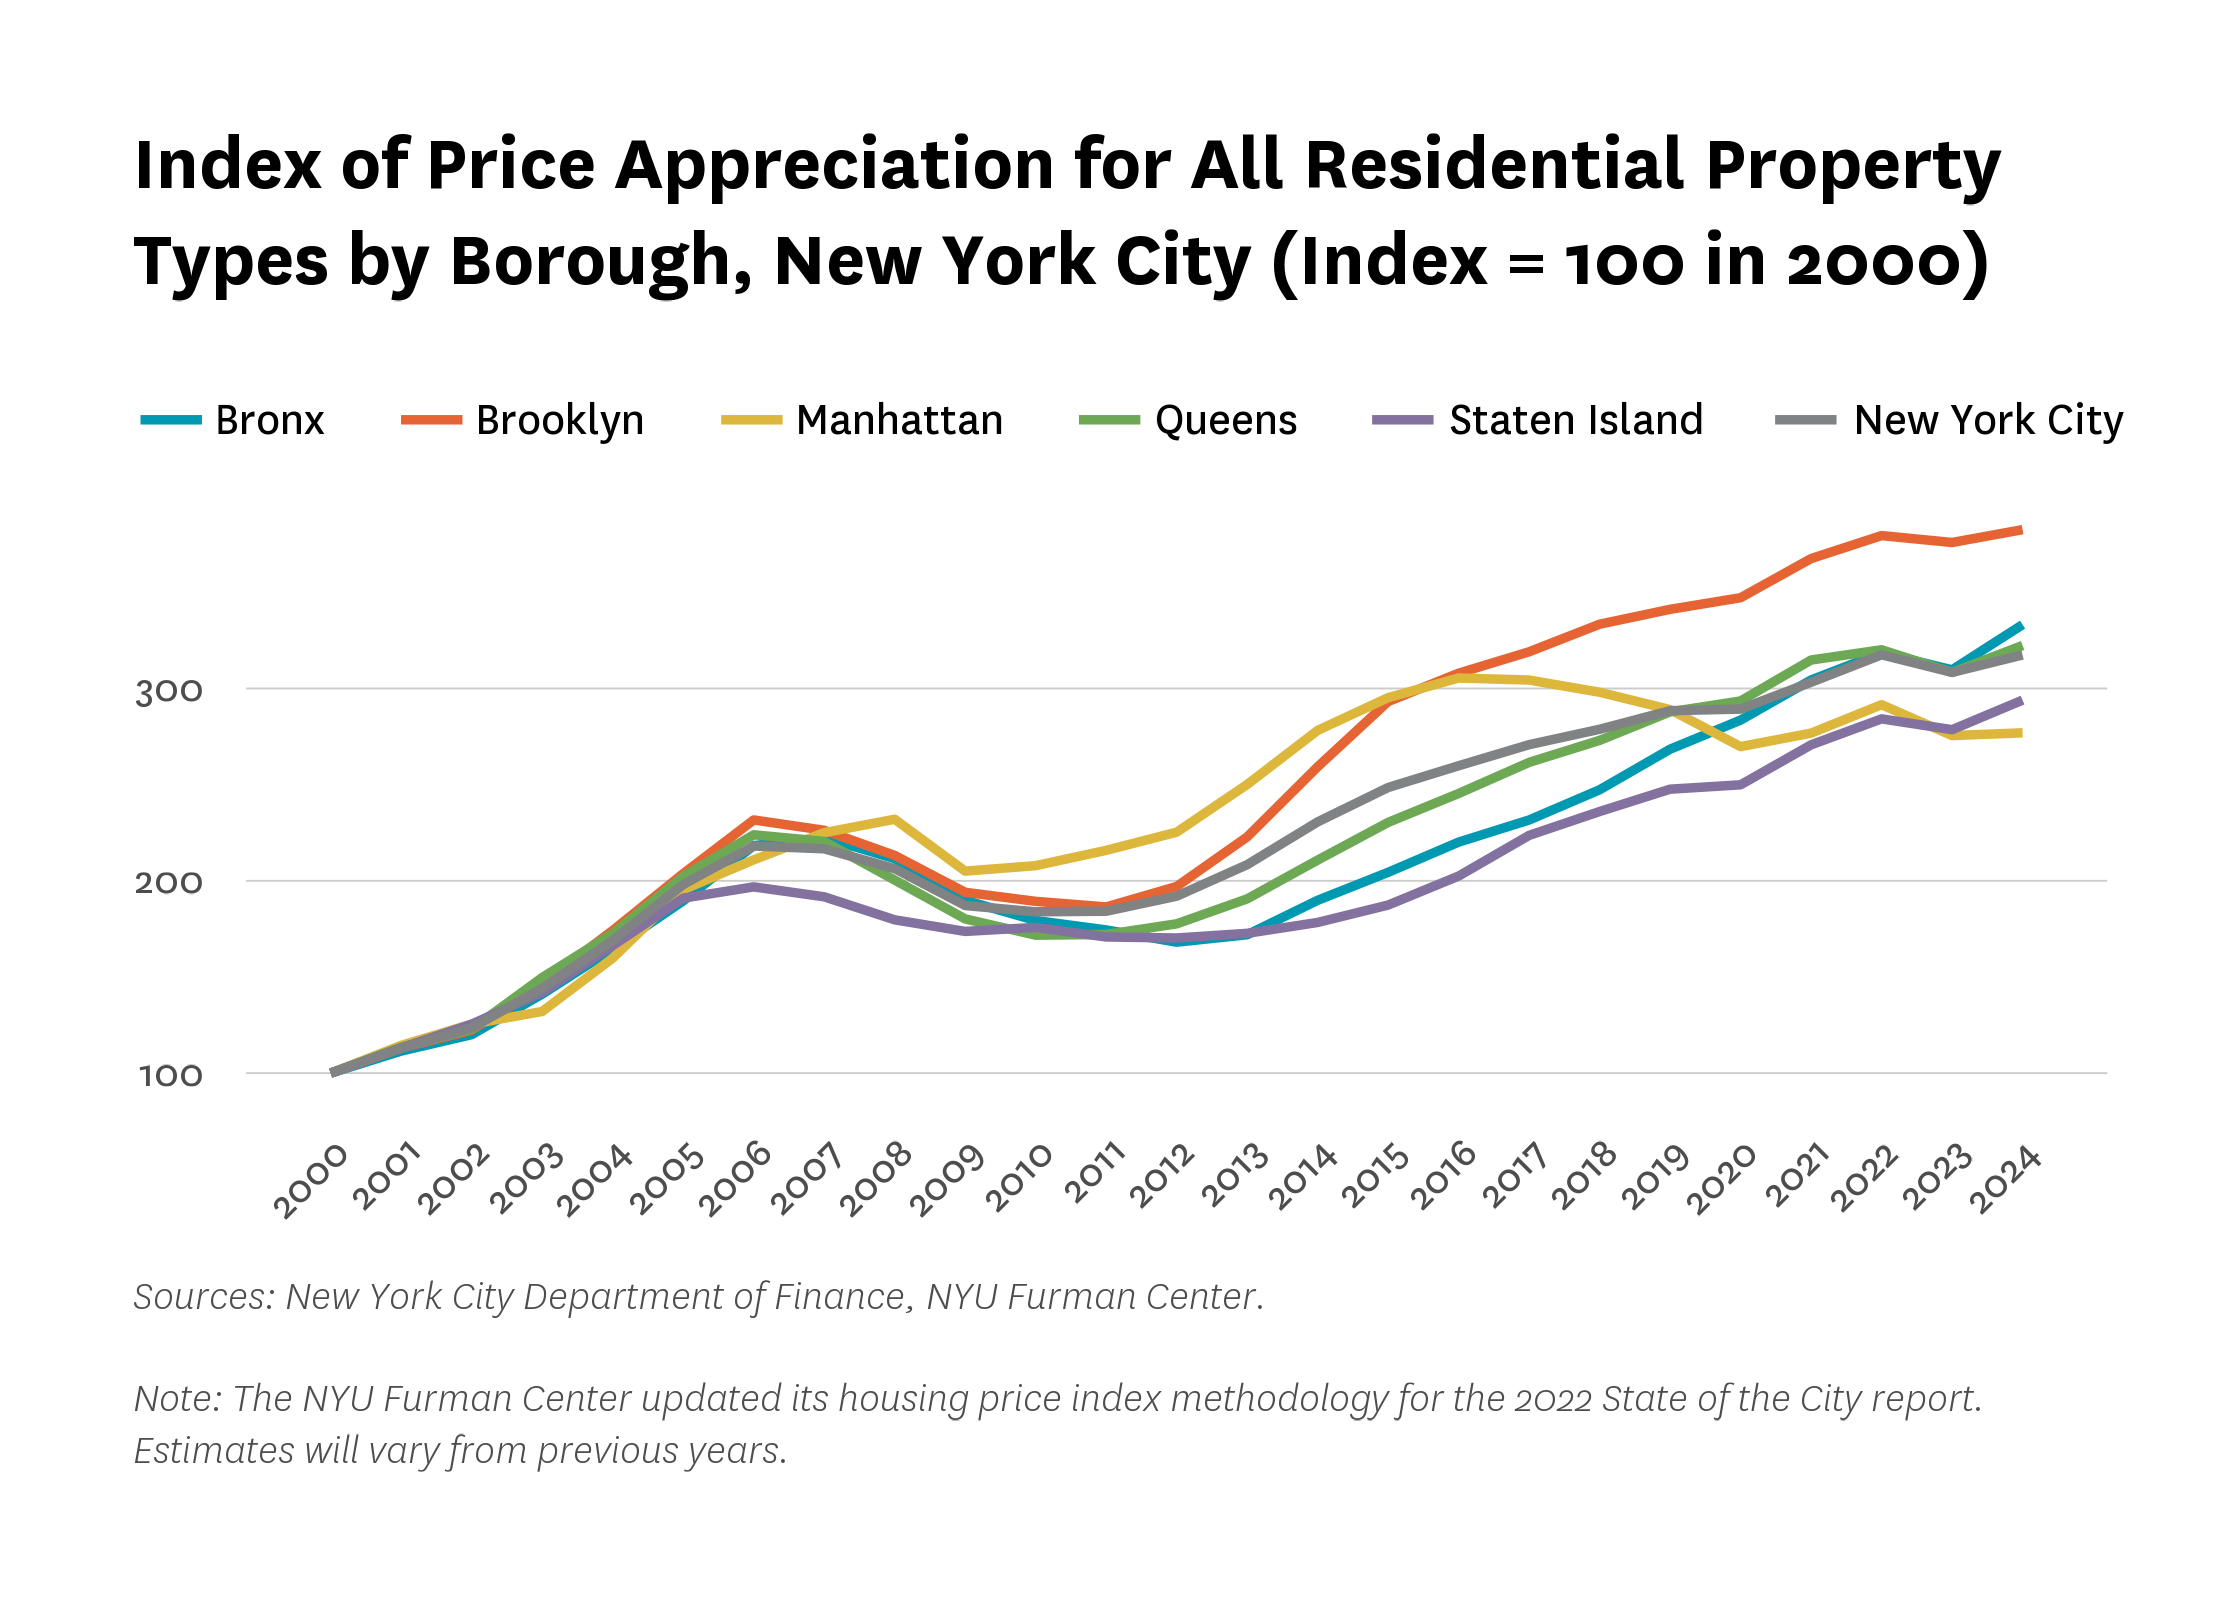
Figure 9:
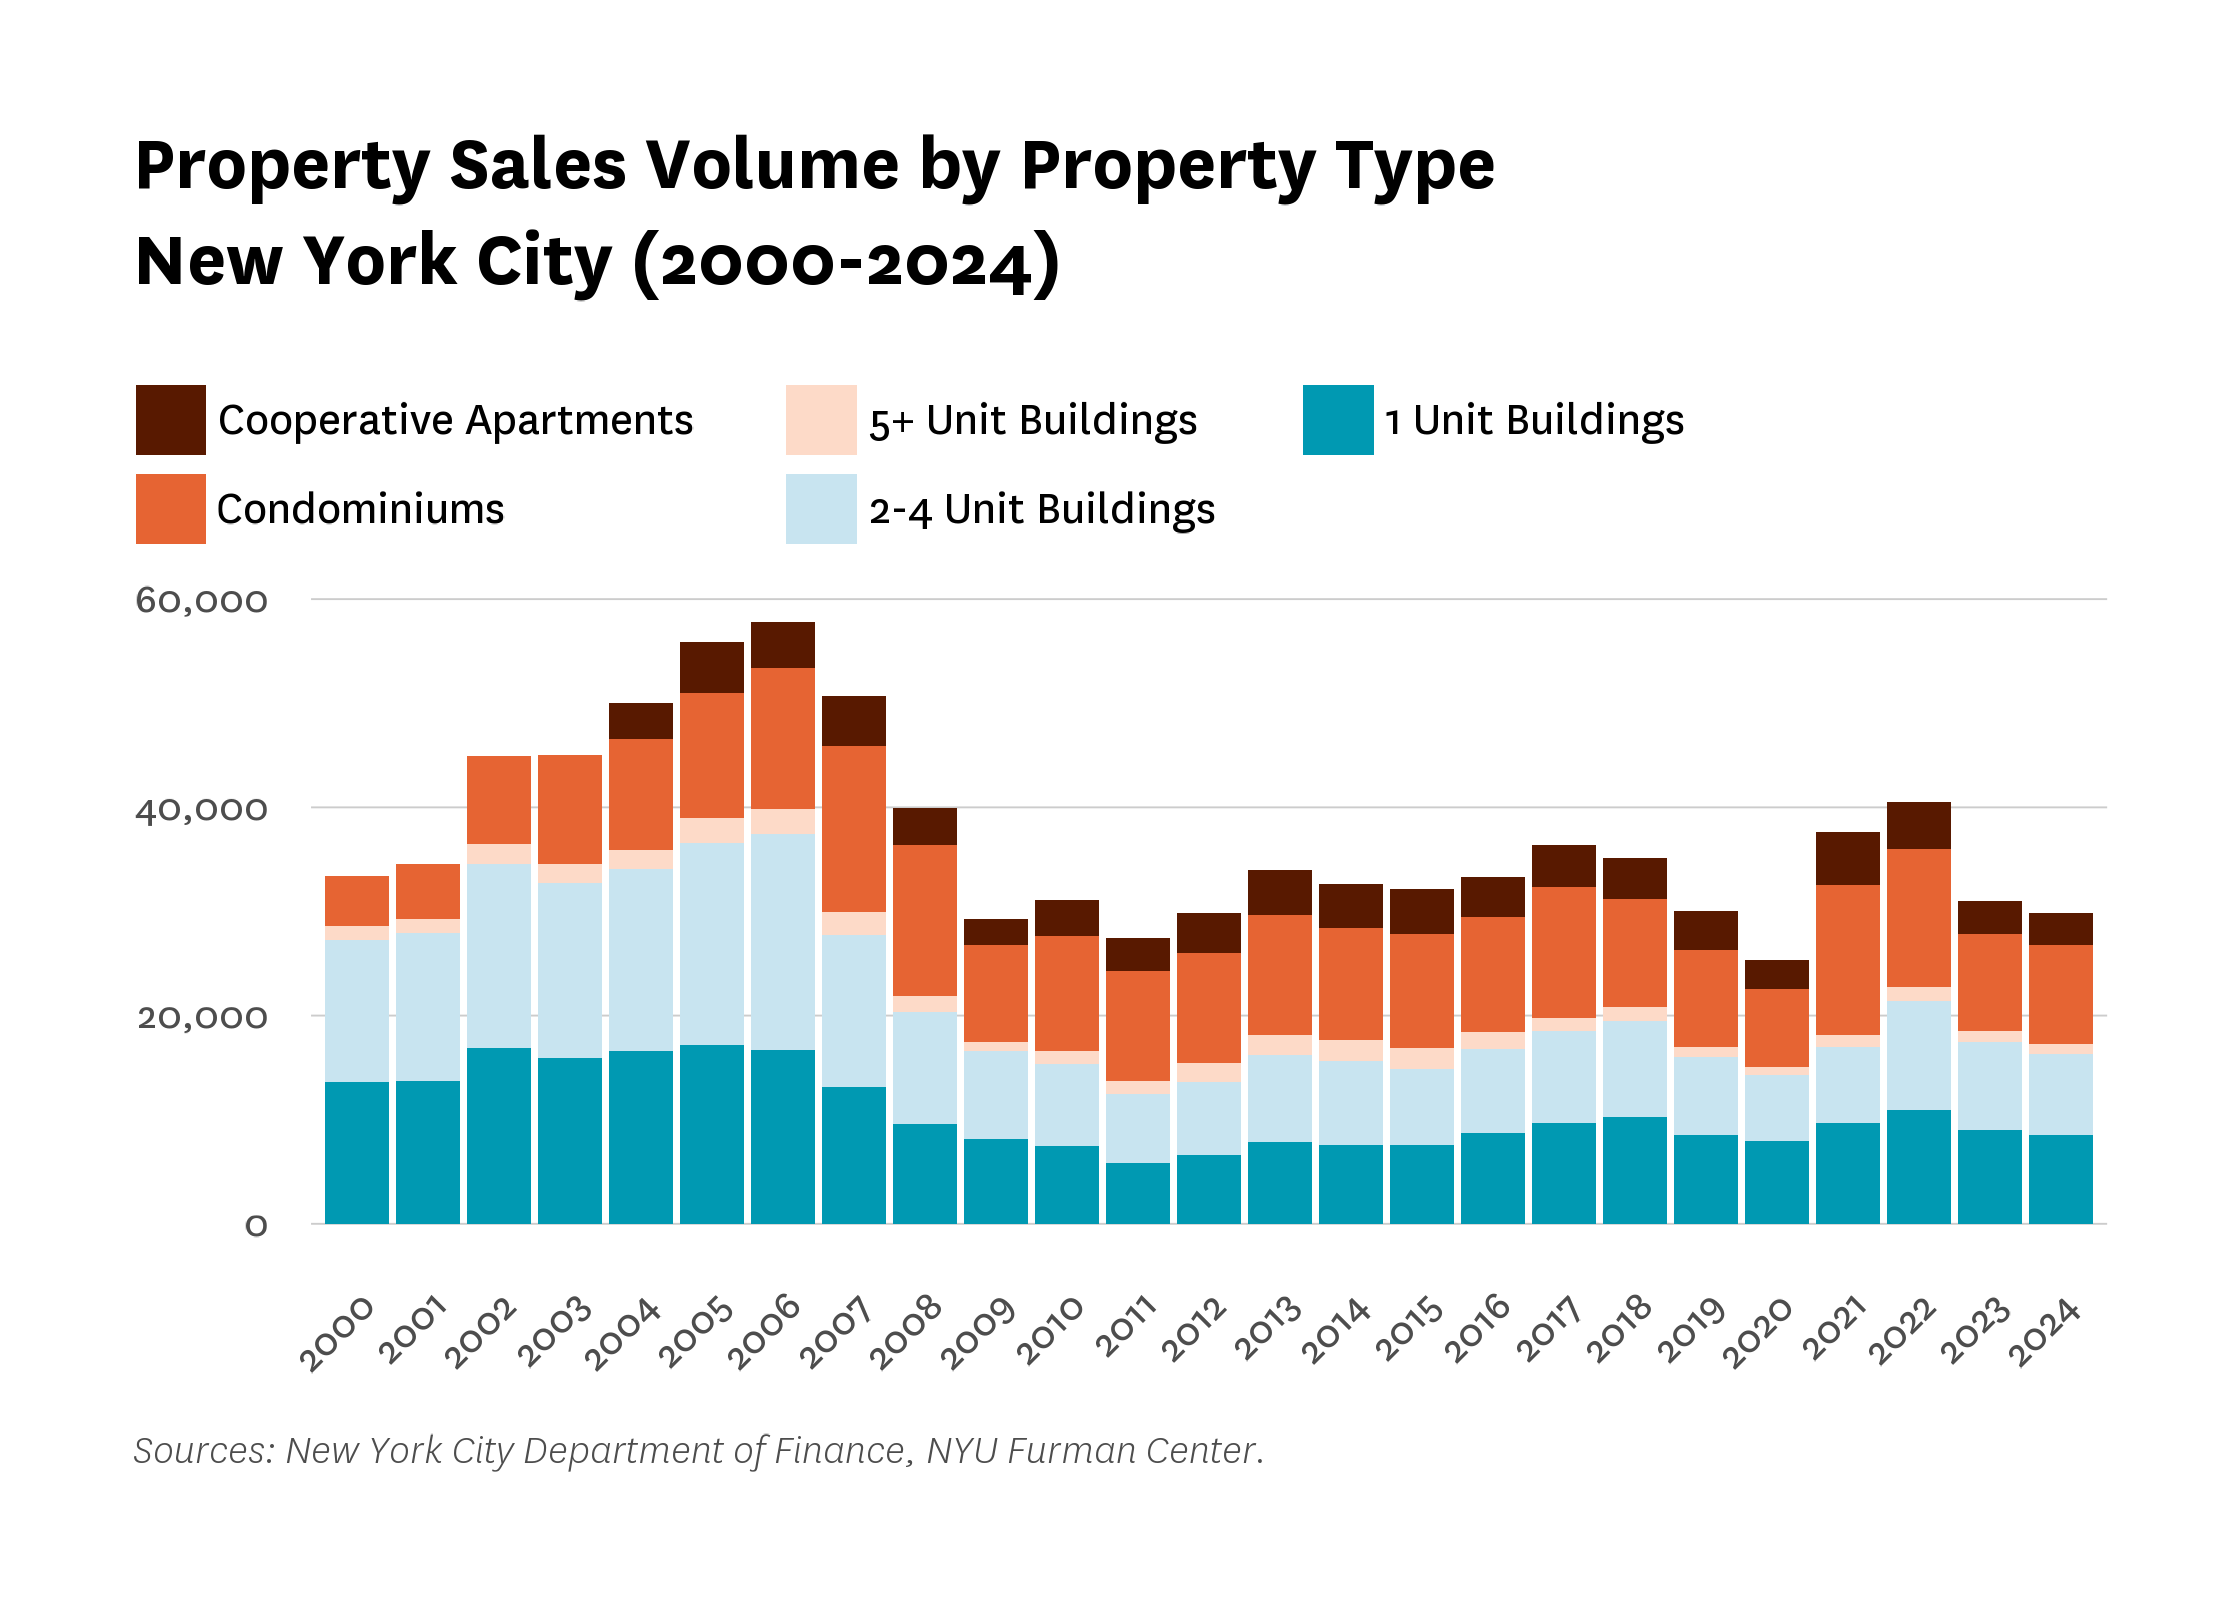
Sales activity also slowed. As shown in Figures 10 and 11, overall residential sales volume declined citywide for the second consecutive year, falling by 3.9 percent between 2023 and 2024. The Bronx experienced the largest year-over-year percent drop in volume. Sales of two- to four-unit homes fell by 9.1 percent citywide, while sales of buildings with five or more units held steady. Total citywide sales volume returned to levels similar to those seen in 2019, before the pandemic.
Figure 10:
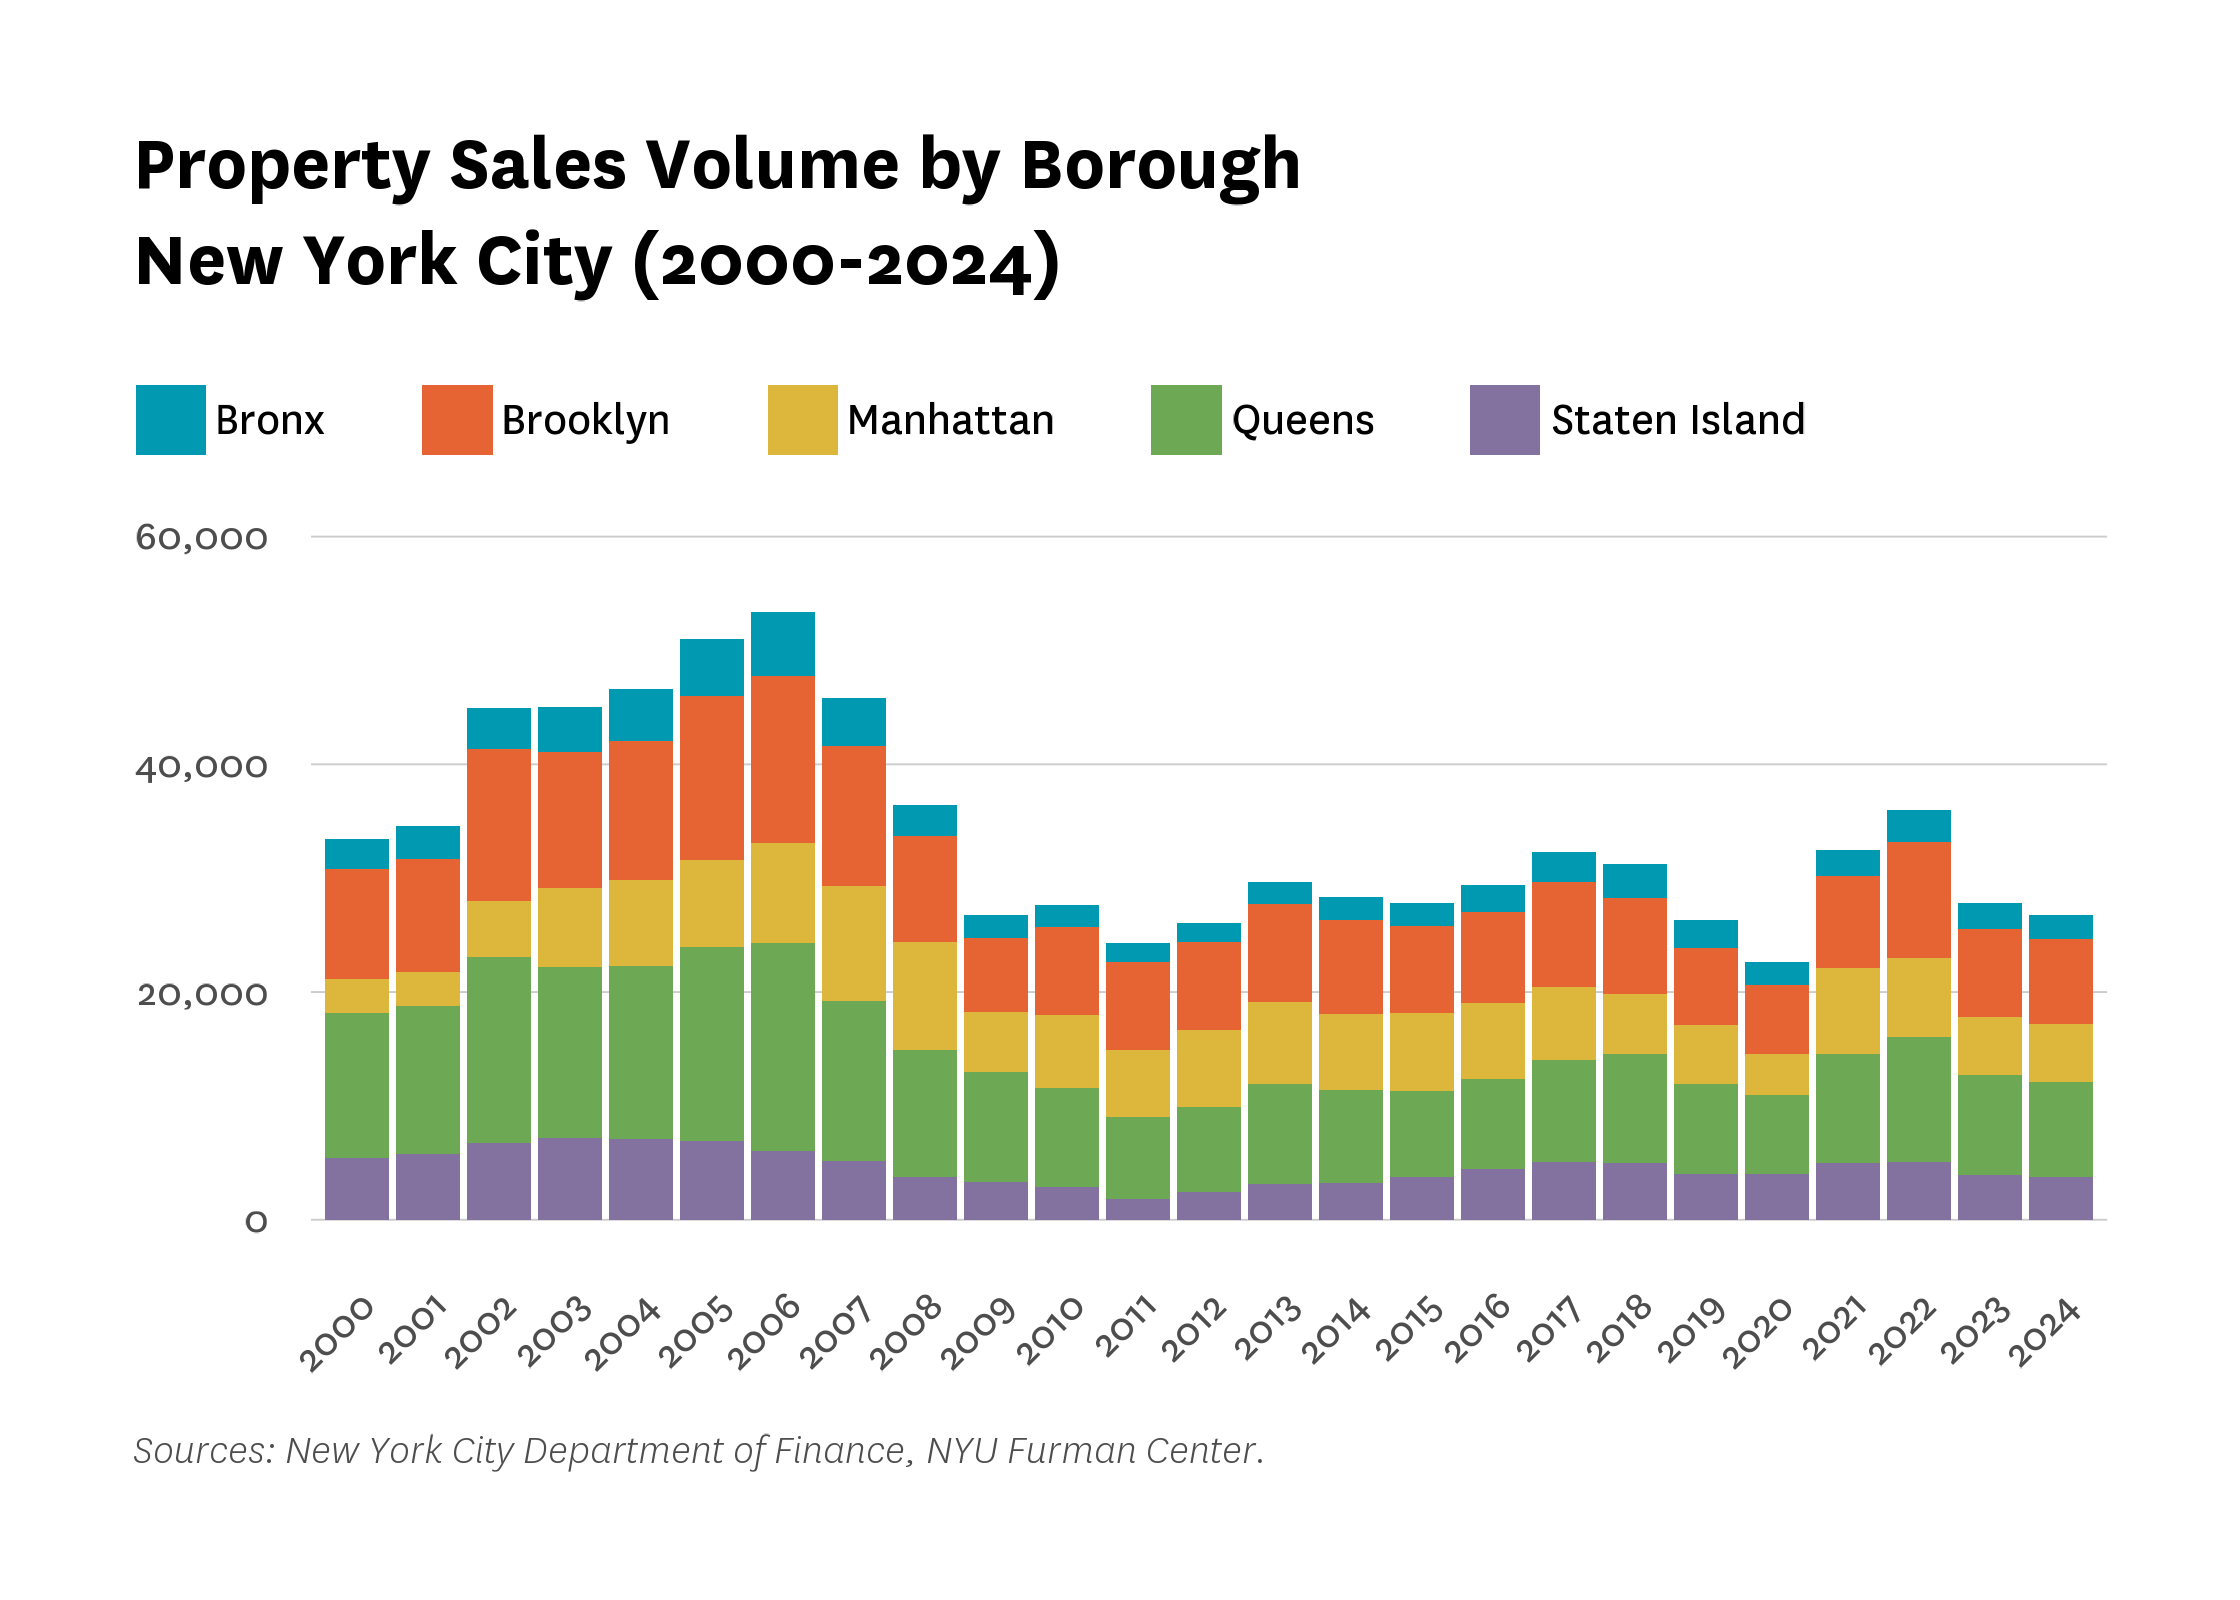
Figure 11:
Although the overall homeownership rate in New York City has remained relatively stable over the past decade, the conditions shaping how households acquire, maintain, and benefit from homeownership have changed substantially. Higher interest rates have made it more difficult for existing homeowners to access built-up equity—evidenced by reduced refinancing and fewer property sales. At the same time, elevated borrowing costs and limited inventory have raised barriers for prospective buyers. While property values have continued to rise, those gains are not necessarily easily realized, contributing to reduced mobility within the market and reinforcing existing disparities. These evolving dynamics warrant continued monitoring, particularly for their implications for affordability, access, and long-term housing stability.
Footnotes
- [1] Freddie Mac. “Mortgage Rates.” https://www.freddiemac.com/pmms