
State of the City’s Housing Stock
Permitting and Completion Trends Across All Building Sizes
In this section, we examine housing production trends across all building sizes—both small-scale homes and larger multifamily buildings. Housing development in New York City reached a pivotal point in 2024. While permitting activity dropped sharply, residential completions surged to their highest annual total since we began tracking this indicator in 2010. These diverging trends reflect the long lead time between permitting and construction and the effects of policy deadlines that shaped development timing.
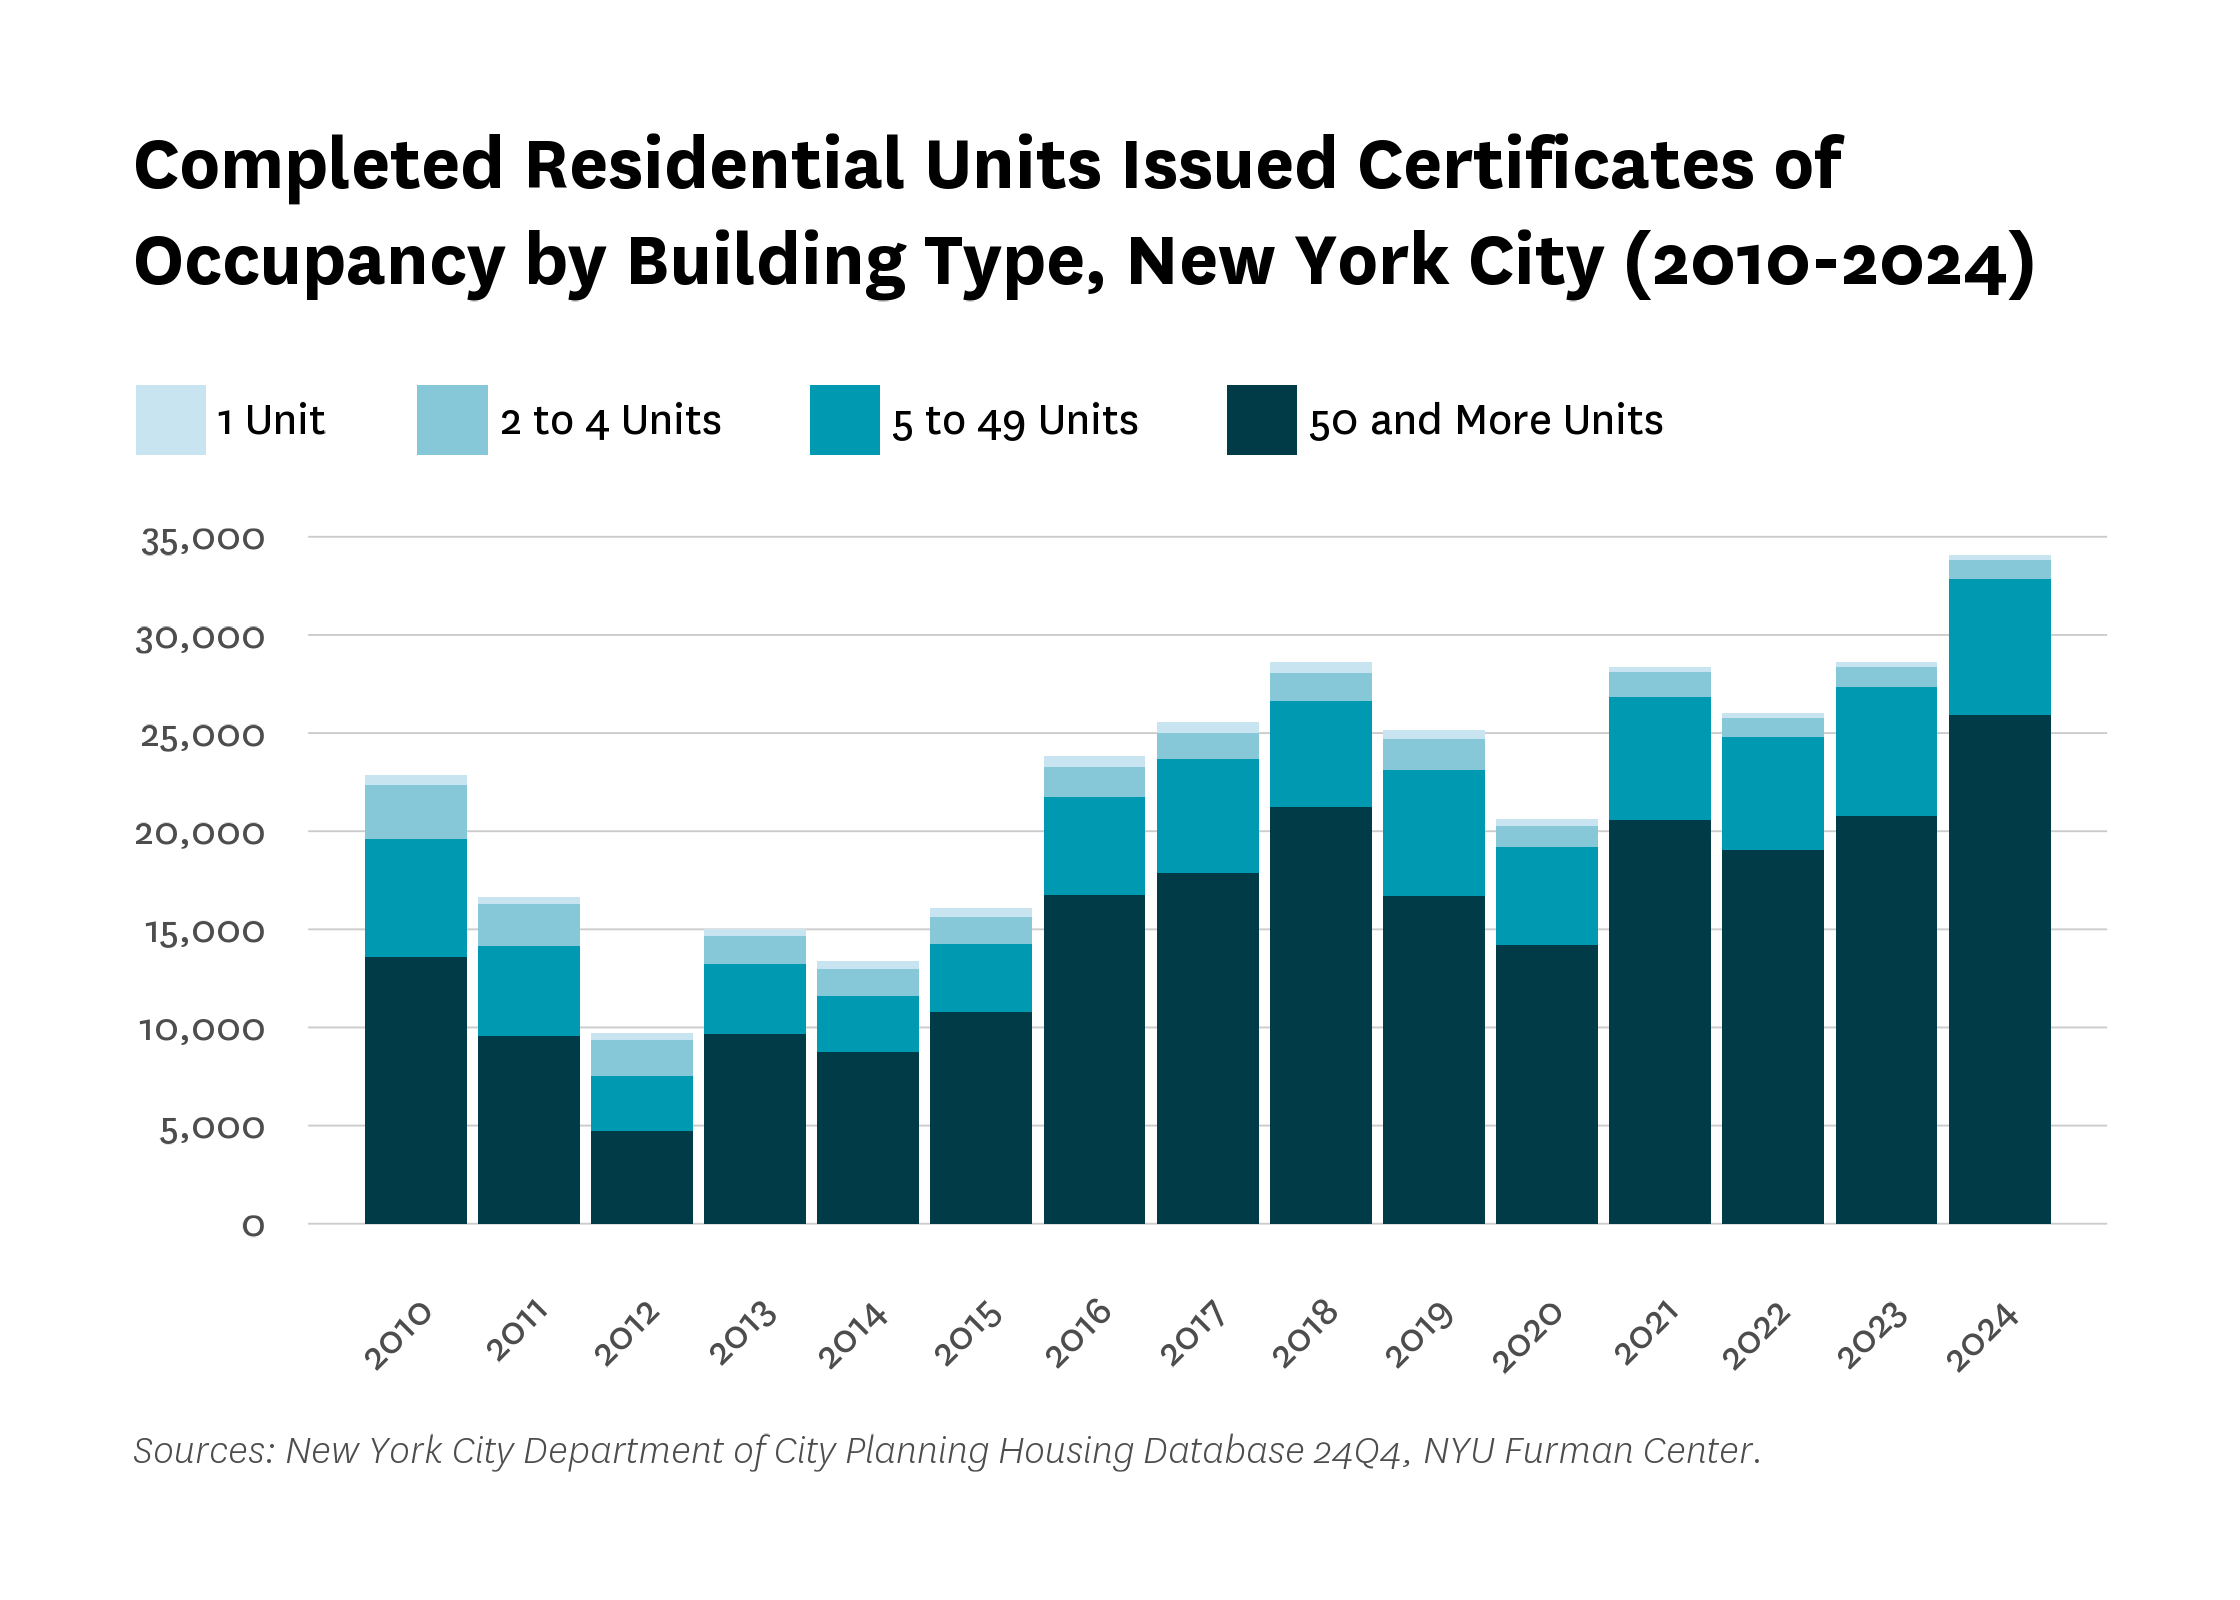
The number of units completed citywide rose to 34,049 in 2024, a 19 percent increase over the prior year and the largest number of completions recorded since at least 2010 (Figure 1). This uptick was driven by projects permitted in 2022, when developers rushed to begin construction before the expiration of the 421-a tax exemption. In 2024, developers faced a legislative deadline –which has now been extended– to finish those projects in order to retain the tax benefit, prompting a wave of completions.
Completions in the 1–4 unit segment—which is ineligible for the 421-a or 485-x programs—remained relatively steady. These small buildings made up a modest share of total completions, and their development appears less affected by the incentive-driven timelines shaping larger multifamily construction.
Figure 1:
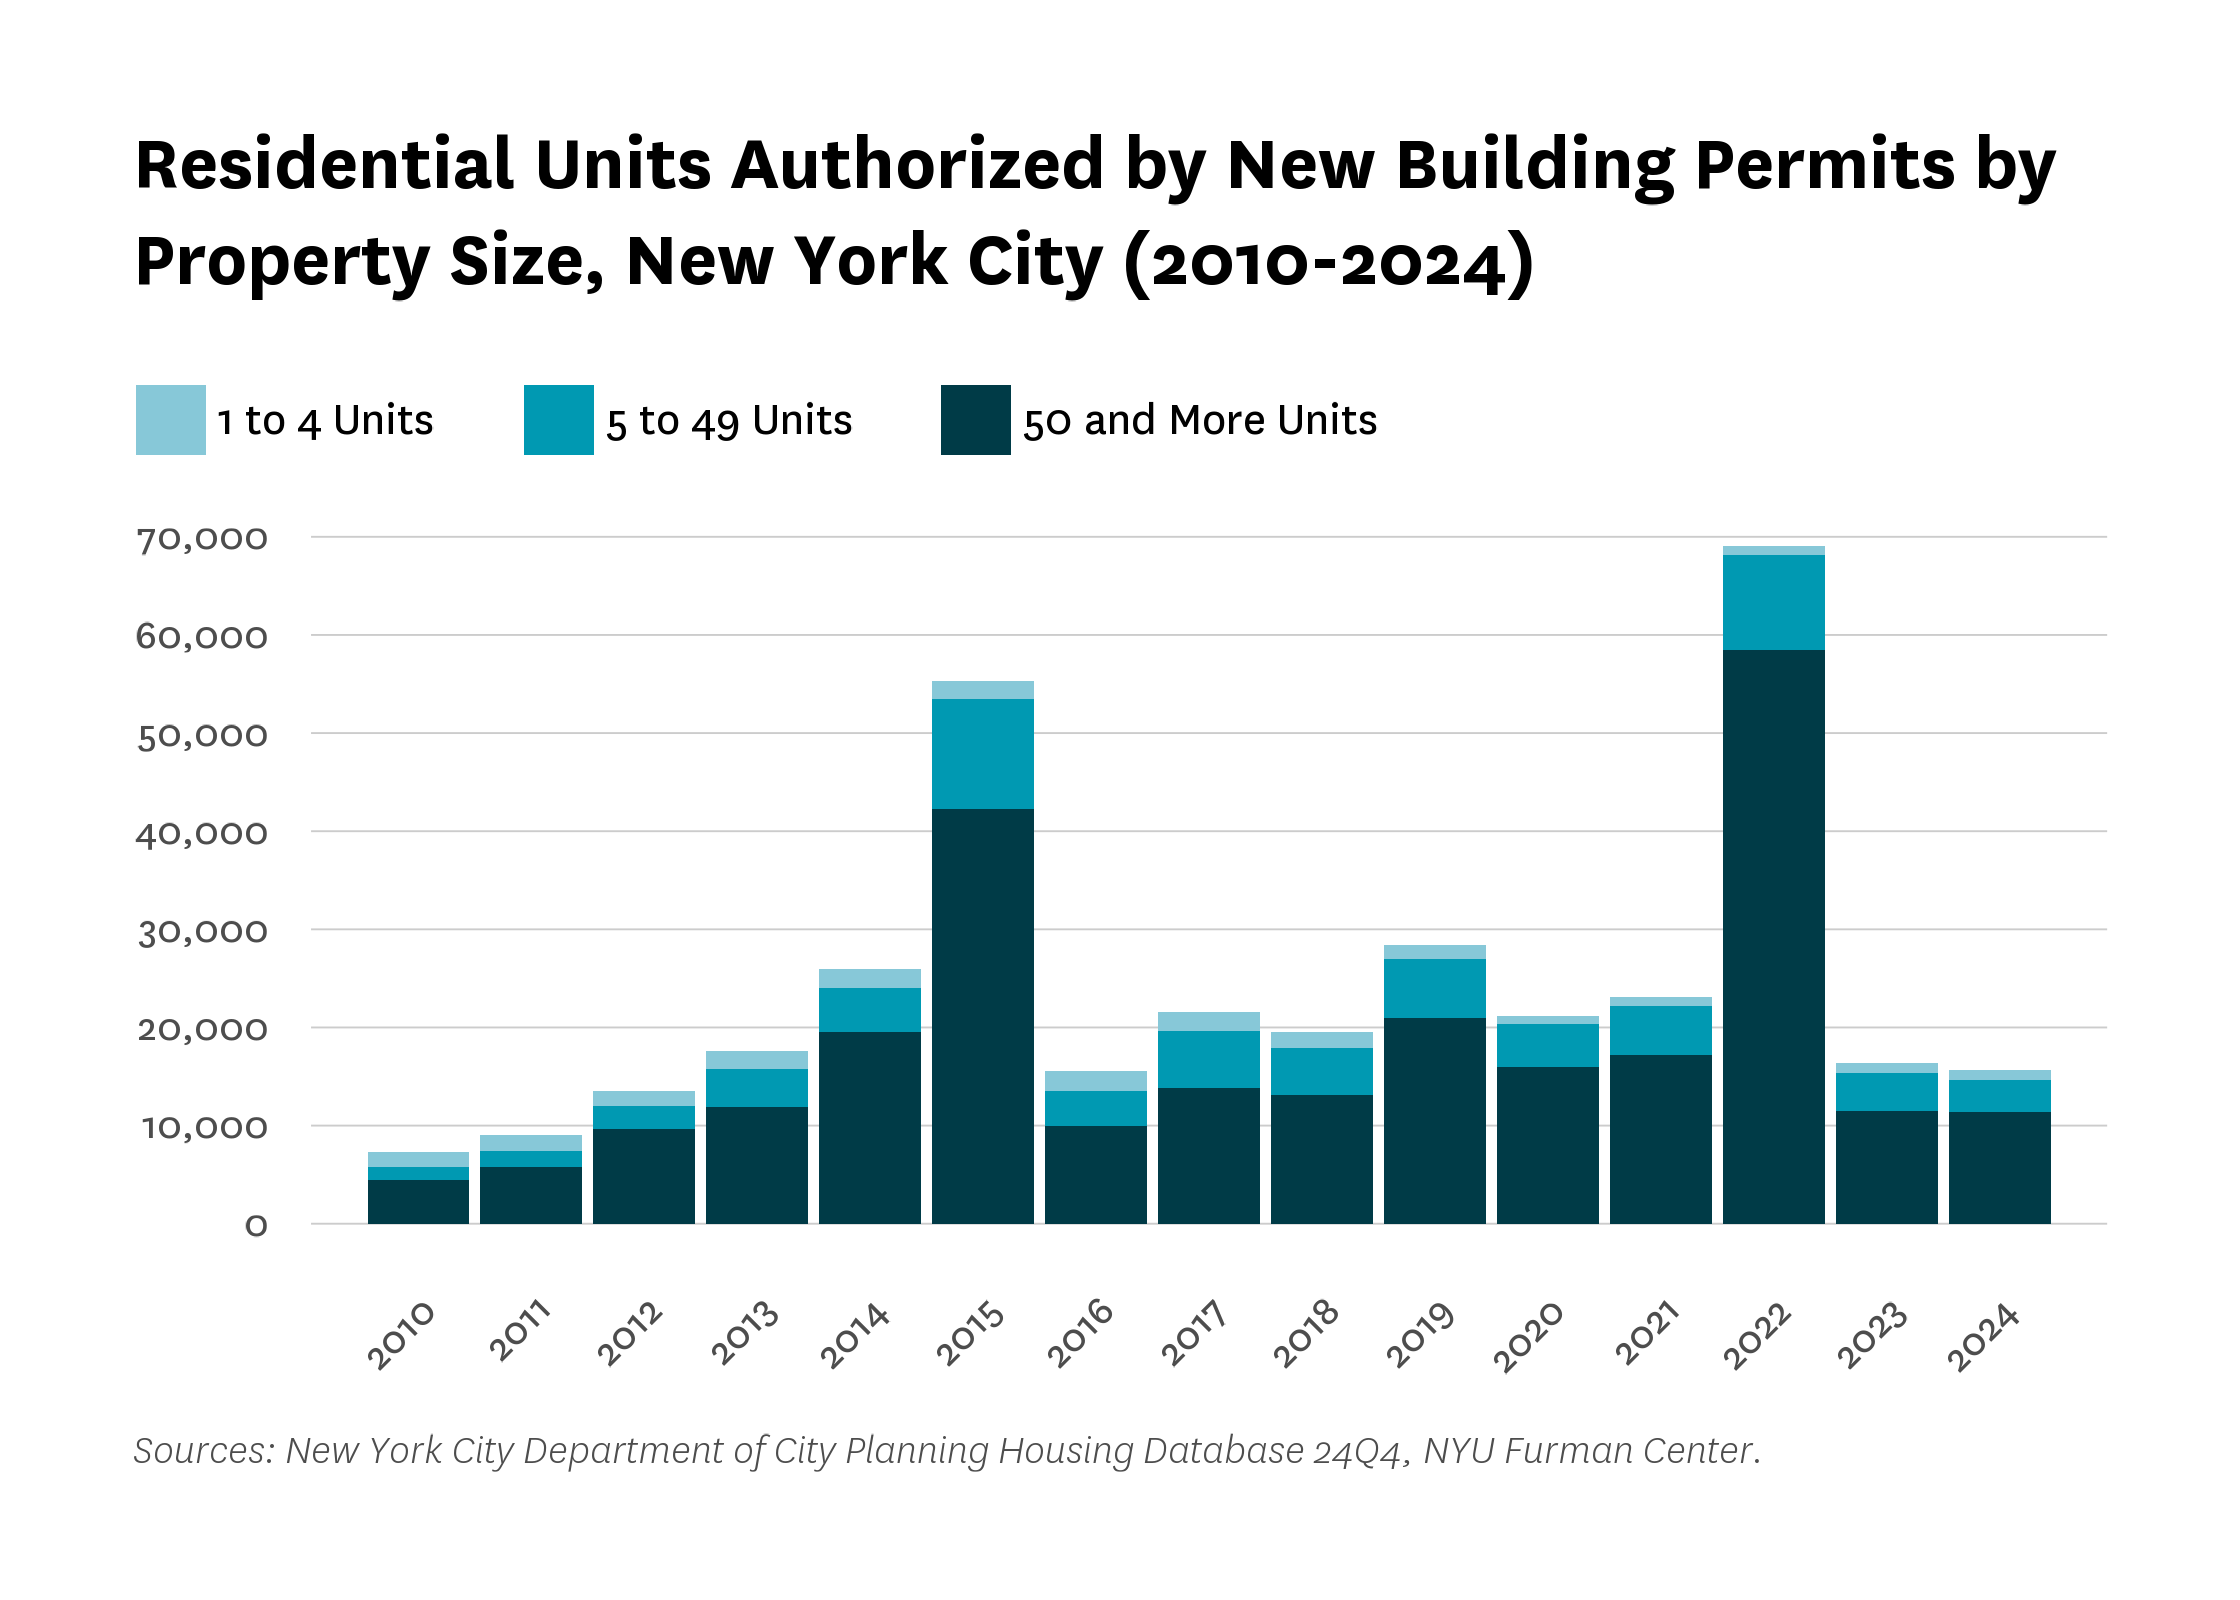
At the same time, permitting activity fell for the second consecutive year. Just 15,626 units were authorized in 2024—a 4.8 percent drop from 2023 and a 77 percent decline from the 2022 peak (Figure 2). Most of the units in newly permitted housing developments continued to be in large-scale developments, with 50+ unit buildings accounting for nearly three-quarters of the total. While part of this decline reflects the leveling out of the 2022 permitting spike, the absence of a replacement for 421-a until mid-2024 likely contributed to continued hesitation in new project starts.
Figure 2:
Looking ahead, the trajectory of new residential development will depend on how quickly the market responds to the newly enacted 485-x program and whether broader zoning reforms under the City of Yes make more projects financially feasible. More completions from the 2022 permit cohort are likely in 2025, given the large number of permits issued that year and the typical length of the construction process. In addition, the city is likely to see an increase in office-to-residential conversions through the 467-m tax incentive program, which has the potential to contribute a meaningful share of future housing supply. Nonetheless, permitting data suggest it is unlikely the city will return to the production levels seen in recent years in the next few years, pointing to a likely slowdown in multifamily construction.
Affordable Housing as a Share of New Multifamily (4+ Unit) Construction
While the above figures describe overall production trends, the following section looks more closely at how much of this new housing has been income-restricted. In this section, we focus on multifamily buildings with four or more units—the segment where most income-restricted housing is built.
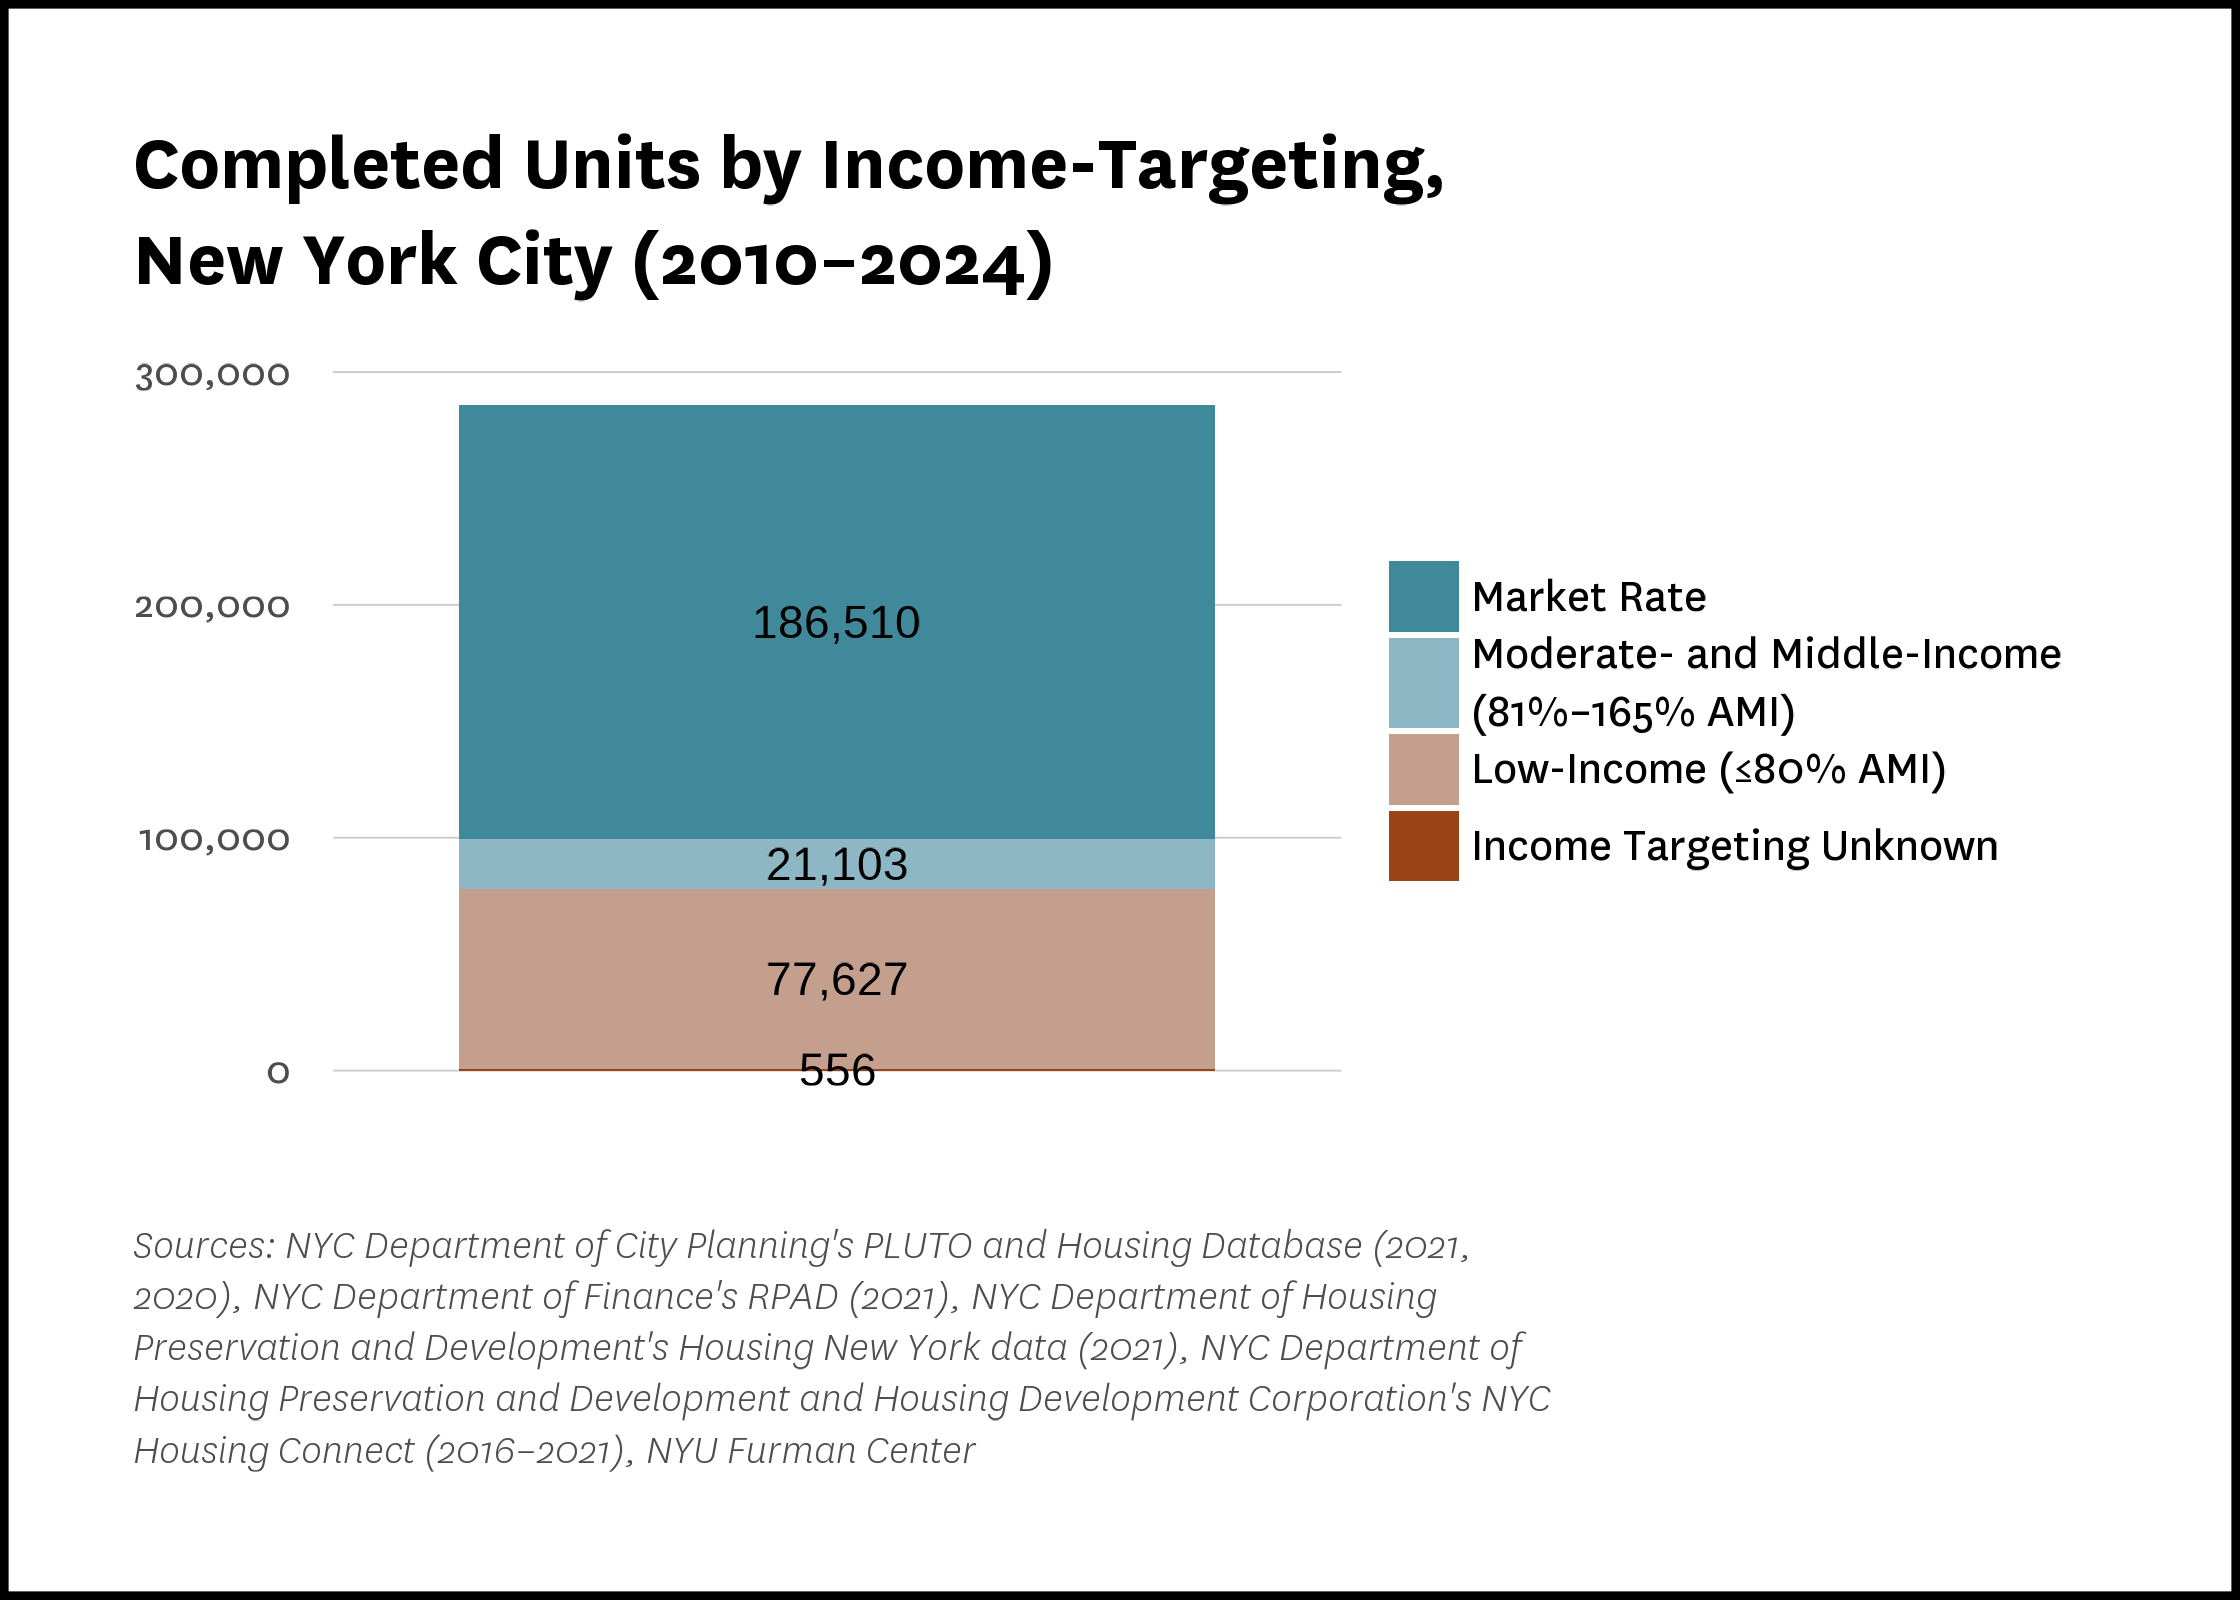
Between 2010 and 2024, 285,796 multifamily units were completed in New York City. Of those, an estimated 77,627 units (27.1 percent) were income-restricted and targeted to low-income households earning up to 80 percent of Area Median Income (AMI). An additional 21,103 units (7.4 percent) were targeted to moderate- and middle-income households earning between 81 and 165 percent of AMI. The remaining 186,510 units (65.2 percent) were market-rate, with a small number—556 units (0.2 percent)—having unknown income targeting (Figure 3). This share is calculated from multifamily (4+ unit) completions, not from all housing production.
These figures should be viewed as provisional, particularly for the most recent year. Because our methodology relies on identifying the underlying tax benefits or subsidies used in a development—and that information often lags behind physical completion—the share of income-restricted units in 2024 may rise over time as additional data becomes available.
Figure 3:
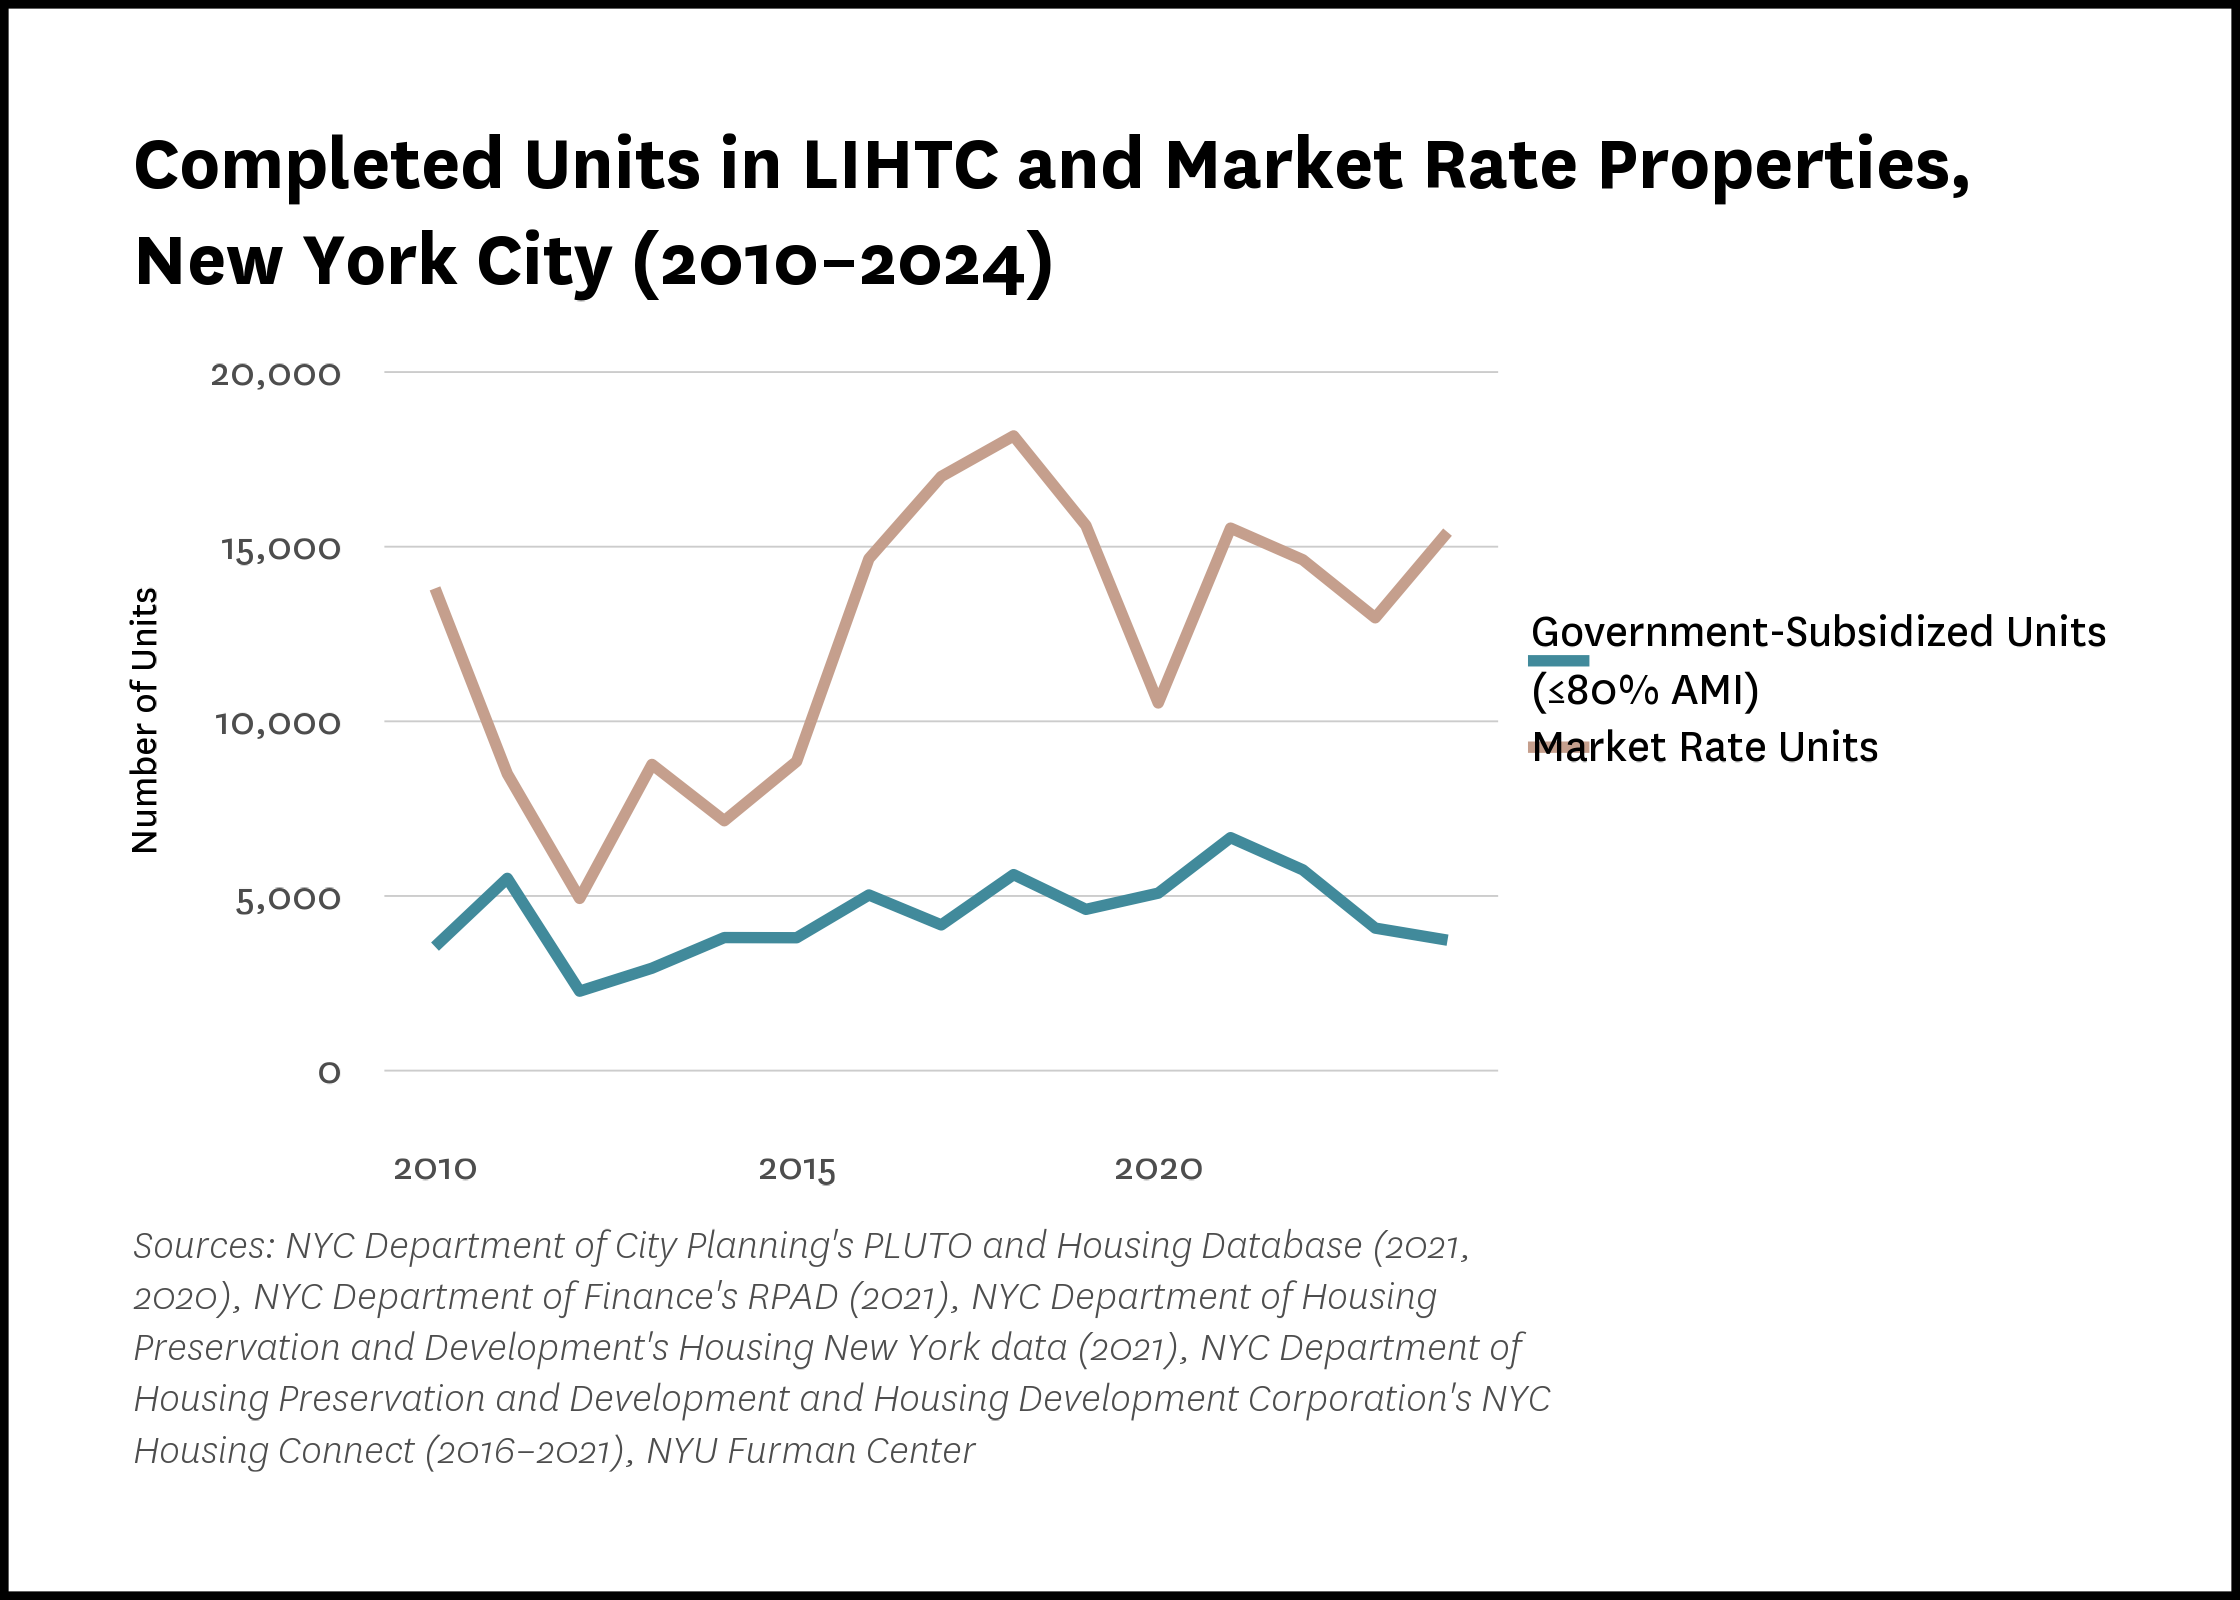
Trends show that income-restricted construction remained relatively steady over this same period, while market-rate development fluctuated more substantially in response to economic and policy shifts (Figure 4).
Figure 4:
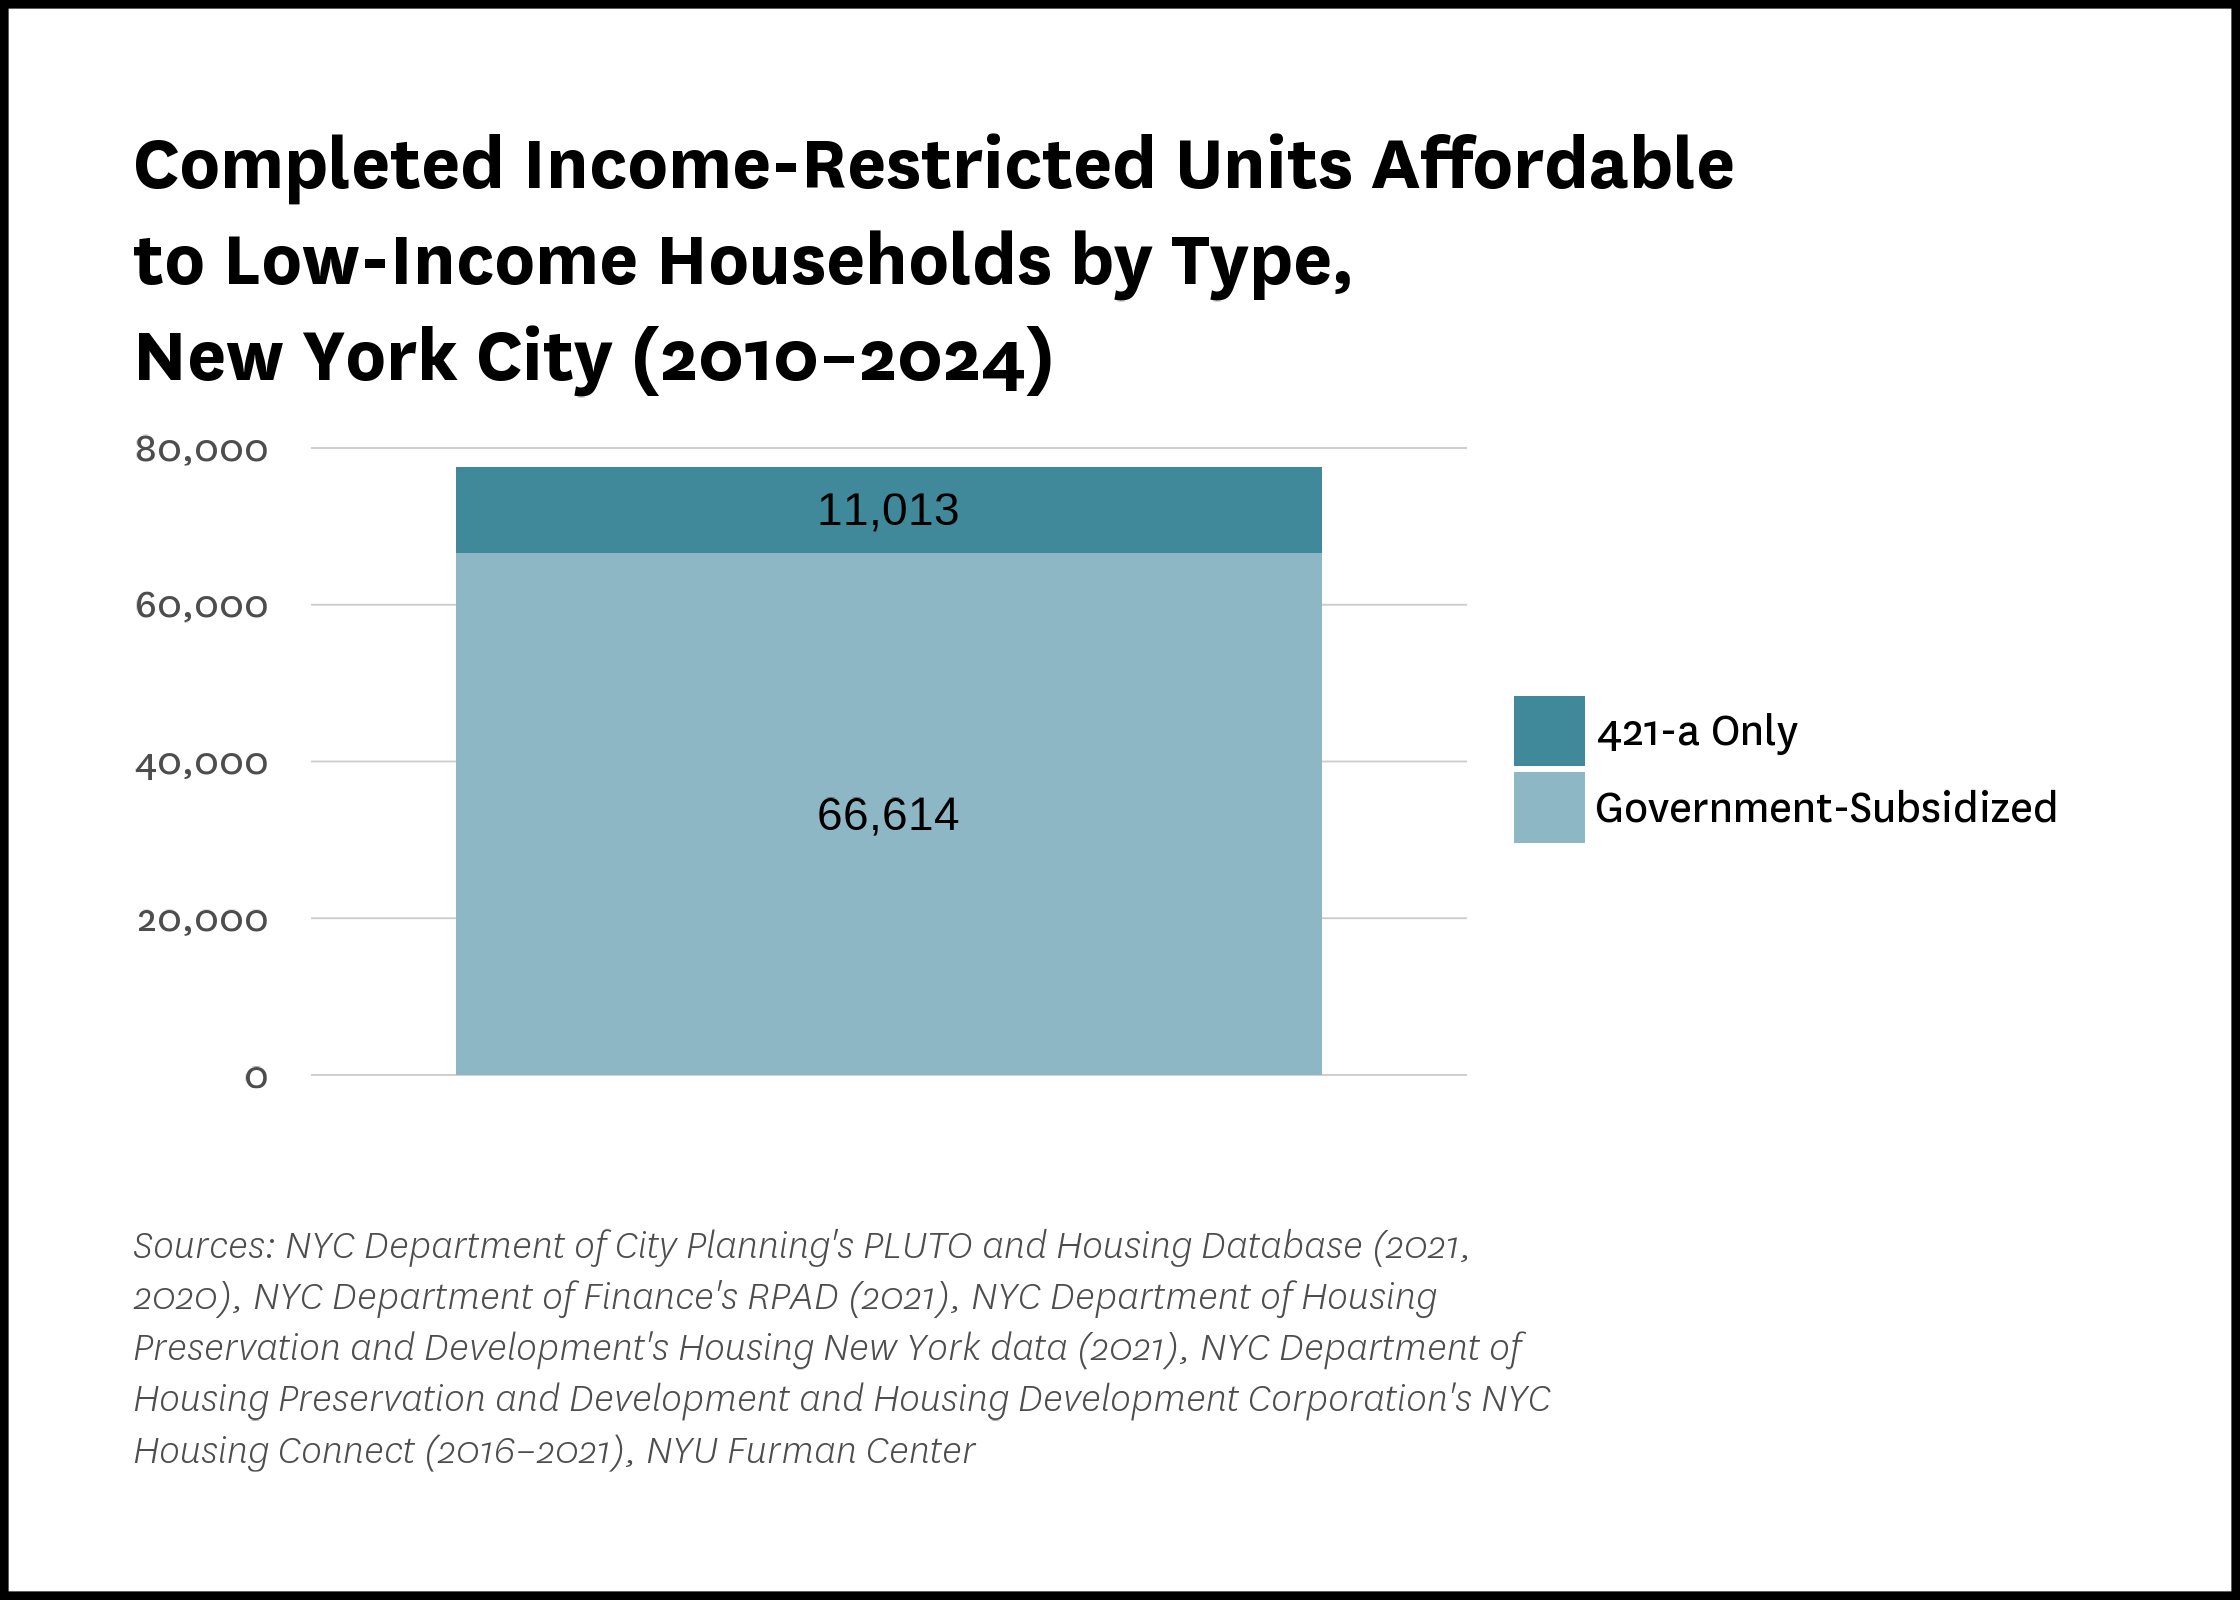
Of the 77,627 low-income units completed, the vast majority—66,614 units, or 85.8 percent—were built in developments that received direct government subsidy. The remaining 11,013 units (14.2 percent) were delivered using the 421-a tax exemption alone, without any additional public subsidy. In Manhattan, the reliance on 421-a alone was particularly pronounced: 23.5 percent of the borough’s low-income multifamily units were built without another subsidy (Figure 5).
Figure 5:
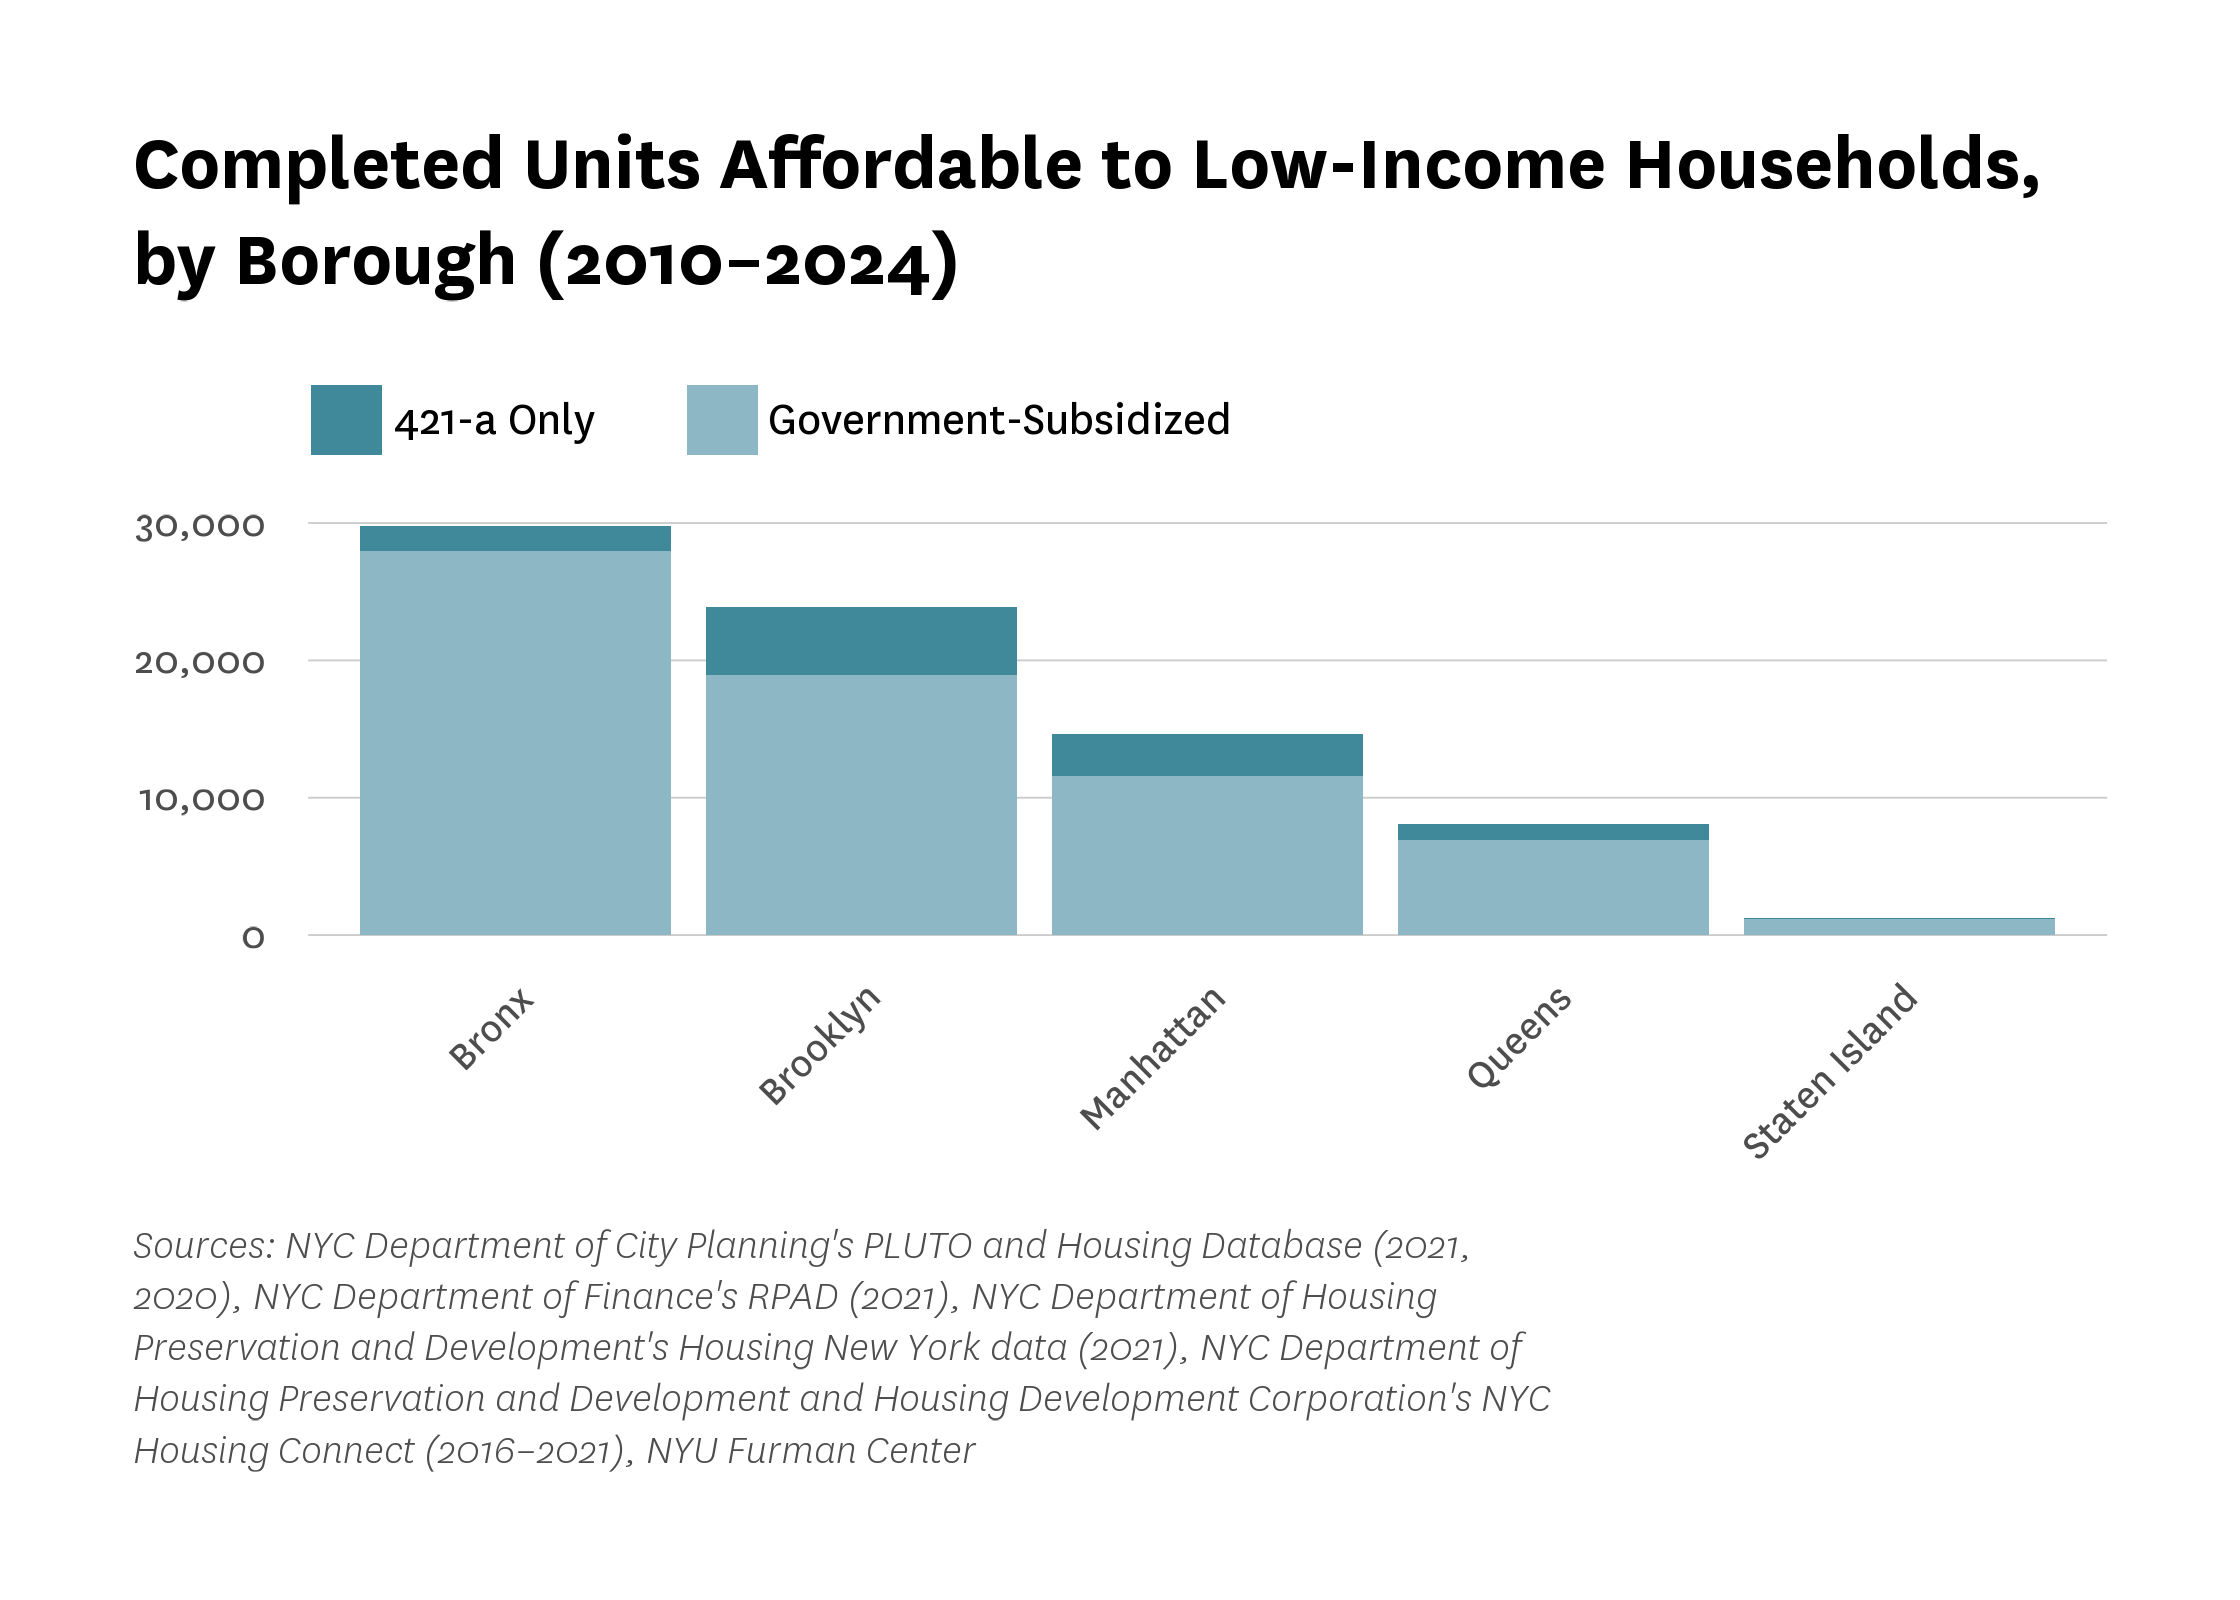
The total production of low-income housing varied across boroughs. The Bronx added the most such units—27,984 in subsidized projects and 1,824 via 421-a alone—totaling over 29,800 units. Brooklyn followed with roughly 23,884 (18,914 subsidized and 4,970 through 421-a only), and Manhattan produced about 14,620 (11,582 subsidized, 3,040 421-a only). Queens added approximately 8,084 units, and Staten Island just over 1,200 (Figure 6).
Figure 6:
2024 saw the highest number of housing unit completions since we began tracking this indicator in 2010. Over the full 2010–2024 period, New York City added approximately 335,000 new housing units across all building sizes—a substantial increase in the housing stock. But rather than signaling a new norm, the 2024 spike largely reflects the timing of legislative deadlines in state law. Some completions that might have occurred in future years were likely expedited. In contrast, permitting data—which indicate future completions—suggest that the city is unlikely to return to the production levels seen in recent years in the next few years, pointing instead to a likely slowdown in multifamily construction.
During that same period, more than 77,000 income-restricted units targeted to low-income households were completed in multifamily buildings with 4 or more units, accounting for approximately 27 percent of total multifamily (4+ unit) completions—not of all housing produced citywide. While this production held relatively steady year to year, it remained heavily reliant on public subsidy and varied across neighborhoods.
As the city and state look to new tools like 485-x, 467-m, and the City of Yes, the extent to which these programs can support adequate, sustained, and geographically inclusive housing production—particularly at lower income levels—will be important to watch.
For more detailed information on affordable housing development by neighborhood, see our community district profiles.