Data Brief: Government-Subsidized, Income-Restricted Rent-Stabilized Properties

This data brief covers the second of the two subsegments of New York City’s rent-stabilized housing that provide homes affordable to lower income households but face heightened risks of physical and financial strain if net operating income fails to keep up with rising expenses. It builds on our Overview Brief, which situates rent-stabilized homes within the overall housing ecosystem of New York City. Here, we focus on government-subsidized, income-restricted housing.
What are “Government-Subsidized, Income-Restricted Properties”?
We use the term to describe properties that include both pre-1974 and post-1973 developments that came under rent stabilization by choosing to participate in public financing or tax benefit programs that require affordability restrictions. Owners of buildings in this subset of the rent-stabilized stock include non-profit and for-profit organizations.
These properties were typically financed with a number of City and State affordable housing programs, 1 along with the federal Low-Income Housing Tax Credit (LIHTC). They are governed by regulatory agreements with the City and/or State that set initial rents at levels affordable to households meeting specified income thresholds and generally require that rents increase by the lesser of the annual allowable Rent Guidelines Board (RGB) increase or the change in the Area Median Income (AMI) level targeted by the regulatory agreement.
Because apartments in these buildings are reserved for low- and moderate-income households, they have no offsetting unrestricted market-rate units to cushion revenue losses when regulated rents grow more slowly than operating expenses. This structure means the financial condition of these buildings depends almost entirely on regulated rents keeping pace with rising operating costs.
Where are Government-Subsidized, Income-Restricted Properties Located?
Government-subsidized, income-restricted buildings are home to 183,385 rent-stabilized units, and account for 11 percent of New York City’s rent-regulated properties. 2 Rent-stabilized units in this category are concentrated in the South Bronx, Central and East Harlem, and parts of outer Brooklyn (Figure 1). In contrast, rent-stabilized units across the full rent-stabilized stock are more common along the western edge of Brooklyn and Queens, including Astoria, Woodside/Sunnyside, and Greenpoint/Williamsburg.
Figure 1:
The Typical Unit Count of Government-Subsidized, Income-Restricted Properties
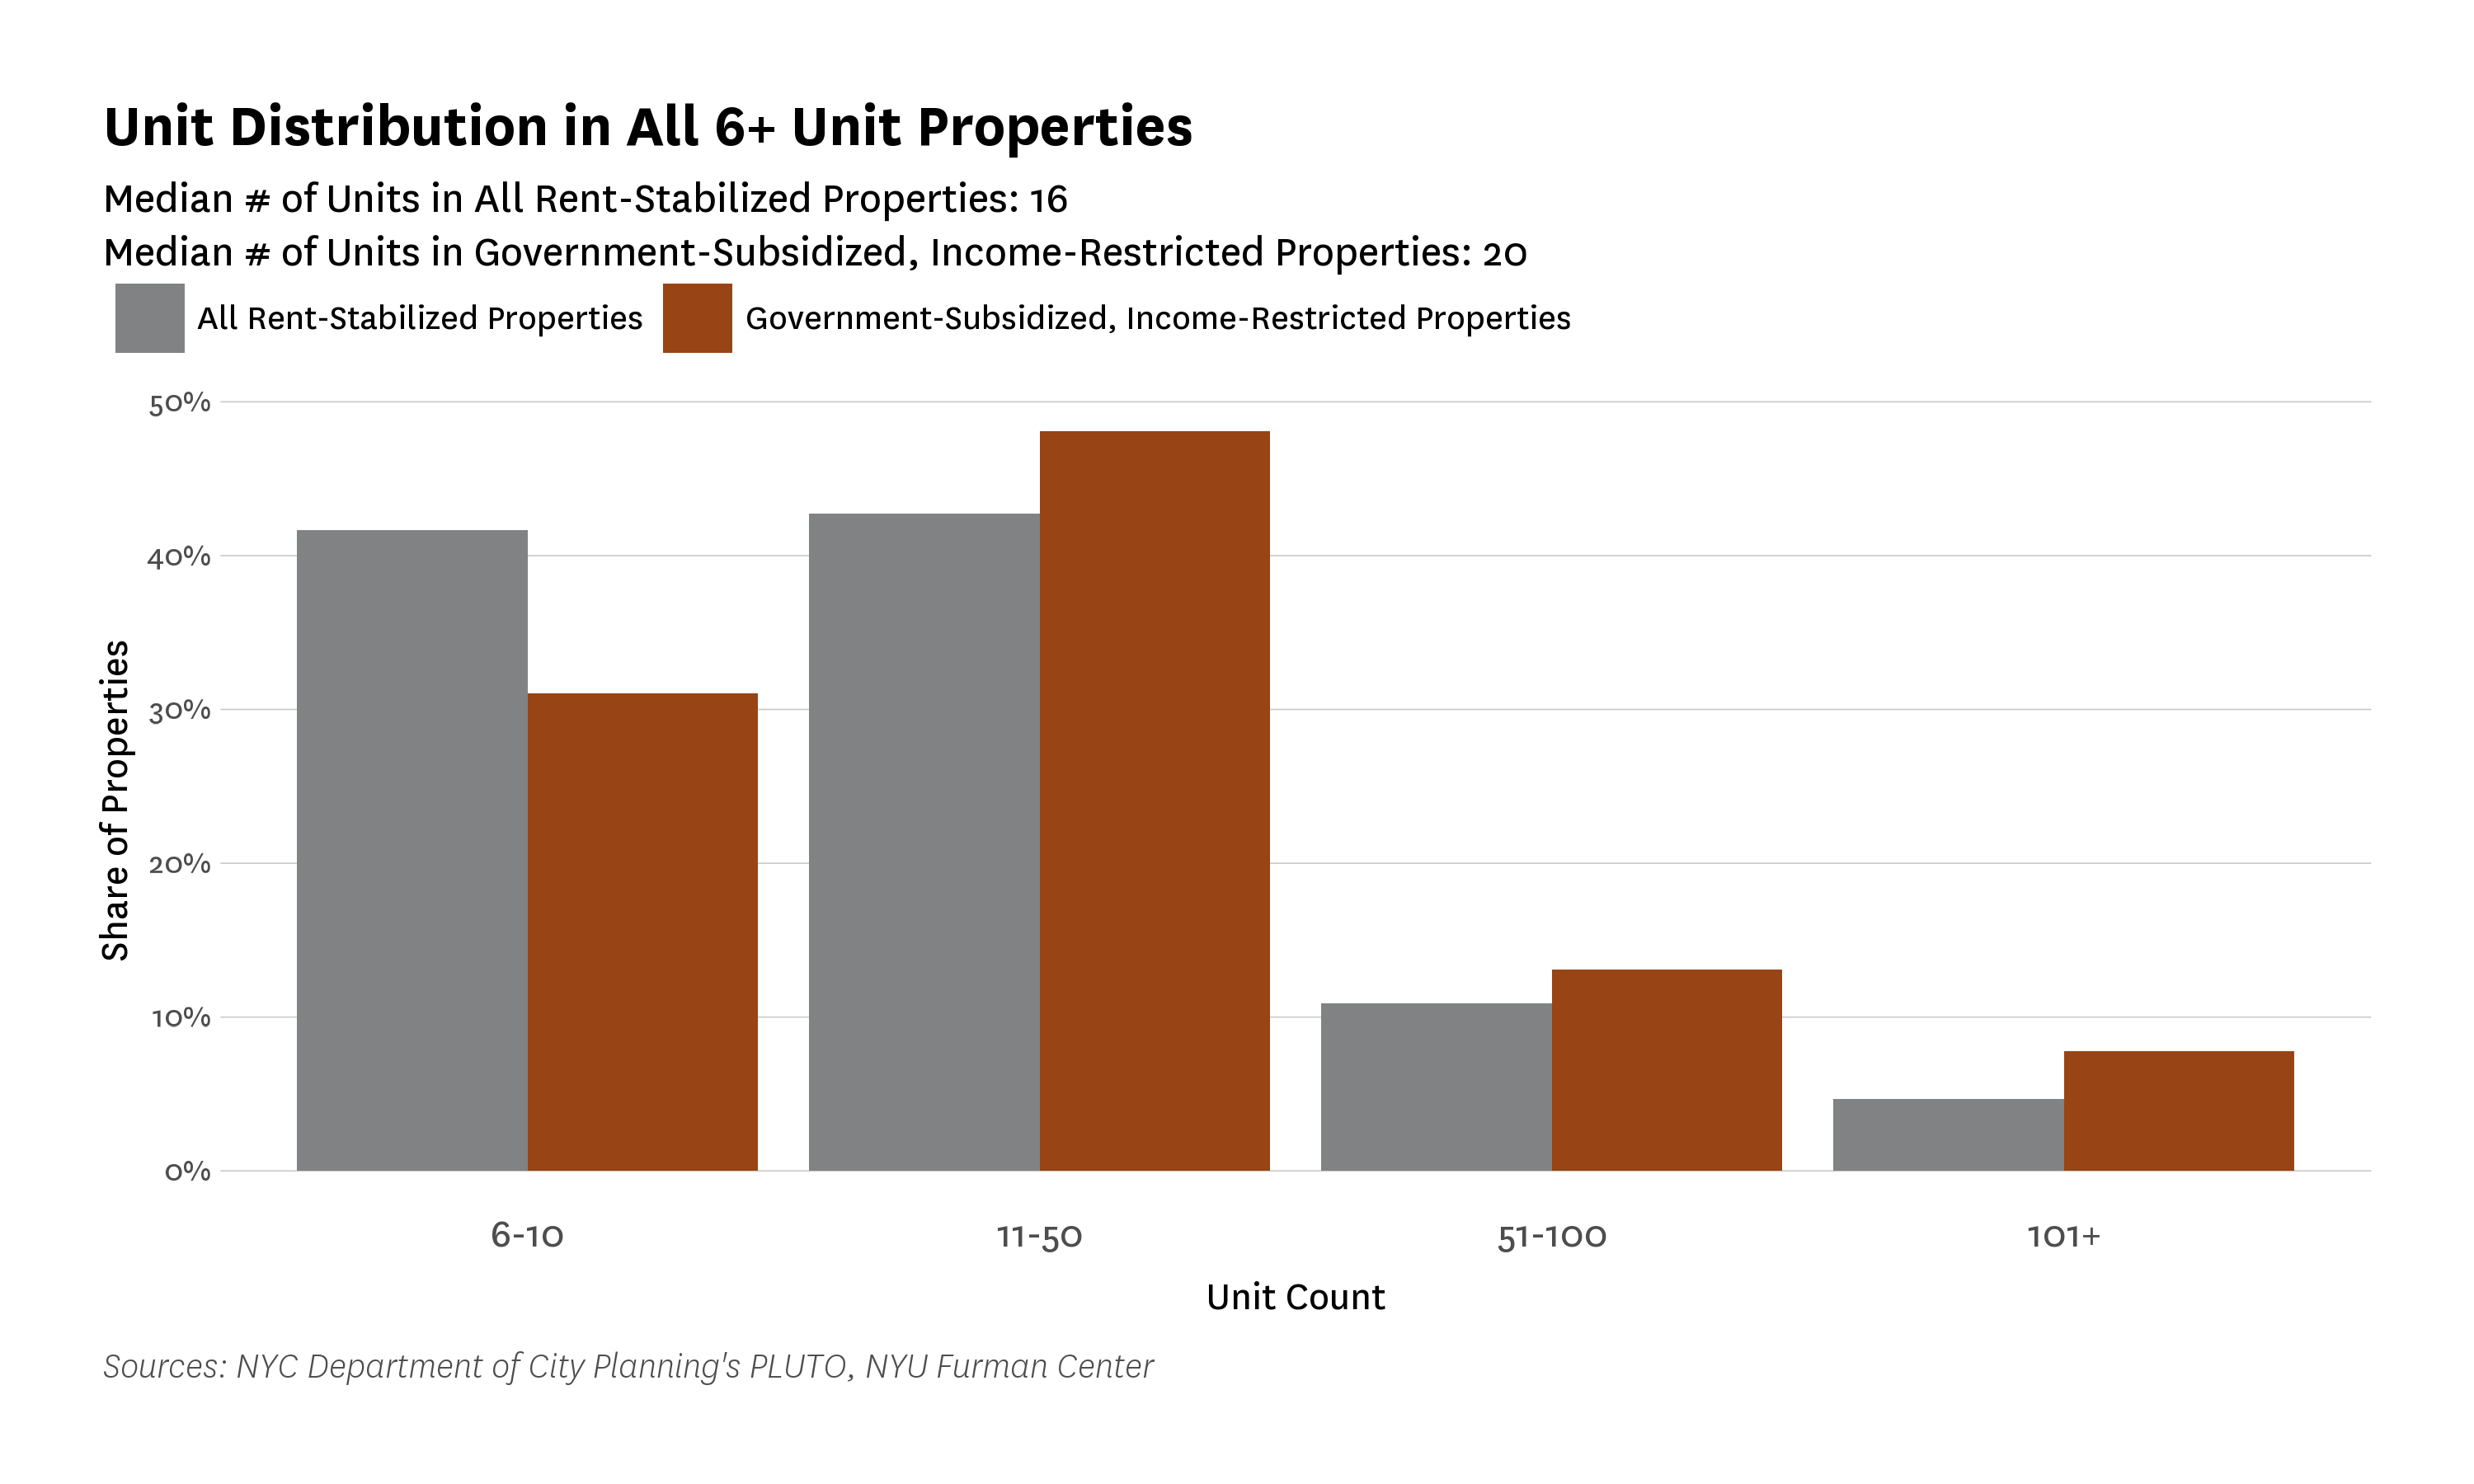
Government-subsidized, income-restricted buildings tend to be larger than rent-stabilized buildings overall. Their median size is 20 units, compared with 16 units across all rent-stabilized buildings (Figure 2). This size difference likely reflects the fact that securing financing and meeting program requirements is more challenging for very small buildings.
Nevertheless, it is the case that more than one quarter of government-subsidized, income-restricted buildings have 10 or fewer units. These smaller properties are generally not required to file Real Property Income and Expense (RPIE) statements with the Department of Finance (DOF) and therefore are not included in the rent, income, and expense analyses presented below. 3
Figure 2:
Rent Levels in Government-Subsidized, Income-Restricted Properties
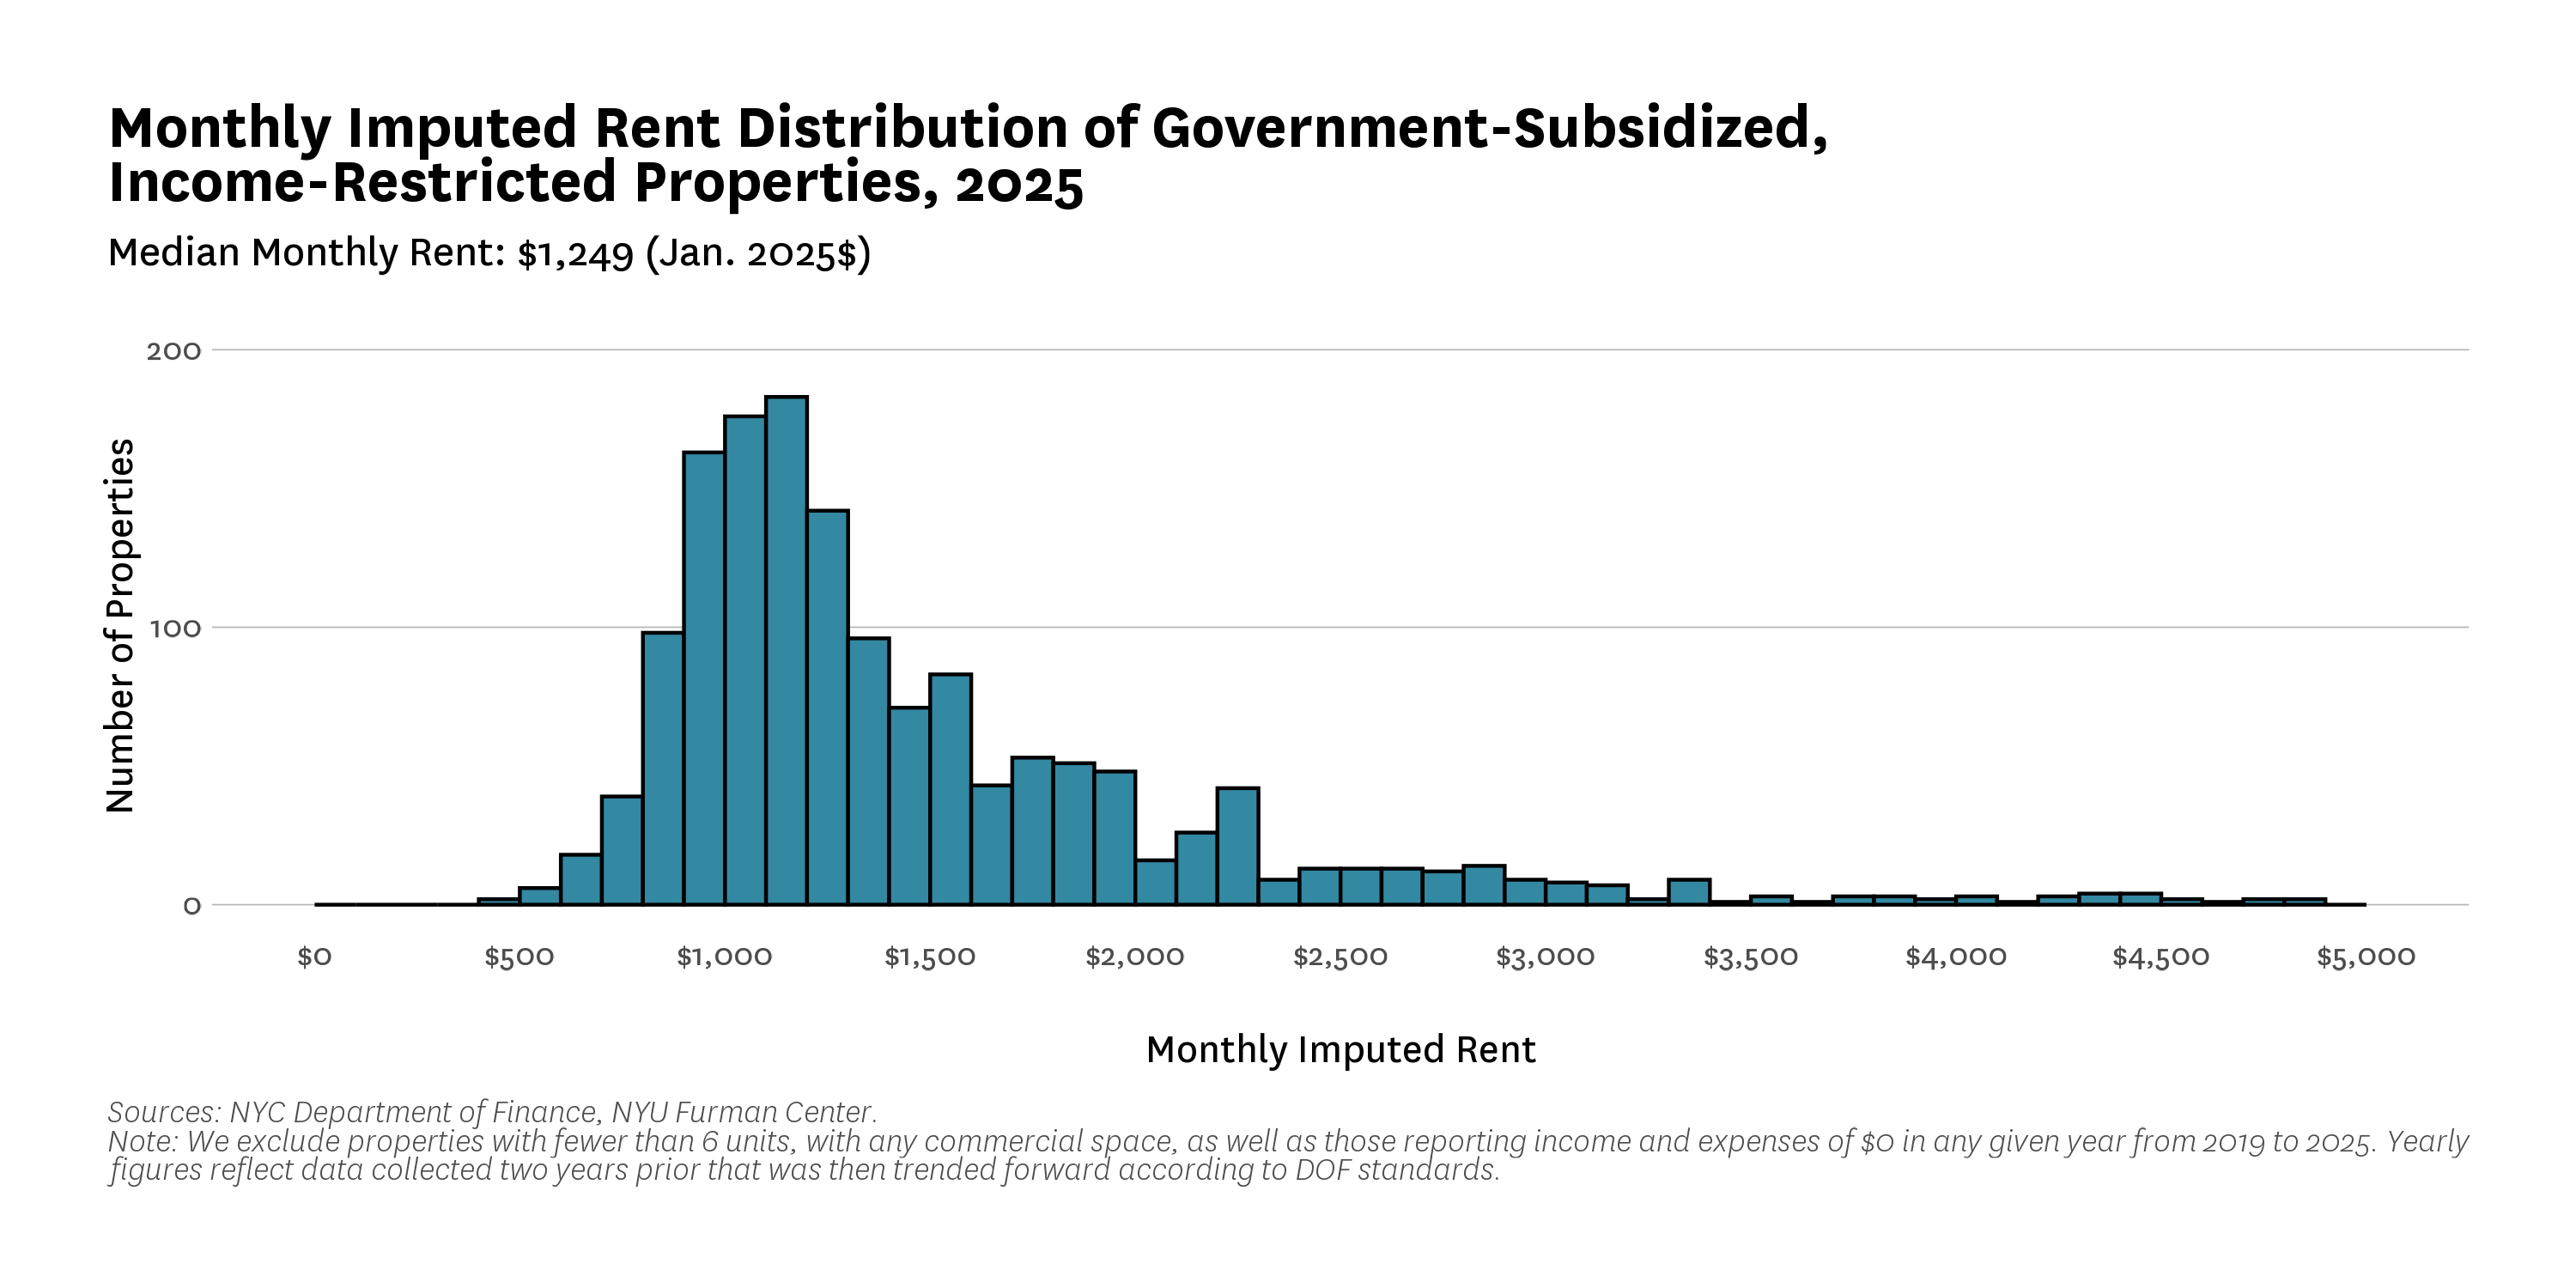
Government-subsidized, income-restricted buildings have a lower median rent than the broader stock of buildings with at least one rent-stabilized unit, because they are intended to provide apartments affordable to low- and moderate-income households. With a median imputed rent of $1,249, government-subsidized, income-restricted properties rent for about 16 percent less than the $1,455 median in buildings with any rent-stabilized units. 4 The difference largely reflects the fact that subsidized properties are composed almost entirely of income-restricted units, while the broader rent-stabilized stock includes both regulated and unregulated apartments with higher market rents. The median rent in this segment is also slightly lower than the legacy 90%+ properties we examined in the first data brief ($1,344 vs. $1,249).
The need for affordable, income-targeted homes in the city remains significant. As outlined in the overview brief, the real median renter household income has not kept pace with median gross rent. Rent burdens (paying more than 30% of income on rent) have lessened slightly, but remain pervasive among the lowest-income households. Almost three-quarters of New York City’s lowest-income households were rent burdened in 2023.
Figure 3:
Financial Pressures and Operating Cost Trends in Government-Subsidized, Income-Restricted Properties
Government-subsidized, income-restricted buildings have experienced mounting financial pressures in recent years as income growth has slowed while many operating costs have climbed. To understand how these pressures are affecting the segment, we draw both on the DOF’s RPIE data, which provide the most comprehensive systemwide view of revenues and expenditures in rent-stabilized housing, and on other non-profit organizations that have produced data and reports in recent months on proprietary portfolios that include this same subsegment of housing.
Because different datasets serve different purposes, they sometimes present different pictures of operating cost trends. DOF assessment data, which are used by the Rent Guidelines Board (RGB), reflect standardized adjustments required for property tax administration, including trending values forward two years (for example, from 2023 to 2025) and applying standardized expense ratios based on building characteristics. These adjustments create consistency across buildings and years, but they also smooth variation across properties and can flatten year-to-year spending trends. As a result, the values reported in the public Notice of Property Value (NOPV) files may not match the operating costs and revenues owners actually incur.
Proprietary owner datasets, by contrast, capture actual outlays as they occur and therefore tend to show sharper increases in categories such as insurance, administration, and repairs. Understanding these differences is essential for interpreting income and expense patterns in this segment. Even with these limitations, DOF’s adjusted data remain the official basis for both property assessment and rent-setting and provide a consistent point of comparison between government-subsidized, income-restricted buildings and the broader rent-stabilized stock. 5
Gross Income, Operating Expenditures, and Net Operating Income
In nominal terms, DOF data indicate that government-subsidized, income-restricted buildings experienced moderate increases in all three key metrics between 2019 and 2025. The data show that gross residential income rose by approximately 13 percent, operating expenditures increased by roughly 16 percent, and net operating income increased by about 10 percent. Taken on their own, these numbers suggest that revenues and expenditures both increased, with expenditures rising more quickly than income.
Inflation-adjusted measures provide a clearer picture. After accounting for inflation, real gross income declined, real operating expenditures fell modestly, and real net operating income also declined (Figure 4). The drop in real expenditures was larger in the government-subsidized, income-restricted stock than in the rent-stabilized stock overall, yet not enough to offset the decline in real income. Flat or declining real expenditures during a period when underlying operating costs are rising is typically a sign that owners are deferring or reallocating maintenance rather than evidence of declining underlying cost pressures. As a result, net operating income (NOI) fell in real terms. These trends show that although buildings generated higher nominal revenues, the purchasing power of those revenues diminished, leaving both nonprofit and for-profit owners with less real income to cover the costs of operating regulated housing.
Figure 4:
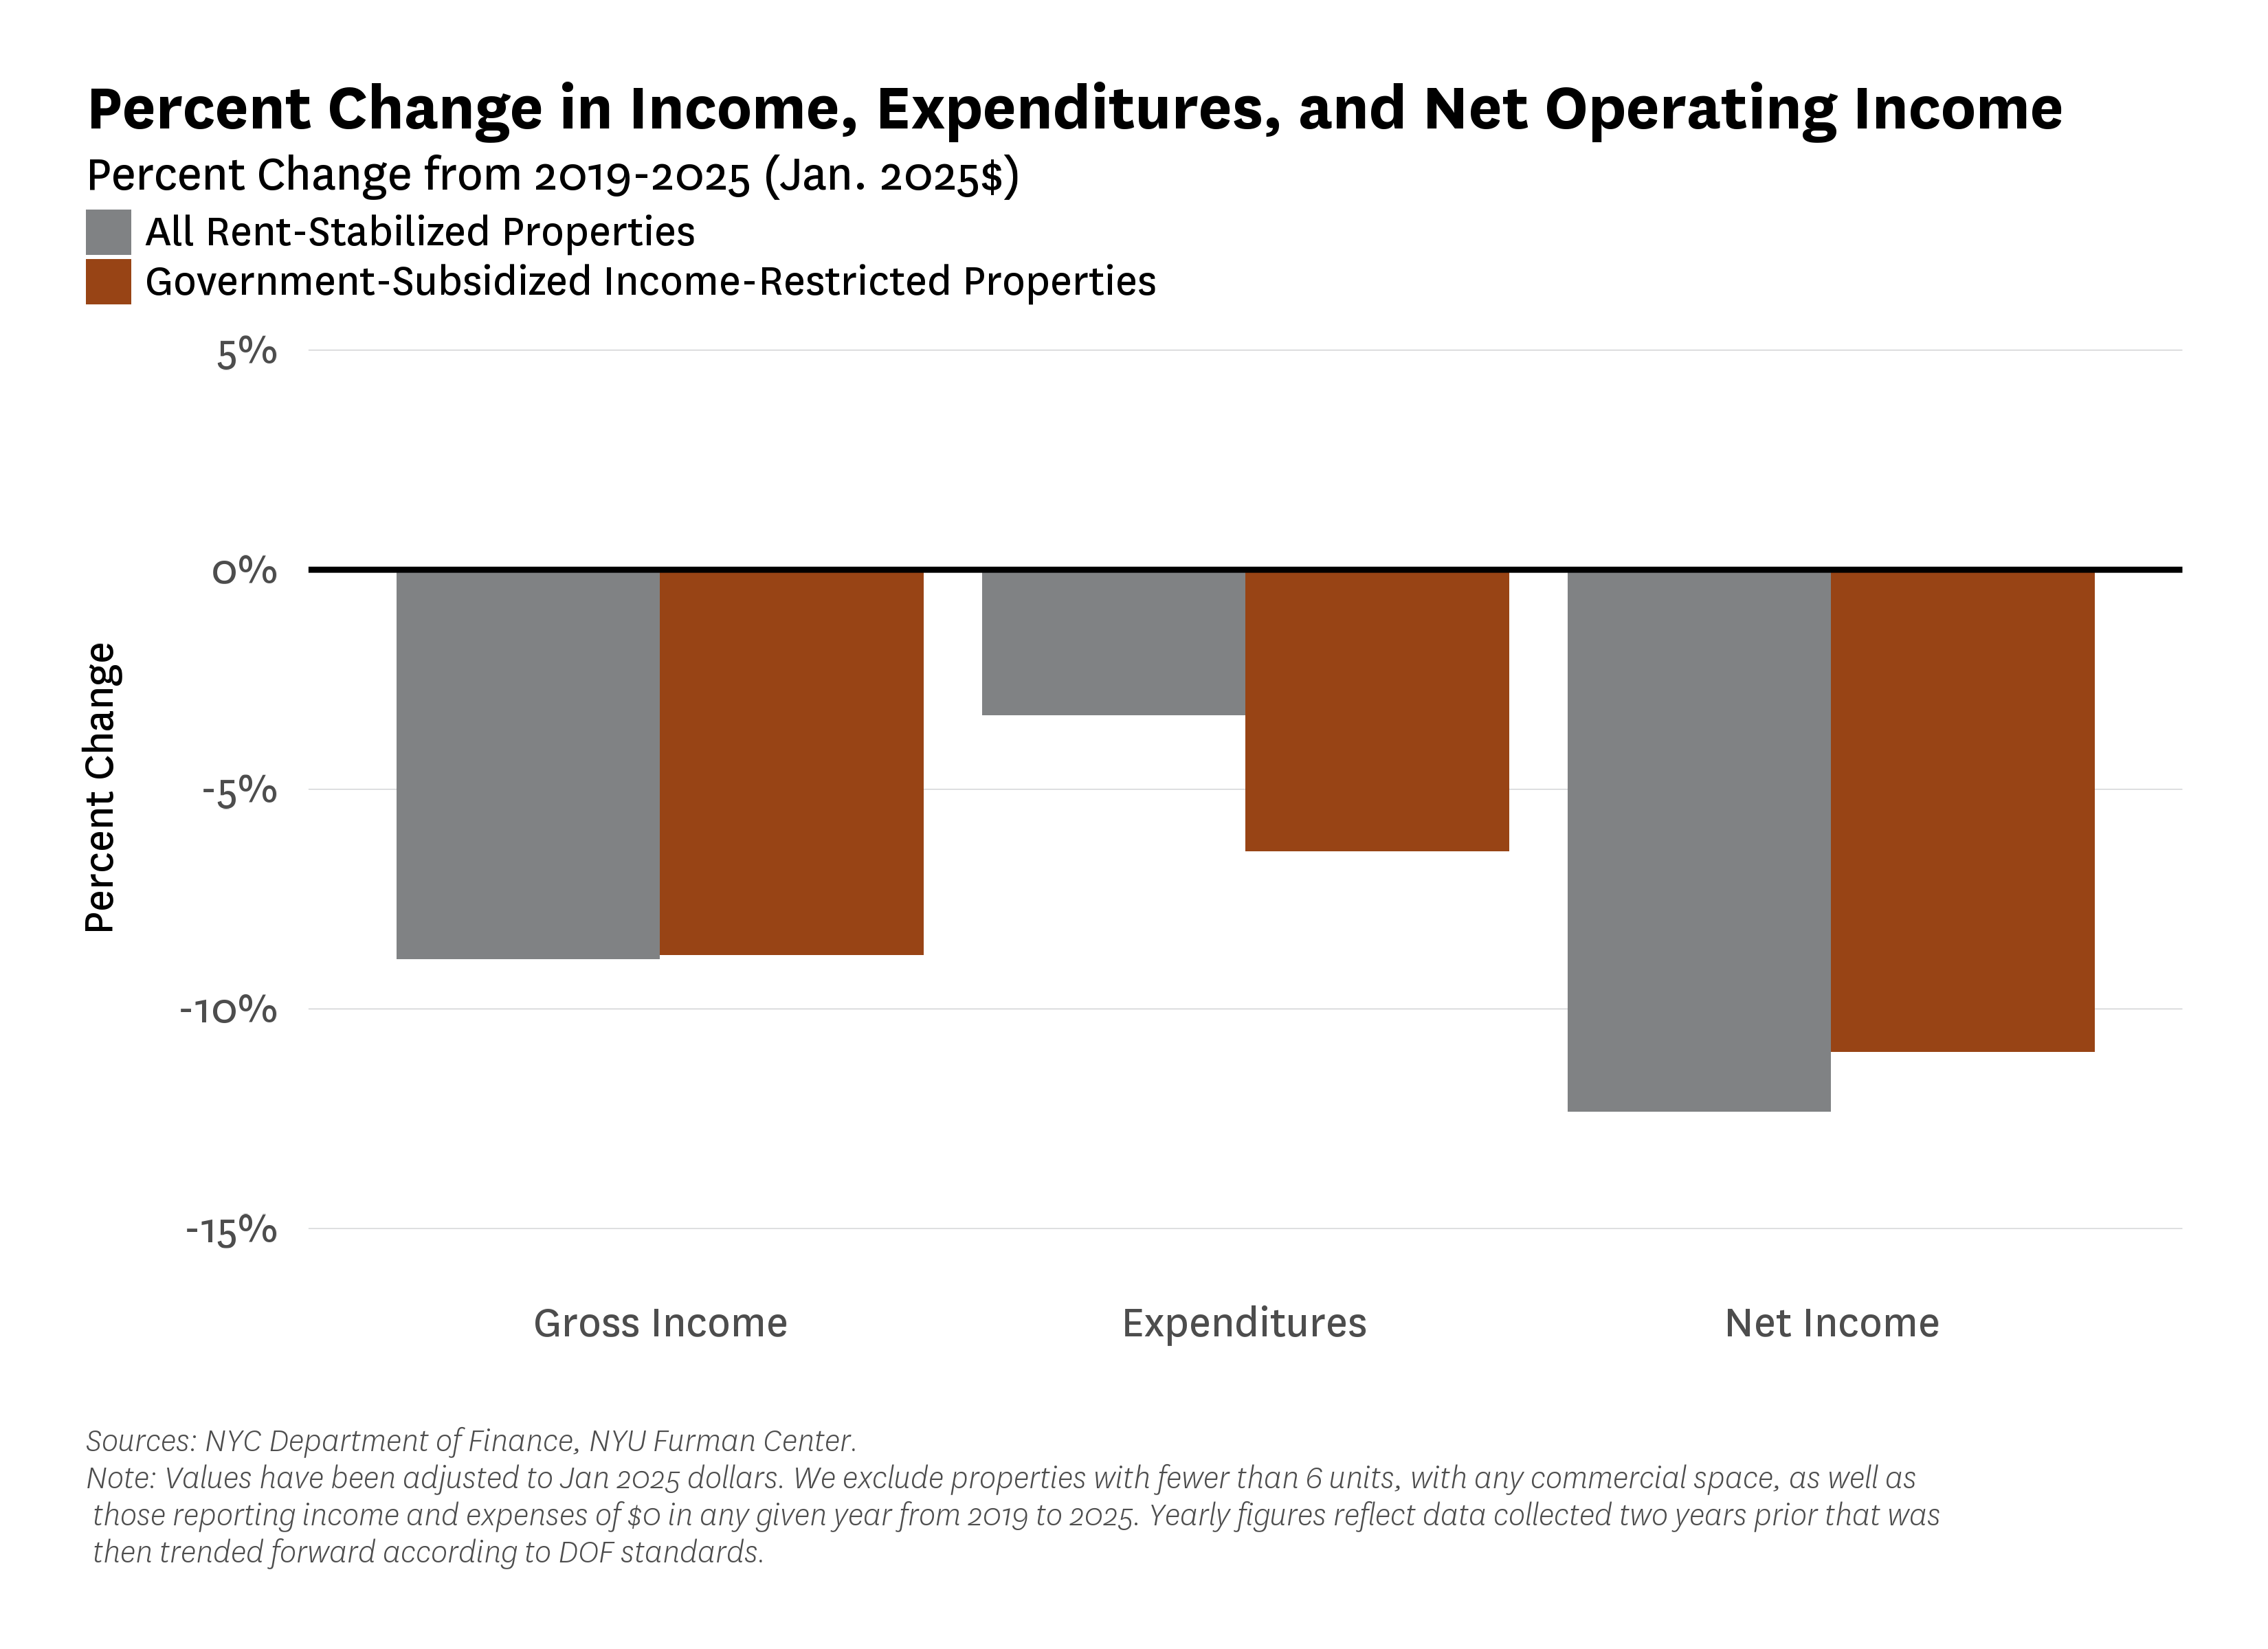
These trends do not imply that all buildings are in distress or that owners cannot meet their obligations. They do show that the income available to operate these buildings has lost purchasing power over time while operating costs have not declined in real terms. Proprietary datasets, which capture actual reported operating expenses, show sharper increases at a pace above inflation, which we explore in the next section.
Supplemental Data Sources Show Parallel Patterns
Several other data analyses of proprietary portfolios help explain why real income may be falling and owners’ ability to keep up with inflation-adjusted operating costs remains a challenge.
Enterprise Community Partners and National Equity Fund (NEF), a LISC affiliate, recently reported that rent collection in income-restricted housing across New York State declined between 2017 and 2024. Their analysis, which measures gross collected rent relative to gross potential rent, shows rent collections declining from 94.6 percent of potential rent in 2017 to 90.6 percent in 2024, along with a growing share of properties collecting less than 80 percent of potential rent. Enterprise and NEF also report a nominal increase of roughly 40 percent in operating expenses over this period, driven primarily by insurance, administration costs, and repairs and maintenance. Over the same years, the Consumer Price Index rose by approximately 25 percent, suggesting that operating expenditures grew at a faster rate than inflation. 6 That is slightly higher than the Rent Guidelines Board’s Price Index of Operating Costs (PIOC), which determined that the cost of operating all rent-stabilized properties increased by about 33 percent between the same period (2019 to 2025), compared with a 24 percent increase in the Consumer Price Index. 7
Another window into recent operating pressures in New York City’s rent-regulated stock comes from an analysis released in spring 2025 by the Community Preservation Corporation (CPC). CPC surveyed a representative sample of 361 borrower properties, covering more than 14,500 rent-stabilized units, many of which are income-restricted. CPC reports that per-unit operating expenses rose by 22 percent between 2020 and 2023, compared with a 13.8 percent increase in the Consumer Price Index over the same period. The steepest increases occurred in property insurance and general and administrative expenses, which grew 52 percent and 55 percent, respectively. Utilities and repairs also rose over these years. 8 CPC attributes the surge in insurance costs in part to volatility in New York’s insurance market and notes that some owners have responded by raising deductibles or adjusting coverage.
Research released this spring by the University Neighborhood Housing Program (UNHP) also points to increasing challenges in New York City’s multifamily housing stock. Drawing on data from the Buildings Indicator Project (BIP), UNHP found that the number of multifamily rental properties highly likely to be physically and/or financially distressed rose from 1,696 in the first quarter of 2020 to 3,768 in the fourth quarter of 2024, an increase of 122 percent over four years. UNHP noted a number of factors impacting multifamily housing, including increasing insurance and utility costs, a decline in rent collections following COVID-19, and higher interest rates and declining market values that have made it challenging for owners to refinance their buildings. 9
To supplement systemwide trends, we also analyzed a cohort of recently built, 100-percent affordable housing developments financed with the Low Income Housing Tax Credit (LIHTC), built in New York City, and that will be coming up on their 15th year of operation in about 2030. This dataset includes about 40 projects completed between 2013 and 2016, totaling more than 5,000 units, all built by different owners. Because these developments share similar construction periods, financing structures, and lease-up timing, they offer a more comparable group of properties than the broader and more heterogeneous portfolio of all government-subsidized housing. These data have not been analyzed in previous public reports, but provide a useful case study of how newer income-restricted buildings have performed in recent years.
Nominal trends show that both revenue and operating expenditures increased, with expenditures rising far more quickly. Between 2018 and 2023, total nominal revenue per unit rose by about 6 percent. Over the same period, nominal operating expenditures increased by 34 percent, and all major expenditure categories increased. Administrative expenditures rose by roughly 33 percent, utilities by about 29 percent, and operating and maintenance expenditures by approximately 37 percent. The sharpest nominal growth occurred in the taxes and insurance category, which increased by more than 80 percent. 10
After adjusting numbers to constant 2025 dollars, the pattern becomes clearer. Total real revenue per unit declined by about 8 percent between 2018 and 2023, $16,700 to $15,400 (8.5% decline). Over the same period, total real operating expenditures increased by 14 percent, from $8,080 to $9,200. Real tax and insurance expenditures increased the most, rising by 53 percent. Operating and maintenance expenditures grew by 17 percent in real terms, while administrative expenditures increased by about 13 percent. These inflation-adjusted trends indicate that several major expenditure categories rose faster than general inflation, even among relatively new buildings constructed under contemporary underwriting assumptions.
Table 1:
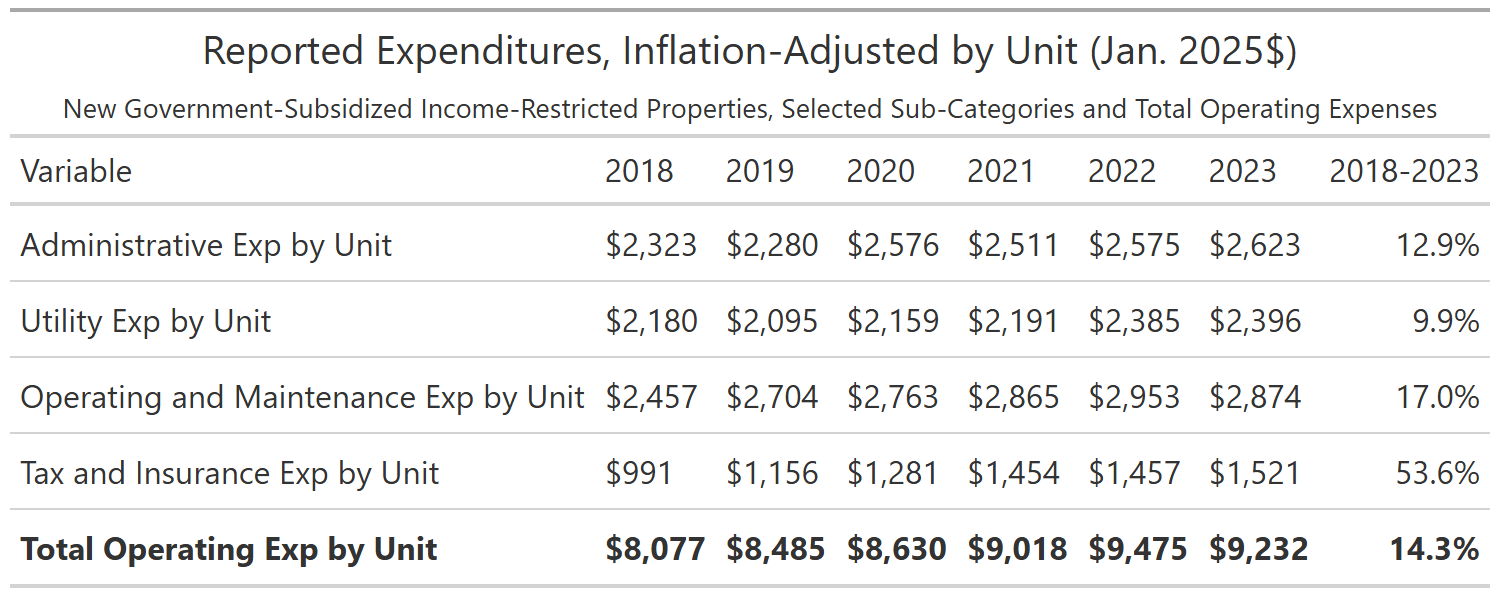
Across multiple datasets, the cost of operating multifamily buildings has increased in real terms, with insurance, administration, repairs, and utilities rising particularly quickly. DOF data, by contrast, show that owners of government-subsidized, income-restricted properties have kept total operating expenditures roughly flat in real terms. This does not indicate that underlying costs are stable; rather, it suggests that owners may be reallocating or reducing spending in areas where costs are more flexible. Flat or declining real expenditures during a period of rising operating input prices typically reflect deferred maintenance or delayed replacement cycles. These adjustments can help buildings remain solvent in the short term, but they reduce the resources available for long-term upkeep and coincide with declines in real NOI, creating additional refinancing and recapitalization challenges.
Further, even if owners manage to maintain building quality in the face of rising operating expenses, for these government-subsidized, income-restricted properties, the declines in NOI, depicted in Figure 4, can be a problem in and of themselves. The newer properties that used deeper subsidy programs in this segment and that continue to have hard debt are typically fully leveraged, meaning they have borrowed as much as their projected NOI can support. Because the initial underwriting requires a given level of NOI to support debt service and other activities, any decrease in income or increase in operating costs that forces a decline in NOI creates financial strain and makes paying that debt service (or refinancing the project) more difficult.
Indicators of Physical Distress
Another indicator that rising real expenses and the fall in real revenue may threaten the ability of owners to take proper care of government-subsidized, income-restricted buildings is that the rate of housing code violations in this subsegment of rent-stabilized housing has increased, particularly in the last two years. As Figure 5 shows, violation rates in these properties tracked those of the broader rent-stabilized stock for several years, but increased more sharply in the past two years. In 2023, the gap between the two widened, with government-subsidized, income-restricted buildings experiencing higher violation rates than the overall stock. 11
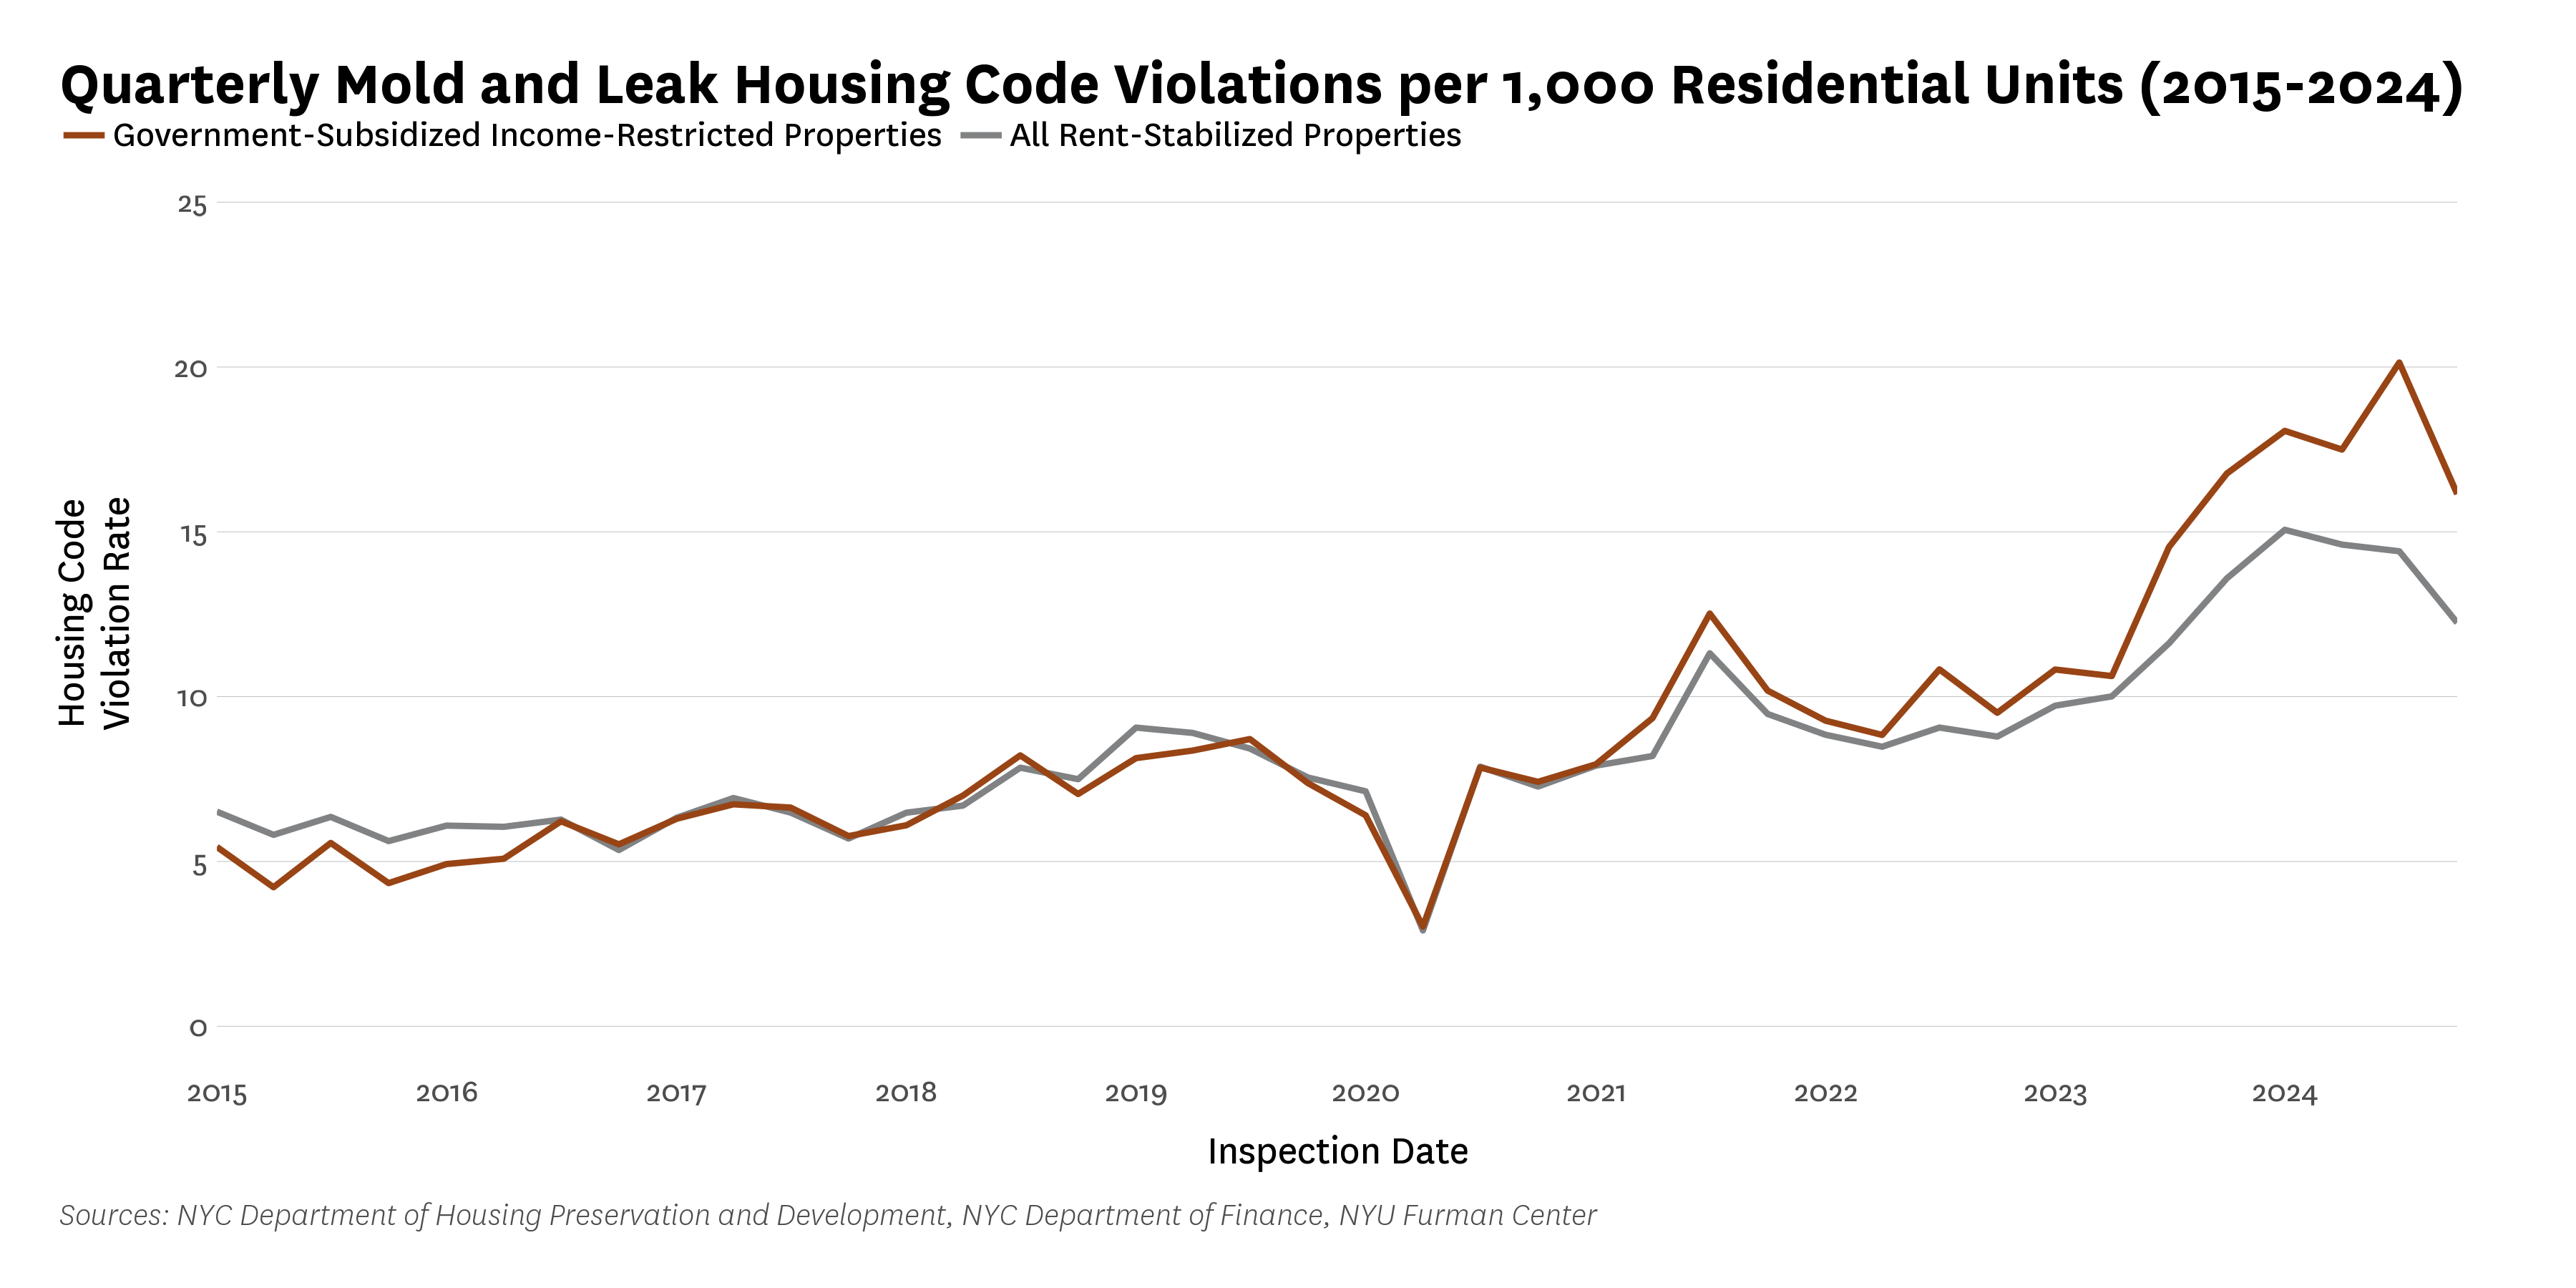
The pattern of a widening gap in the last two years is also evident when focusing on immediately hazardous class C housing violations (which include lead-based paint, lack of heat or hot water, a lack of self-closing doors, mold, and pests). Although the class C violations rate rose for both government-subsidized, income-restricted housing and the broader stock of all rent-stabilized properties, the violation rate among government-subsidized buildings increasingly outpaced that of all the rent-stabilized stock in recent years (Figure 6). A similar widening gap in violation rates appears when examining just mold and leak violations (Figure 7), which are particularly indicative of issues with property maintenance. The mold and leak violations have trended downward in the last few quarters, as have the broader all-violations category, but not the class C violations. In each category, though, the large gap between the violations issued against government-subsidized, income-restricted buildings and all rent-stabilized buildings has persisted.
Figure 5:
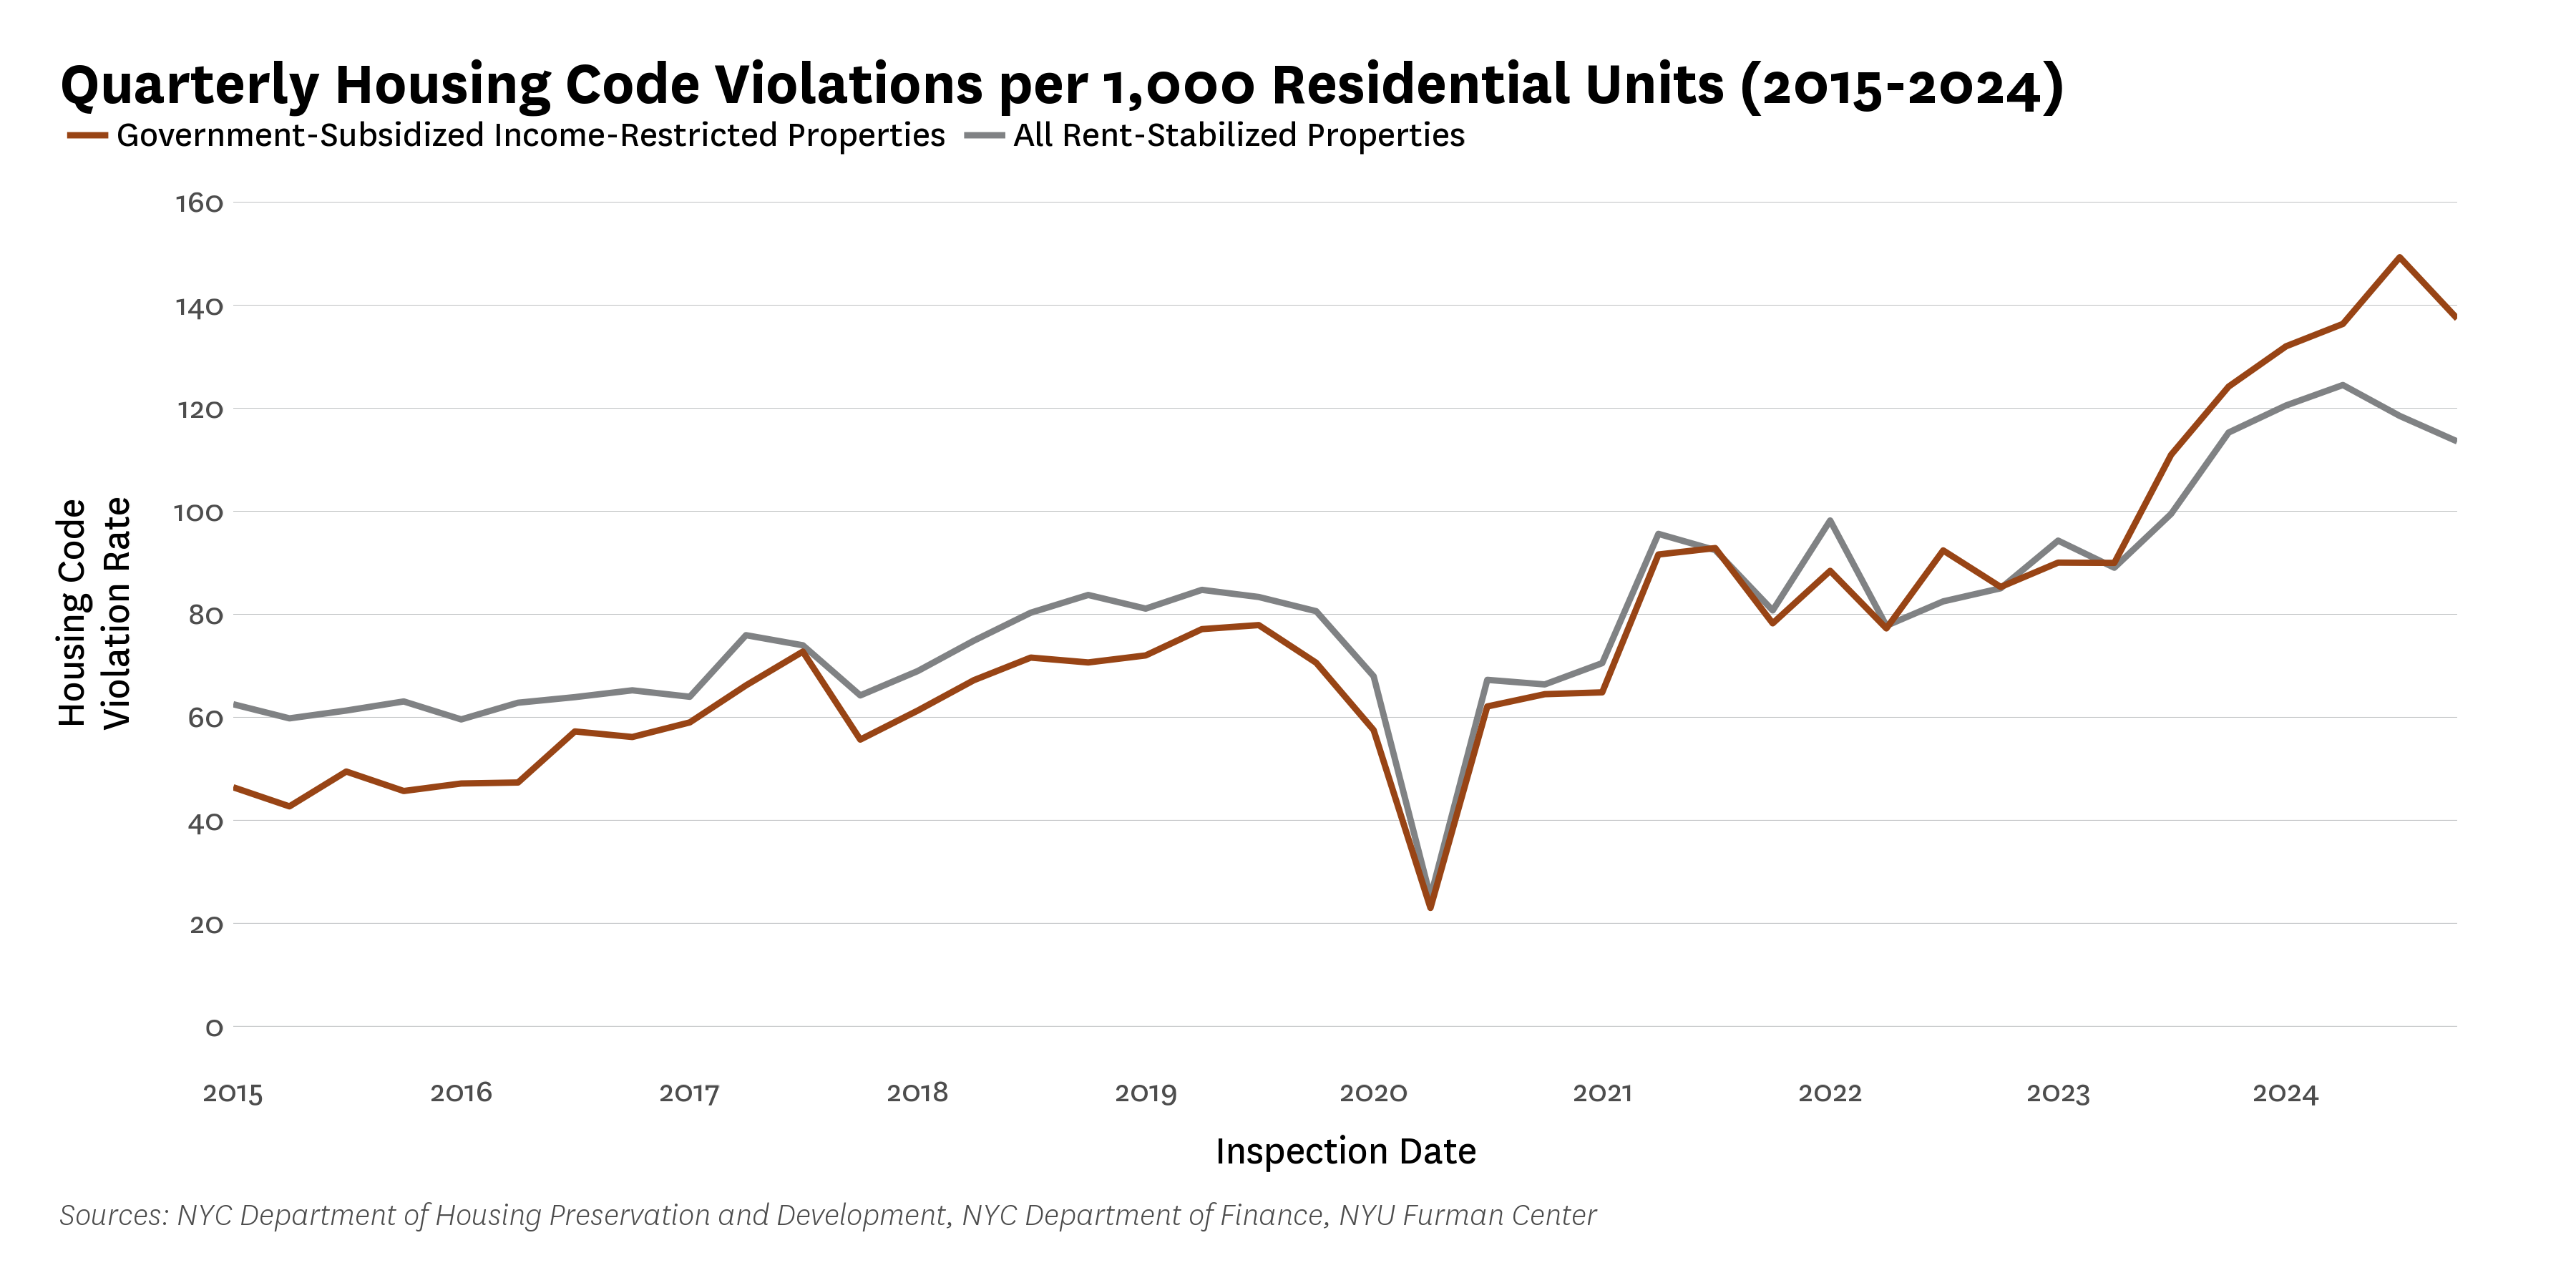
Figure 6:
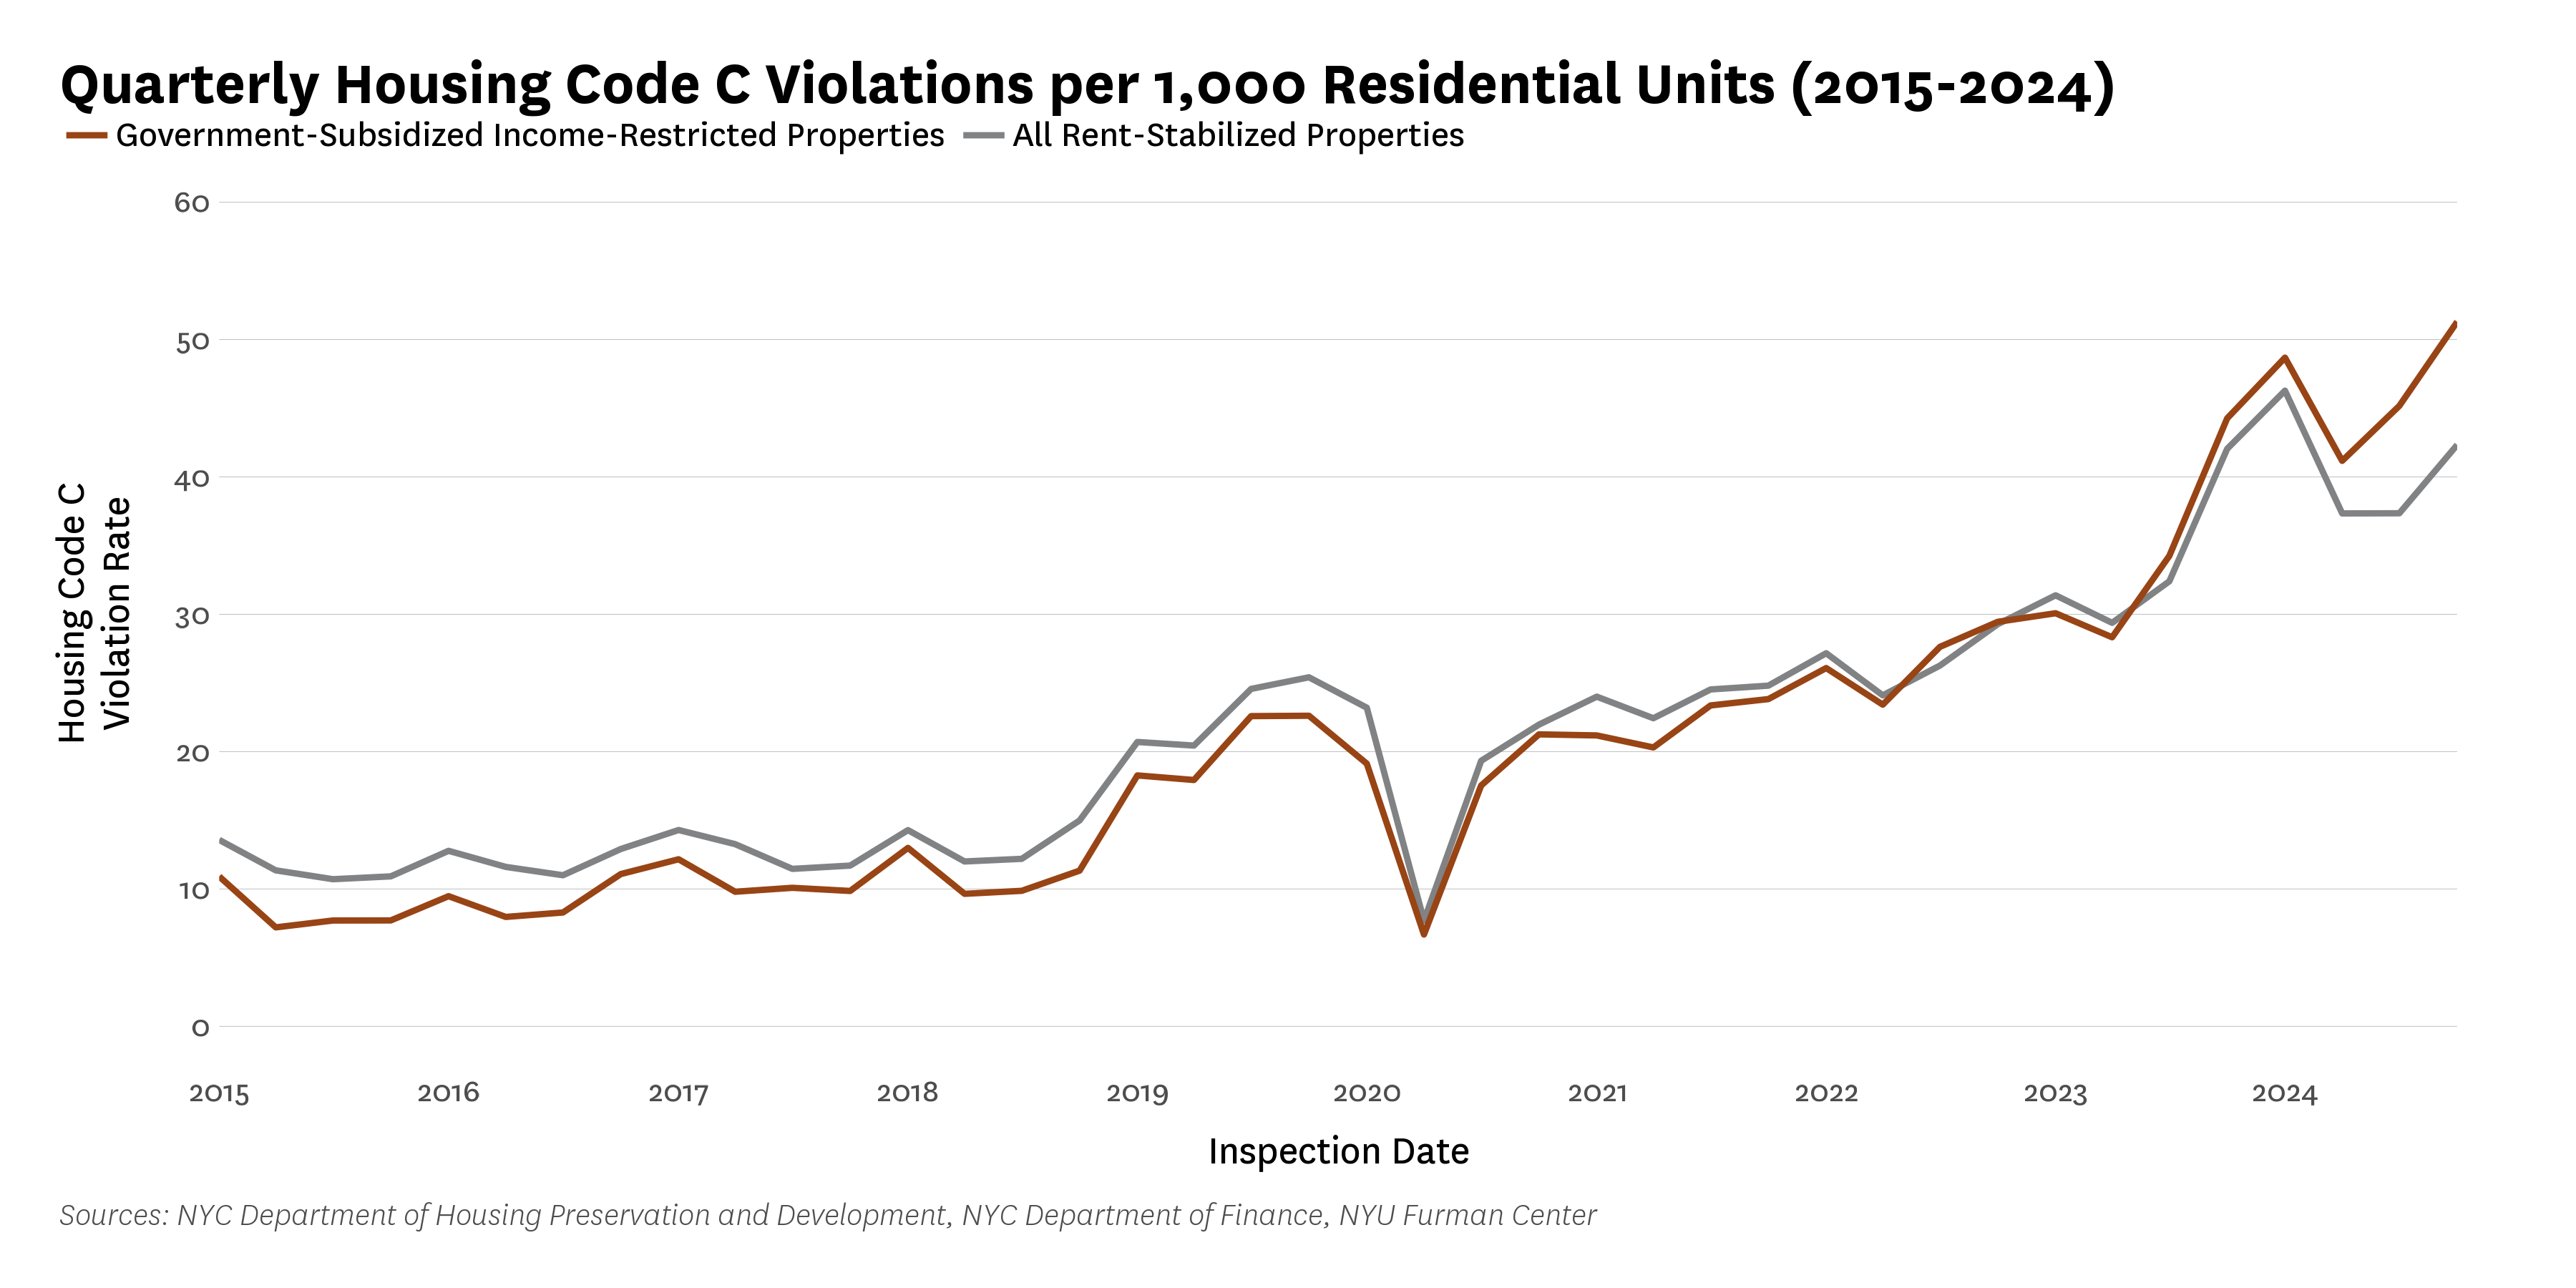
Figure 7:
Implications and Conclusion
Government-subsidized, income-restricted properties are a central component of New York City’s affordable housing system and the product of substantial public investment over many decades. These buildings were designed to provide stable, long-term housing for low- and moderate-income households, and their continued performance depends on financial conditions that allow owners to meet both day-to-day operating demands and long-term capital needs.
The empirical trends in this brief indicate that these properties are operating in a tightening financial environment. In real terms, operating income has declined, several major expense categories have grown faster than inflation, and net operating income has fallen even as owners have reduced real spending. Evidence from a sample of newer government-subsidized properties reinforces this picture, with operating costs rising by 14 percent in real terms between 2018 and 2023. The fact that real expenditures declined in this subsegment, while remaining roughly stable across all rent-stabilized properties, may signal that owners are adjusting operating or maintenance practices in response to rising costs.
These pressures matter because many government-subsidized, income-restricted buildings were underwritten with narrow margins and structured to support the maximum feasible level of debt while maintaining affordability requirements. Sustaining these buildings over time requires net operating income that keeps pace with rising operating costs. When NOI weakens in real terms, refinancing becomes more difficult and properties are more likely to require deeper public subsidy at recapitalization. These challenges arise alongside significant capital and operating needs in NYCHA and the Mitchell-Lama portfolios, increasing competition for limited preservation resources. Without targeted intervention, more buildings may reach the end of their compliance periods with affordability intact, but physical conditions at risk.
Series: NYC’s Rent-Stabilized Housing: Understanding Different Segments of the Stock and Why it Matters
- The government-subsidized, income-restricted housing category includes the following cases of properties benefitting from the 421-a tax exemption: properties receiving the 35-year 421-a exemption and financed via LIHTC, or the 25 year 421-a tax exemption program outside of the Geographic Exclusion Area (GEA). About half of the properties in this segment of the rent-stabilized housing stock use the Low-Income Housing Tax Credit (LIHTC) program, which provides tax credits to investors who finance housing for low- and very low-income households. In addition, 36 percent of government subsidized, income-restricted properties (and about half of all units) receive support through HUD’s Multifamily Program, which provides financing to preserve privately owned, HUD-assisted rental housing. 27 percent of properties benefit from the Article XI tax exemption, which supports HDFC-sponsored new construction and preservation projects, often in combination with LIHTC financing. Another nine percent of properties use versions of the 421-a tax exemption we determined were largely limited to fully income-restricted housing. ↩
- We welcome continued efforts to refine estimates of this segment, given the challenges of identifying all properties operating under affordability-focused regulatory agreements. The figures presented here reflect our current best assessment, and a coordinated, data-driven effort across agencies and stakeholders could further improve the precision of these estimates. ↩
- Properties with ten or fewer units are not included in the analysis of imputed rent, income, expenses, and net operating income (NOI) discussed below. Those analyses use data based on the Department of Finance’s Real Properties Income and Expense (RPIE) filings, which purely residential buildings with 10 or fewer units are not required to submit. Because smaller buildings may face distinct income and expense patterns not reflected in the available data, the figures presented below capture only part of the financial picture for the government-subsidized, income-restricted properties. ↩
- Median values are calculated from building-level average imputed rents. We take the median of per-building average rents, which summarizes the typical rent level across properties rather than across individual units. Average rents are estimated by dividing the total property income by the number of residential units among properties with no commercial units. Because rent nonpayment and vacancies will lower property-level income, this approach provides a lower-bound estimate of actual unit-level rents. ↩
- For more information on the RPIE statements and the NOPV data, please review the technical appendix in the Overview Brief. ↩
- Boyle, P., & Kim, A. (2025, October 20). Distress in New York’s affordable housing stock: Data from Enterprise and National Equity Fund’s portfolio. Enterprise Community Partners, National Equity Fund, & LISC NY. https://www.enterprisecommunity.org/learning-center/resources/distress-new-yorks-affordable-housing-stock ↩
- The Rent Guidelines Board’s PIOC index is discussed in more detail in the first brief in this series, Data Brief: Legacy 90%+ Rent-Stabilized Properties. https://www.furmancenter.org/legacy-90-rent-stabilized-properties ↩
- Community Preservation Corporation. (2025, May 5). NYC rent-regulated portfolio data brief: 2020–2024. https://communityp.com/wp-content/uploads/2025/05/CPC-NYC-Portfolio-Data-Brief-2020-2024-v2.pdf ↩
- University Neighborhood Housing Program. (2025, April). Building Indicator Project (BIP) Meeting. https://unhp.org/wp-content/uploads/2025/04/UNHP-Presentation-Multifamily-Lending-Roundtable-April-2025-1.pdf ↩
- In this dataset, taxes and insurance refers to a bundled operating expenditure category that includes payroll taxes, property and liability insurance premiums, workers’ compensation, and related required tax and insurance expenditures. ↩
- Both groups saw notable increases in violation rates beginning in 2023. Some of this increase is due to the Department of Housing Preservation and Development’s (HPD) hiring of 100 additional inspectors in 2023 and 2024, but the agency has also attributed the rise to a surge in tenant complaints. Spauster, P. (2024, October 16). Housing violations in NYC jumped 24% this year. We mapped them by neighborhood. City Limits. https://citylimits.org/housing-violations-in-nyc-jumped-24-this-year-we-mapped-them-by-neighborhood/ ↩