Understanding Different Segments of New York City's Rent-Stabilized Housing Stock

This brief introduces our two-part series by describing New York City’s rental housing landscape and the key segments of its rent-stabilized stock.
Introduction
New York City is known for its high housing costs, yet its citywide median rent was $1,810 per month in 2023, lower than many might expect. This reflects, in part, the fact that about 40 percent of the city’s rental homes are covered by rent stabilization. While not every rent-stabilized apartment is deeply affordable, the system as a whole serves as a cornerstone of affordability in New York’s rental market. Together with public housing, rent-stabilized homes have helped keep the overall median rent below levels typically cited for market-rate units available for rent.1 These homes play an essential role in maintaining affordability for tenants, not only citywide but also within neighborhoods that have otherwise experienced sharp rent increases over time. Preserving the quality and affordability of rent-stabilized housing accordingly is a critical mandate for New York City and New York State.
Rent-stabilized apartments are governed by the city’s Rent Stabilization Law of 1969, implemented under the State’s Emergency Tenant Protection Act of 1974 (ETPA) and later extended to newly built properties through various tax and subsidy programs. This overview brief introduces two data briefs designed to clarify the diversity of rent-stabilized housing in New York City and show how economic and policy pressures affect these buildings differently. The first data brief examines “Legacy 90%+ Rent-Stabilized Properties,” and the second focuses on “Government-Subsidized, Income-Restricted Properties.” Together, these briefs form a unified series describing the structure, conditions, and emerging challenges within these critical segments of New York City’s rent-stabilized housing stock.
Preserving the stabilized stock efficiently and effectively depends on understanding its composition and how it functions. Analyses often treat rent-stabilized housing as a monolith, relying on aggregate data that obscure important differences among the buildings the units are in. In reality, the stock is highly varied: while many properties predate 1974, others entered later through public financing or tax incentive programs. Most of these properties are privately owned by for-profit individuals and entities, but some are owned and managed by non-profit organizations. They differ in size, share of stabilized units, sources of income, financing structures, and regulatory oversight, factors that shape distinct financial and operational dynamics across the stock. Because each segment operates under different conditions, efforts to preserve and invest in these buildings must be tailored to their circumstances, whether that be through code enforcement, capital repairs, targeted subsidies, revenue enhancements, property tax adjustments, and other policies.
Taken together, the segments examined in this series make up the core of New York City’s affordable private rental housing. While their structures and regulatory contexts differ, they share common challenges: a rising operating cost environment, aging buildings, and a recent period in which revenues have not kept pace with inflation. Across both subsegments examined in this series, inflation-adjusted revenues have declined while several key operating costs have risen faster than inflation, narrowing operating margins and creating challenges for long-term maintenance and recapitalization. The following briefs examine how these dynamics appear in two distinct segments of the stabilized stock.
The NYU Furman Center undertakes this work to deepen understanding of New York City’s rent-stabilized housing stock and to provide policymakers, practitioners, and researchers with clear, objective evidence about the conditions and challenges it faces. By grounding debate in data and analysis, the Center seeks to inform practical, effective policies that preserve affordability, promote sound building stewardship, and sustain this essential part of the city’s housing system for generations to come. The sections that follow describe New York City’s rental housing landscape and the key segments of its rent-stabilized stock that this series examines in greater depth.
The Backdrop
New York City’s Rental Housing Market
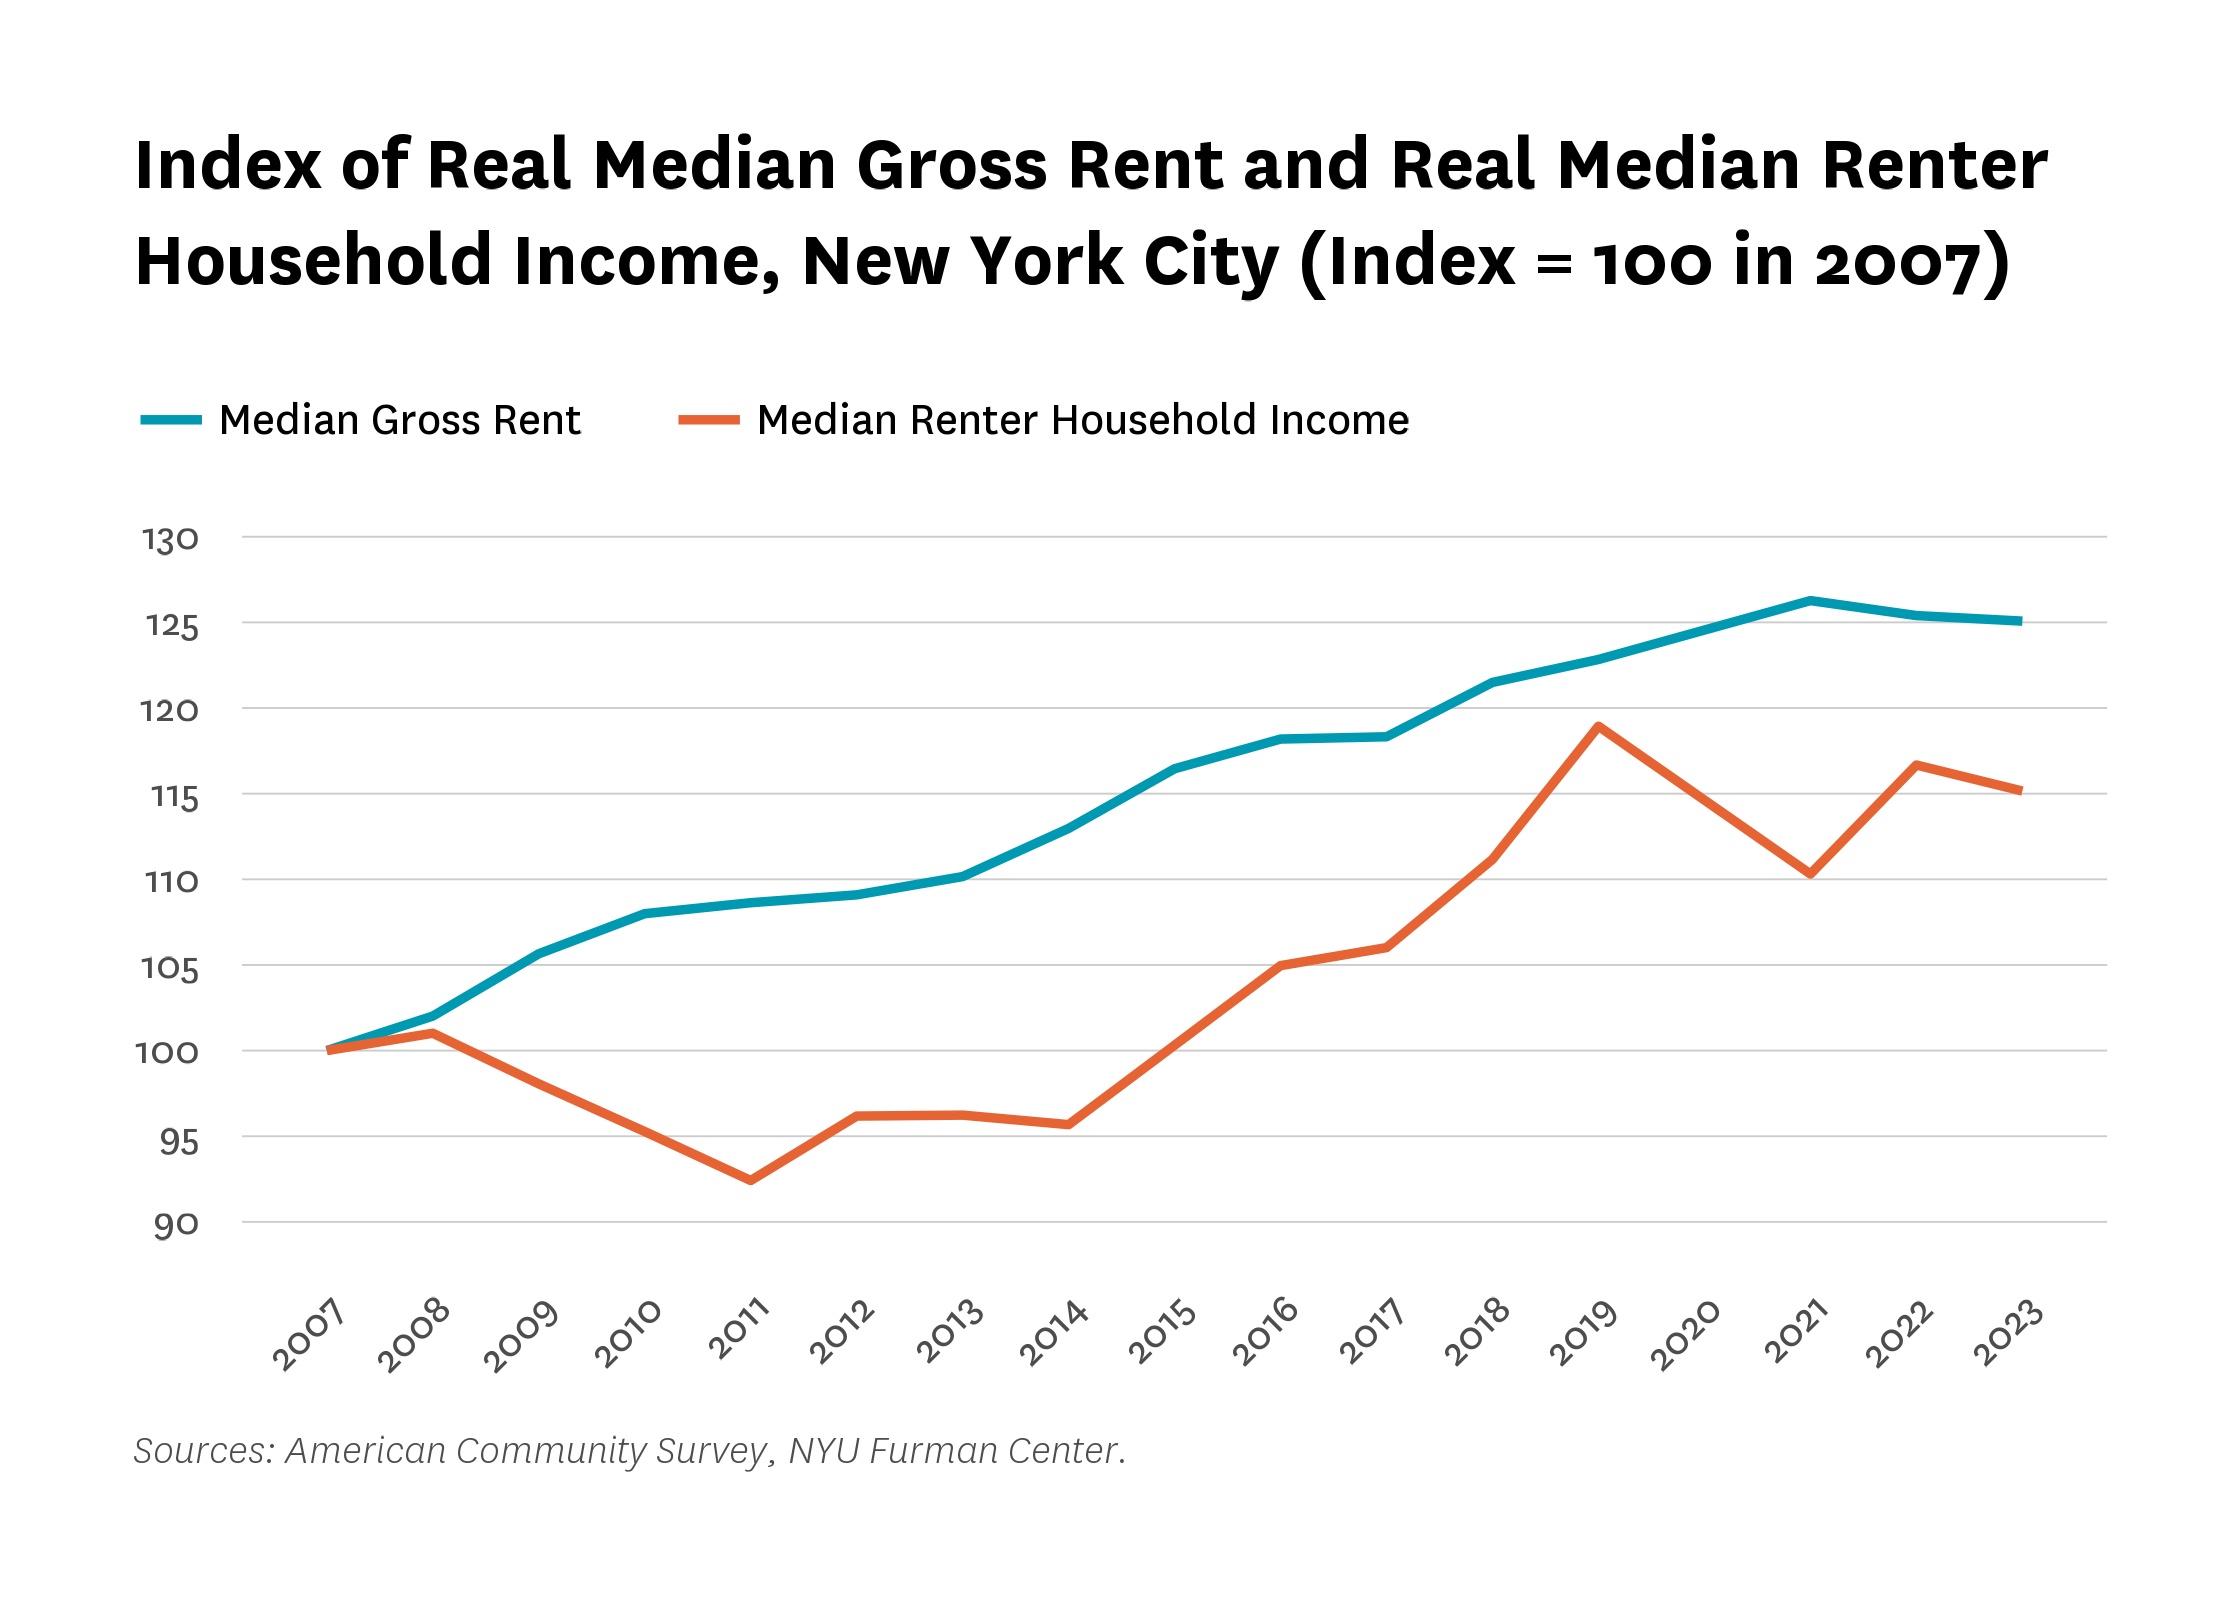
Between 2007 and 2023, rental housing in New York City has become less affordable. The median income of New York City’s renter households increased by 15 percent after adjusting for inflation (which we will refer to as “inflation-adjusted” or “in real terms”), while median rents rose by nearly 25 percent (Figure 1). Although some renters have seen real income gains, most of those gains have been offset by faster rent growth. The result is a persistent gap between income growth and rent inflation.
At the same time, the cost of other necessities has climbed sharply: between January 2015 and 2025, regional food and transportation costs increased by more than 35 percent in nominal terms, and medical care costs rose by 27 percent, further eroding renters’ purchasing power.2 These rising costs have left many New Yorkers with less income available for housing or savings, compounding pressure on lower- and moderate-income households.
Figure 1:
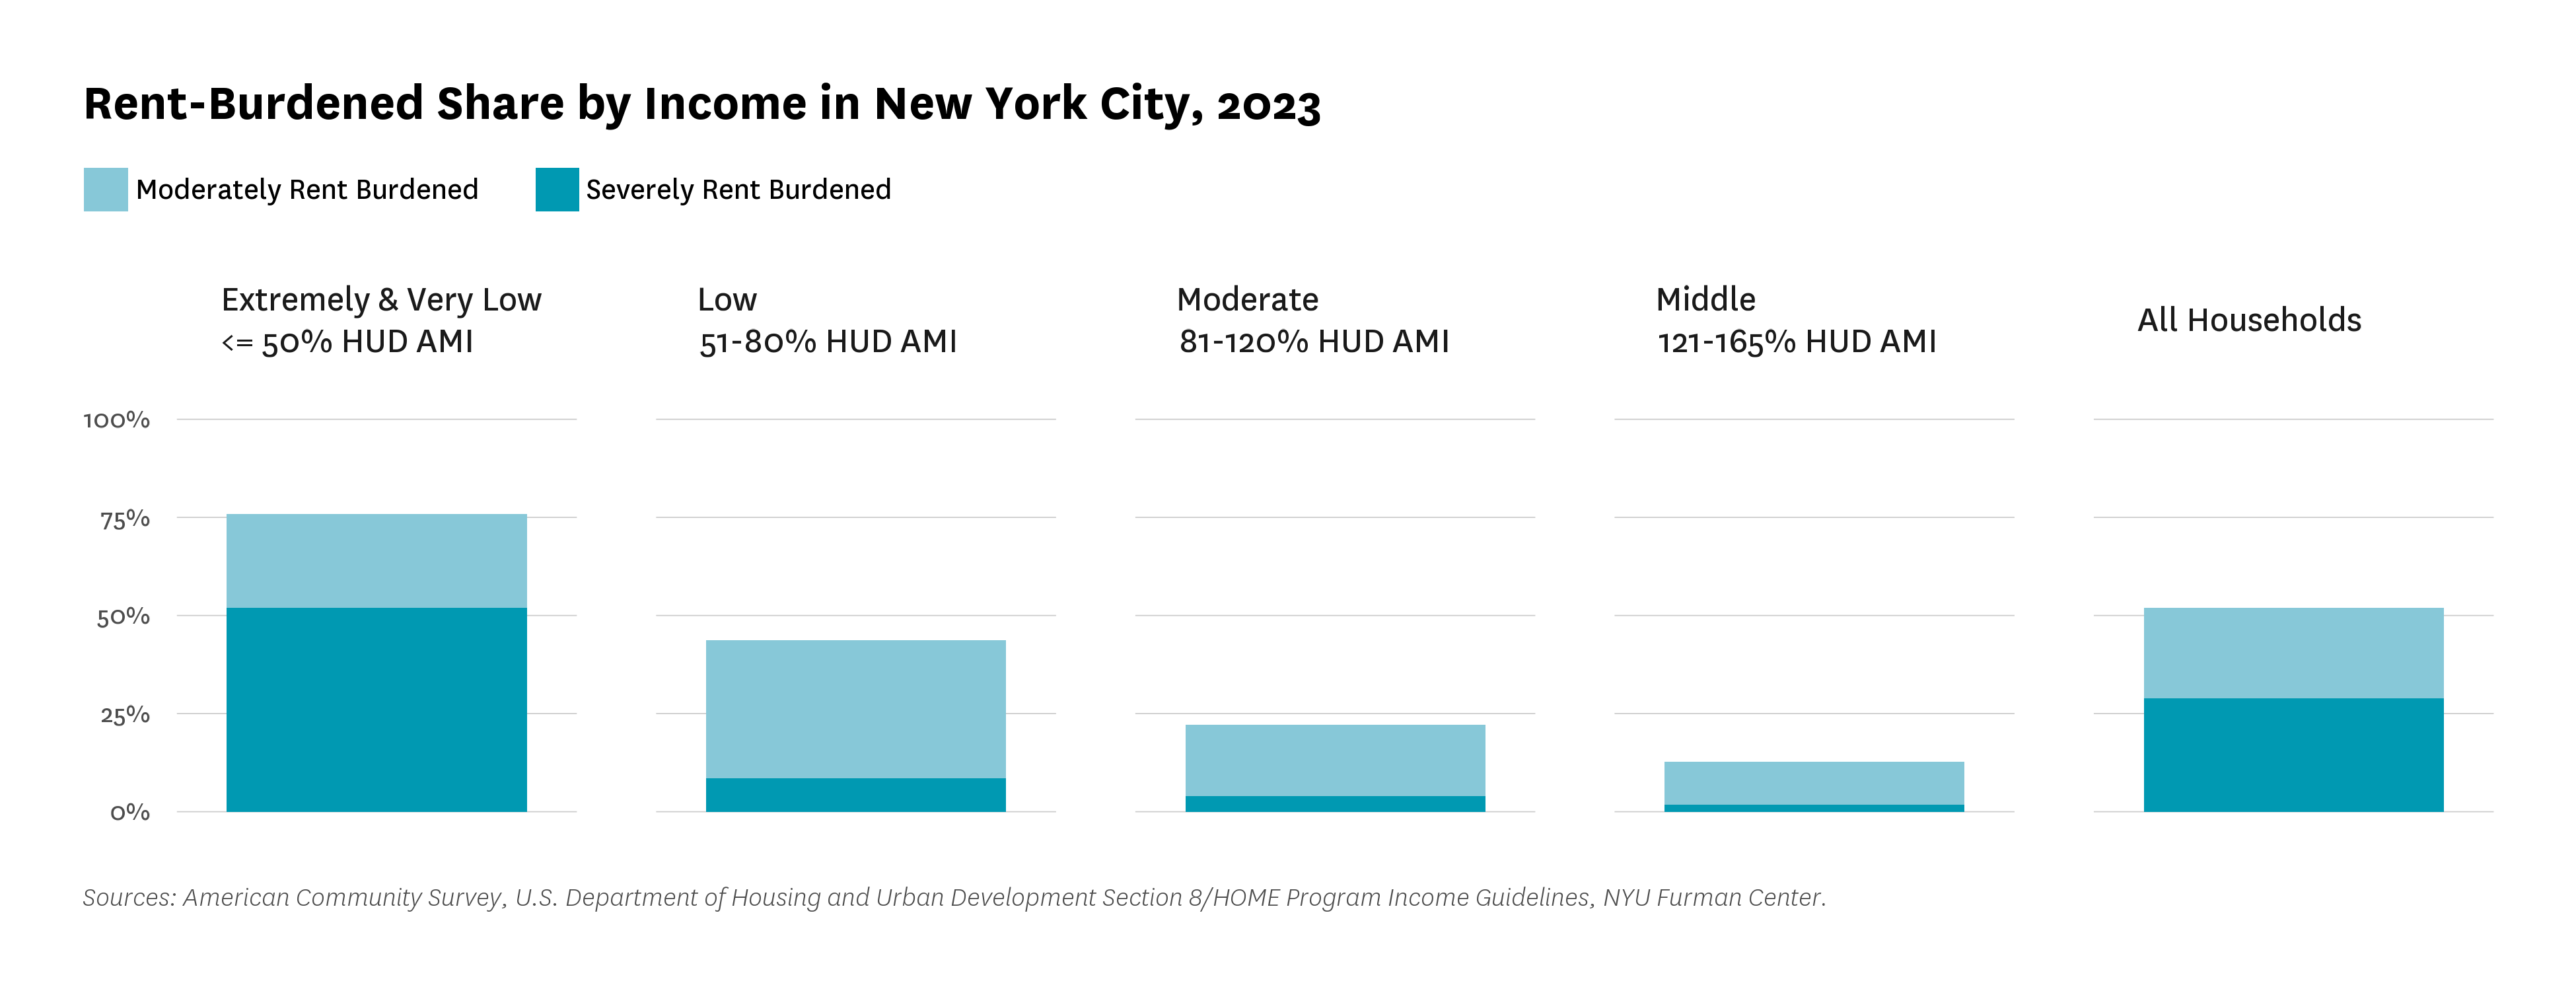
Rent burdens are persistent among New York City renters. In 2023, more than half of renter households paid at least 30 percent of their pre-tax income toward rent, and about one in four paid more than half (Figure 2).3 Rent burdens were especially acute among very low- and extremely low-income renters (earning less than $63,550 for a family of three in 2023). More than half of those households were severely rent burdened, spending a majority of their income on housing costs.
Figure 2:
Characteristics of Rent-Stabilized Tenants and the Location of Rent-Stabilized Buildings
Data from the New York City’s 2023 Housing and Vacancy Survey (HVS) show that tenants in rent-stabilized apartments differ in measurable ways from occupants of market-rate housing and New York City Housing Authority (NYCHA) developments (Table 1).4 Rent-stabilized housing plays a central role in providing homes for lower- and moderate-income New Yorkers.
The median rent among all rent-stabilized households was about $1,500 in 2023, compared with $2,000 for market-rate renters and $560 for NYCHA tenants. The median household income for rent-stabilized households was roughly $60,000, equivalent to just below 40 percent of Area Median Income (AMI) for a three-person household at that time. By comparison, market-rate renters had a median income near $91,000 (about 70% AMI), while tenants in public housing had a median income of $20,600. About two-thirds of rent-stabilized households had incomes below 80 percent of AMI, classified by the HVS as “low-income” under the Department of Housing and Urban Development definition.
Although rents in stabilized apartments are typically lower than those in unregulated units, many tenants still face affordability challenges. About one-quarter of rent-stabilized households were severely rent burdened, spending more than half their household income on rent. This was slightly higher than the share of unregulated renters who experienced severe rent burden (24.2% versus 21.8%). These figures indicate that rent stabilization provides relative affordability but does not eliminate rent burdens for many tenants.
Table 1:
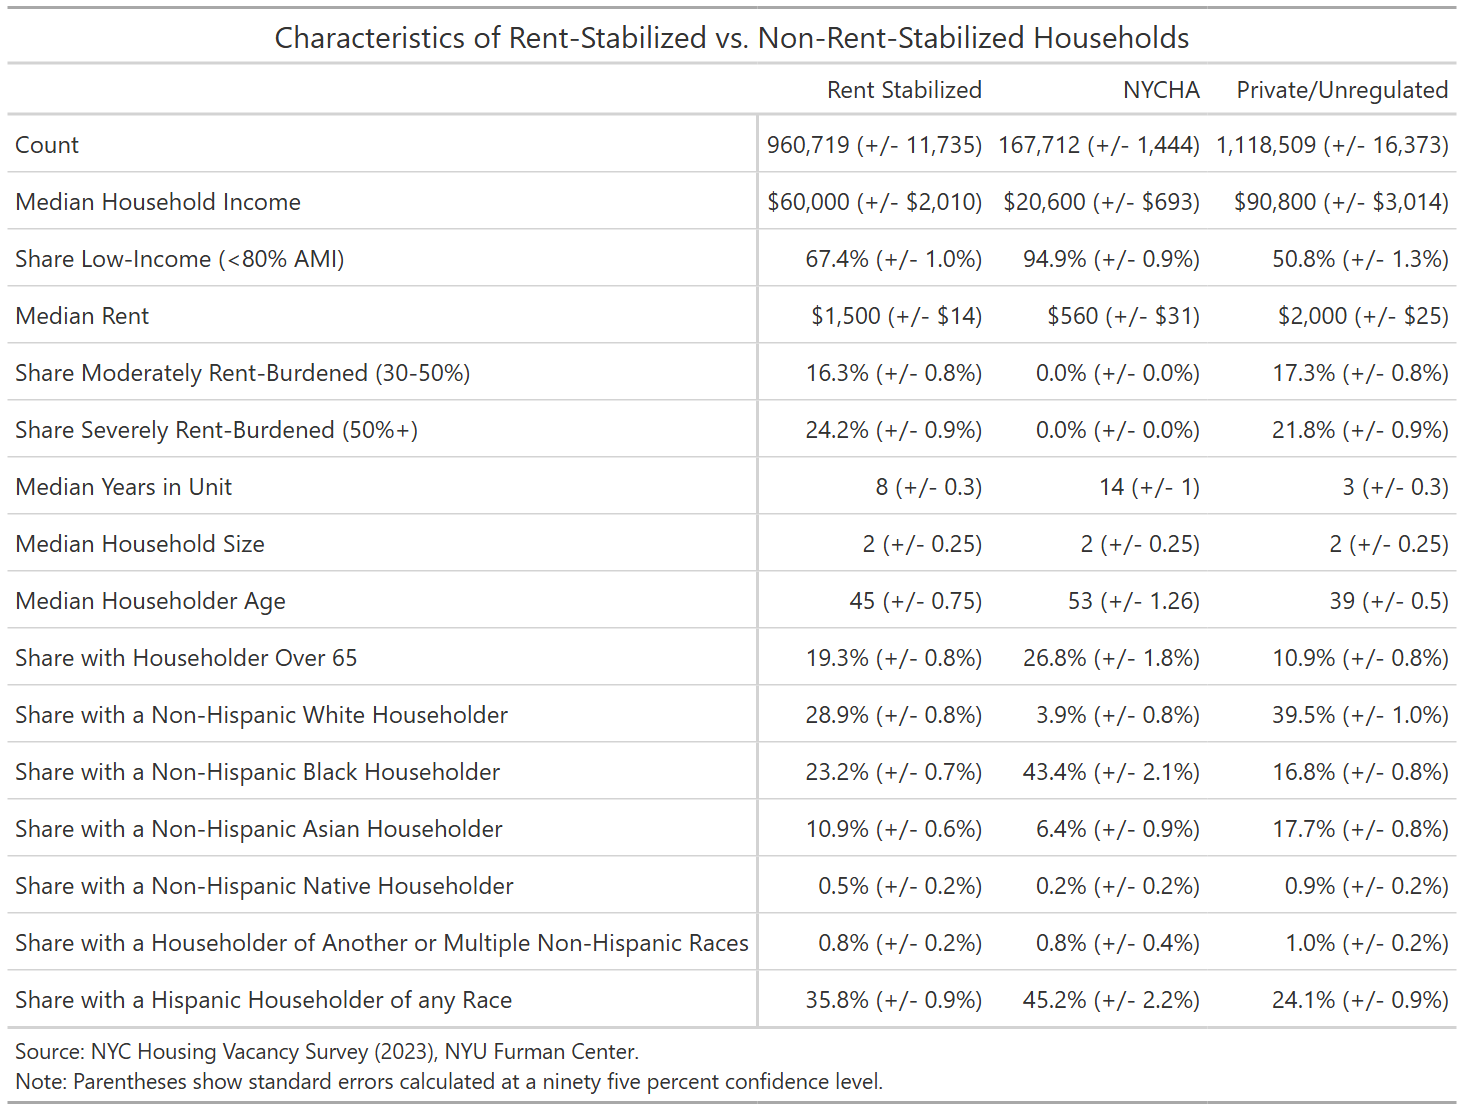
Rent-stabilized households also differ demographically. The median head of household was 45 years old, with an average tenure of eight years in the same unit. This was longer than the typical stay of unregulated renters (three years) but shorter than the 14-year median in NYCHA owned properties. Rent-stabilized tenants were more likely to be Black or Hispanic and less likely to be white or Asian than households in market-rate housing.
The location of rent-stabilized housing is also central to understanding its role in the city’s housing landscape. Significant concentrations of rent-stabilized apartments are found across community districts in four boroughs, Staten Island being the exception. Figure 3 provides an interactive map to view these geographic patterns, showing the count of rent-stabilized units by community district and census tract.
Figure 3:
Rent-Stabilized Housing Within New York City’s Rental Market
New York City’s rental housing market encompasses a wide range of ownership types, building sizes, and regulatory frameworks. According to 2025 Department of Finance (DOF) Rent Stabilization Fee records, there were more than 966,000 registered rent-stabilized apartments across the city, representing about 42 percent of all rental units and roughly 26 percent of all housing units citywide.5 DOF records undercount the number of rent-stabilized units, but provide useful granularity. For comparison, the New York State Department of Homes and Community Renewal recorded slightly more than 1 million rent-stabilized units in 2025 in their rent regulation data dashboard, a difference of about 46,000 units between the two sources.6
Over the past few decades, the number of rent-stabilized apartments in New York City steadily declined as a result of deregulation policies. 349,000 rent-stabilized apartments were removed from regulation since 1994, while others have been added in exchange for tax exemptions and other subsidies. The resulting net loss is 138,000 units citywide. Nearly half of those removals occurred through high-rent vacancy deregulation, a policy that allowed landlords to remove apartments from stabilization once a tenant left and the legal rent surpassed a certain threshold. This practice ended with the passage of the Housing Stability and Tenant Protection Act (HSTPA) in 2019, which prohibited deregulation due to rent level or vacancy. Since then, most remaining deregulations have occurred in a much narrower set of buildings, specifically, properties where state law allows units to exit rent stabilization once a tax exemption expires and certain rent thresholds are met.7
Other Forms of Rental Housing
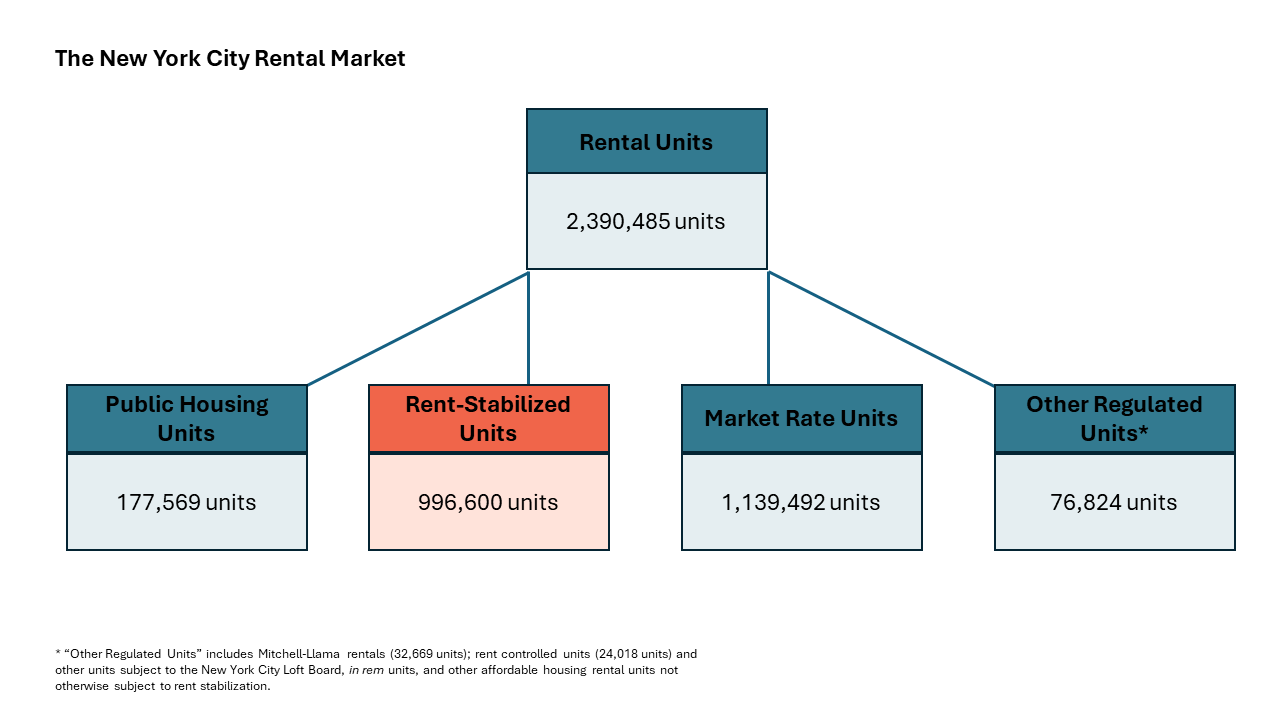
Several other major categories make up the remainder of the city’s rental stock (see Figure 4):
- “Unregulated” or “Market Rate” apartments: An estimated 1,139,4928 apartments are unregulated. In addition to apartment buildings fully free of income restrictions and/or rent stabilization requirements, these include apartments in cooperative and condominium buildings (about 265,000 rental units combined),9 smaller multifamily homes, and other privately owned properties.
- Public Housing: The New York City Housing Authority (NYCHA) manages 177,569 public housing apartments.10
- Other Rental Units: Roughly 76,820 apartments are covered by legacy programs such as Mitchell-Lama and rent control, as well as smaller state and federal initiatives.11
- Mitchell-Lama housing: Provides approximately 32,669 rental apartments to moderate-income households at below-market rents.12
- Rent-controlled apartments: Technically distinct from rent-stabilized housing, though they are often grouped together under the broader category of “rent-regulated” housing, rent-controlled apartments are those constructed before 1947 in which the same tenant has been living continuously since 1971 (or, in narrow circumstances, someone who shared the apartment with that tenant). An estimated 24,018 rent-controlled apartments are in New York City.13
Figure 4: All Housing Units by Building Type, New York City
While we focus on rental housing, it is important to note that roughly one-third of New York City’s homes are owner-occupied. This segment includes single-family houses, small multi-family properties with resident owners, condominiums, and cooperatives. Rent stabilized apartments also appear within New York City’s homeownership stock. Some cooperatives contain rent-stabilized units that remained after buildings converted from rental to cooperative ownership; an estimated 16,000 rent-stabilized units fall into this category.
In summary, rent-stabilized housing plays a central role within New York City’s broader rental landscape. It provides long-term affordability and stability for a large share of the city’s renters and remains one of the most significant sources of below-market rents in the private housing stock.
Rent-Stabilized Apartments and the Buildings that Contain Them
Rent-stabilized apartments are found in a wide range of buildings across New York City, from older walk-ups where nearly all units are stabilized to newly constructed high-rises that include a share of income-restricted, rent-stabilized units. In some mixed-income developments, units that rent at market-rate prices are covered by rent stabilization. This variation matters: aggregate data obscure the different financial and operational pressures facing each segment of the stock, which vary by age, financing structure, and exposure to regulation.14 To address this complexity, this series uses consistent segment definitions to enable clear comparison of conditions, revenues, and financial pressures across different types of rent-stabilized buildings.
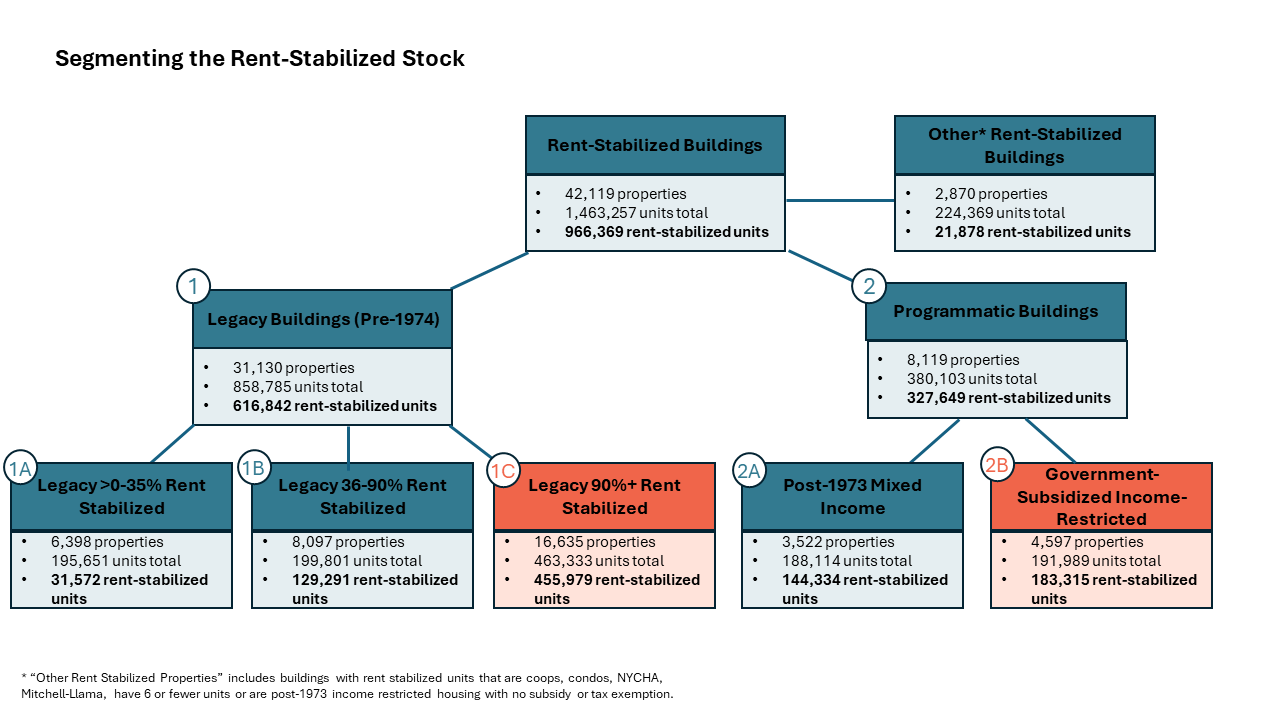
The bulk of rent-stabilized apartments falls into two categories, which we define according to how properties entered the system and the regulatory conditions that shape them: Legacy and Programmatic.
Category One: Legacy Rent-Stabilized Buildings (Legacy Buildings, or Legacy Properties)
Legacy buildings are properties with six or more units that entered rent stabilization because they were built before 1974 and are not subject to building-level subsidy or regulatory agreements. Some legacy buildings may have participated in the J-51 tax exemption and abatement program, but J-51 is not a long-term affordability program and does not change their classification in this analysis.15
Legacy Properties
Number of Units: There are 616,842 rent-stabilized apartments in legacy properties (65% of all rent-stabilized units). Legacy properties also house 241,943 market rate apartments, a reflection of the history of deregulation described above. In total, they hold 858,785 apartments. They can be divided into three subsegments, which the following data briefs examine based on the share of rent-stabilized units.
Subsegments:
- >0–35 percent stabilized (“>0-35%”):
- 31,572 stabilized units (in legacy properties with a total of 195,651 residential units).
- Median monthly per-unit rent: $2,386.16
- 36–89 percent stabilized (“36-89%”):
- 129,291 stabilized units (in legacy properties with a total of 199,801 residential units).
- Median monthly per-unit rent: $1,698.
- 90 percent or more stabilized (“90%+ segment”):
- 455,979 stabilized units (in legacy properties with a total of 463,333 residential units).
- Median monthly per-unit rent: $1,344.
Of the three subsegments, 90%+ properties are of most concern because they derive all or nearly all of their operating revenue from rent-stabilized apartments, they are especially dependent on the rent from regulated rents and therefore are more directly exposed to changes in rent-setting policy or rising operating costs. Some of the 90%+ properties may also earn limited income from commercial space, but residential rents largely remain their primary revenue source. When reviewing income, expenditure, net operating income, and imputed rent trends we remove properties with commercial space from our analysis to focus on trends in the residential market.17
Category Two: Programmatic Rent-Stabilized Buildings (Programmatic Buildings or Programmatic Properties)
Programmatic properties are government-subsidized buildings that are stabilized because of their participation in public financing or tax incentive programs (often referred to as “subsidy programs”) that require compliance with rent stabilization law as a condition of receiving financial benefits. 56 percent of units in this segment were built after 1973.
- Number of Units: There are 327,649 rent-stabilized apartments in programmatic properties (35% of all rent-stabilized units). Programmatic properties hold a total of 380,103 apartments.18
- Subsegments:
- Government-subsidized, income-restricted: We estimate that 183,315 stabilized units in government-subsidized properties are primarily income-restricted. These buildings have a total of 191,989 total units (95.5% of which are rent stabilized). Government-subsidized, income-restricted properties used subsidy programs that require apartments to be income-restricted affordable housing; they are typically governed by a “regulatory agreement” between the City of New York or State of New York and the property’s owner. According to our CoreData.nyc database, the most common programs in this segment, which are not mutually exclusive, include the Low-Income Housing Tax Credit (LIHTC), the Article XI tax exemption, the Low-Income Affordable Marketplace Program (LAMP), the Participation Loan Program (PLP), and the 420-c tax exemption. But many of these properties used a variety of City and State funding sources to be built as low-income housing. This category includes buildings built both before and after 1974.19
- Median Rent: $1,249.
- Government-subsidized, income-restricted: We estimate that 183,315 stabilized units in government-subsidized properties are primarily income-restricted. These buildings have a total of 191,989 total units (95.5% of which are rent stabilized). Government-subsidized, income-restricted properties used subsidy programs that require apartments to be income-restricted affordable housing; they are typically governed by a “regulatory agreement” between the City of New York or State of New York and the property’s owner. According to our CoreData.nyc database, the most common programs in this segment, which are not mutually exclusive, include the Low-Income Housing Tax Credit (LIHTC), the Article XI tax exemption, the Low-Income Affordable Marketplace Program (LAMP), the Participation Loan Program (PLP), and the 420-c tax exemption. But many of these properties used a variety of City and State funding sources to be built as low-income housing. This category includes buildings built both before and after 1974.19
Like 90%+ legacy properties, these buildings are of most concern because they rely primarily on rent-regulated residential income to cover operating expenses. Although many benefit from ongoing tax exemptions and were originally underwritten through standard affordable housing financing programs, they have limited flexibility to respond to rising costs.
- Mixed-income: There are 144,334 stabilized units in mixed-income buildings. These buildings have a total of 188,114 residential units (76.7% of which are rent stabilized, including units with rents initially set at market rates, but without any limits on the initial income of tenants). These developments were all built after 1973, and were commonly built using the 421-a tax exemption (or more recently using its successor program, 485-x). These buildings either combine income-restricted and market-rate apartments within a single building, or, in the case of some older 421-a properties, are all rent stabilized but without any income restriction requirements.20
- Median Rent: $2,432.
Figure 5: Rent-Stabilized Units By Building Type, New York City
The Subsegments of Most Concern
This series focuses on two subsegments that play a central role in the city’s affordable rental housing and face the greatest constraints on financial flexibility:
- Legacy 90%+ Rent-Stabilized Buildings: Constructed before 1974, with 90 percent or more stabilized units and no subsidy beyond as-of-right tax relief.
- Government-Subsidized, Income-Restricted Buildings: Properties with 90 percent or more stabilized units and active regulatory agreements that impose income restrictions on most if not all apartments.
Together, these subsegments house hundreds of thousands of low- and moderate-income New Yorkers and exhibit the clearest signs of fiscal strain due to rising operating costs, aging buildings, and limited revenue growth.
The first brief examines Legacy 90%+ Rent-Stabilized Buildings in detail, and the second focuses on Government-Subsidized, Income-Restricted Buildings.
Technical Appendix:
This analysis leverages a number of data sets to identify rent-stabilized units and categorize them by property type. Below, we detail our data sources and methodology and highlight important limitations.
Identifying Properties with Rent-Stabilized Units
To identify properties with rent-stabilized units, we use data on rent-stabilized unit counts from the Department of Finance’s (DOF) property tax bills scraped by John Krauss in 2017 (covering 2014–2017), and JustFix.nyc from 2018–2023; the most recent year of data was pulled by the NYU Furman Center. We use rent-stabilized data dating back to 2014 to improve the quality of our rent-stabilized unit identification.
We then match our rent-stabilized unit counts at the property (tax lot) level with information on property characteristics from the New York City Department of City Planning’s (DCP) PLUTO dataset and DOF’s tax exemption data. We use those data, along with data on housing programs from our CoreData.nyc Subsidized Housing Database to limit our pool for the purposes of this analysis to properties with six or more units and exclude NYCHA, Mitchell-Lama, and cooperative properties.21
Property Classification
Legacy Rent-Stabilized Properties (Pre-1974)
Legacy rent-stabilized properties contain units that are stabilized under the ETPA solely by virtue of their age (built before 1974) and physical characteristics (six or more units). These properties do not participate in property-level subsidy programs, except that some took advantage of J-51 tax exemption and abatement.
Mixed Income Properties (Post-1973)
Mixed income properties contain rent-stabilized units that were built after 1973, and include both government-subsidized properties (with >0-89% of units rent-stabilized) and properties with property tax abatements and exemptions (J-51 and 421-a). This group also includes properties with no exemption or subsidy of record if they were built after 2020, to account for a lag in data indicating participation in tax exemption and abatement programs.
Government-Subsidized, Income-Restricted Properties (All Years)
Government-subsidized, income-restricted properties containing rent-stabilized units that were built before 1974 with either Article XI, DAMP, the New York State Alternative Veterans Property Tax Exemption, the New York State Urban Development Corporation, or other subsidies, as well as properties built before 1974 participating only in the 421-a tax program. This group also includes properties that were built after 1973 with a 25-year 421-a benefit outside the Geographic Exclusion Area in place at the time, and any 421-a benefit alongside 420-c, LAMP, LIHTC, PLP, and other HPD programs. Properties benefitting from those programs alone, without 421-a, were also included. The inclusion or exclusion of properties based on their version of the 421-a program was based on our knowledge about program design and analysis of properties within each exemption category.
Other Properties (Post-1973)
This group includes properties that contain rent-stabilized units that were built after 1973 and before 2020 with no exemption or subsidy program identified.
NOPV Data on Property-Level Income, Expenses, NOI, and Imputed Per-Unit Rents
Throughout this series, we present financial trends in both nominal and inflation-adjusted (“real”) terms. Nominal figures show the dollar amounts reported at the time; real figures adjust for changes in consumer prices and therefore reflect changes in purchasing power. Because operating costs and revenues can grow at different rates relative to inflation, real trends provide the clearest view of financial pressure across segments.
The two briefs rely primarily on Notice of Property Value (NOPV) data from the Department of Finance (DOF) for information on property-level income, expenditures, and net operating income. When working with the NOPV data, we restrict our sample to properties without commercial square footage because the underlying DOF data does not allow us to isolate residential income from commercial income, which prevents meaningful comparison of residential operating performance. We also remove properties that report 0 income or expenses in any given year from 2019 to 2025 to allow for the most accurate comparison of property finances over time. This limits our universe of legacy properties for the purposes of analyzing NOPV data to 10,447 properties containing 405,396 units and 343,043 rent-stabilized units, and the subcategory of legacy 90%+ properties to 6,578 properties with 278,662 units and 276,871 rent-stabilized units. NOPV expenditures do not include property taxes, and we analyze taxes separately rather than combining them with operating expenses. We impute average unit-level rents based on reported gross income for properties without commercial square footage. This approach may understate actual rent levels because revenues in the NOPV data are affected by nonpayment and vacancies.
NOPV data is based on information drawn from owner-reported Real Property Income and Expense (RPIE) statements. Owners of exclusively residential properties with eleven or more units, and owners of properties with seven to ten residential units and more than one commercial unit, must file RPIE statements if the property has an assessed value above $40,000. DOF releases NOPV data two years after collection, and the figures have been adjusted and trended forward by DOF. For this reason, the NOPV data is not a perfect reflection of the financial status of a property as originally reported. Our analysis relies on NOPV data based on RPIE filings covering the years 2017 to 2023 and released between 2019 and 2025. When adjusting for inflation, we use the Consumer Price Index for the year of release.
DOF does not rely solely on owner-reported values when preparing assessments. As detailed in the DOF Assessment Guidelines,22 the agency evaluates reported expenses against benchmark expense ratios that vary by building characteristics and substitutes standardized assumptions when reported values fall outside the benchmark ratio. As a result, some expense figures in the public data are adjusted, and will differ from the costs owners actually incur.
Taken together, these steps align our analysis with the data that form the basis of the Rent Guidelines Board’s annual deliberations while allowing us to segment the rent-stabilized stock in ways that highlight meaningful differences across building types.
Data on Recent Affordable Housing Projects
We received anonymized data on a subset of recently-completed, government-subsidized properties. These data cover about 40 properties comprising more than 5,000 units that were financed with LIHTC. While the data provides a granular look into residential and commercial income as well as line item operating expenses, it is unclear how these properties compare to the broader set of government-subsidized, income-restricted properties. As a result, the findings that rely on this data should be interpreted with caution and are limited in their generalizability.
HPD Data on Property Sales
The New York City Department of Housing Preservation and Development (HPD) provides comprehensive sales data to the Furman Center annually. This dataset includes deed dates, prices, building classifications, and square footage. For the purposes of this analysis, only sales involving properties with reported residential square footage are considered.
HPD Data on Complaints and Violations
To assess the extent of physical distress in our properties of interest, we rely on complaint and violation data collected by the New York City Department of Housing Preservation and Development (HPD). We report violations based on the date they were filed, whether they remain open or have since been closed.
Complaints are submitted by the public through the 311 Citizen Services Center, Code Enforcement Borough Offices, or the internet.
Violations are issued by HPD inspectors for conditions that have been confirmed to violate the New York City Housing Maintenance Code (HMC) or New York State Multiple Dwelling Law (MDL). the HMC or MDL. Violations are issued in four classes: Class A (non-hazardous), Class B (hazardous), Class C (immediately hazardous), and Class I (information orders).
Violation data can provide a snapshot of the physical quality of a property by suggesting whether conditions are improving or deteriorating over time. However, these data cannot isolate specific causes behind changing conditions, and should be interpreted with caution.
Table 1:

- See, for example: RentHop. (n.d.). Average rent in New York, NY. https://www.renthop.com/average-rent-in/new-york-ny; The Corcoran Group. (2025, September). NYC residential rental market report: September 2025. Inhabit. https://inhabit.corcoran.com/nyc-residential-rental-market-report-september-2025/; Zillow Group, Inc. (2025, November 7). Average rental price in New York & market trends | Zillow Rental Manager. https://www.zillow.com/rental-manager/market-trends/new-york-ny ↩
- U.S. Bureau of Labor Statistics. (n.d.). Consumer Price Index for All Urban Consumers (CPI-U), Medical care, New York-Newark-Jersey City, NY-NJ-PA. https://data.bls.gov/timeseries/CUURS12ASAM?output_view=data&include_graphs=true; U.S. Bureau of Labor Statistics. (n.d.). Consumer Price Index for All Urban Consumers (CPI-U), Food, New York-Newark-Jersey City, NY-NJ-PA. https://data.bls.gov/timeseries/CUURS12ASAF1?output_view=data&include_graphs=true; U.S. Bureau of Labor Statistics. (n.d.). Consumer Price Index for All Urban Consumers (CPI-U), Transportation, New York-Newark-Jersey City, NY-NJ-PA. https://data.bls.gov/timeseries/CUURS12ASAToutput_view=data&include_graphs=true ↩
- Because rent burdens are calculated using pre-tax income, the actual share of renters’ take-home pay devoted to housing is substantially higher. A household earning $60,000 a year and spending 30 percent of its income on rent (the federal affordability threshold) actually spends about 40 percent of its paycheck on rent, after accounting for the local, state and federal taxes that household would pay. For those considered severely rent burdened, the share can exceed two-thirds of take-home income. ↩
- Note: Table 1 does not include rent-controlled and “other rental” housing as defined in the 2023 New York City Housing and Vacancy Survey. Margins of error are shown in parentheses, indicating the range within which the true value is expected to fall. ↩
- Figure 4 shows a higher count of rent-stabilized apartments (996,600), compared to Figure 5 (966,369). The former is the estimate from the 2023 NYCHVS, which identifies units based on administrative data and self-reporting, and the latter reports the number of rent-stabilized apartments as identified in DOF tax bills (number of registered units). U.S. Census Bureau & New York City Department of Housing Preservation and Development. (2023). New York City Housing Vacancy Survey (NYCHVS), 2023. https://www.nyc.gov/site/hpd/about/research.page ↩
- New York State Department of Homes and Community Renewal. (2025, Sept.) Rent Registration Data Dashboard. https://nyshcr.maps.arcgis.com/apps/dashboards/4acf23d988e344d39db749befa881efe ↩
- New York City Rent Guidelines Board. (2025, May). Changes to the rent stabilized housing stock in NYC in 2024. https://rentguidelinesboard.cityofnewyork.us/wp-content/uploads/2025/05/2025-Changes-Report.pdf ↩
- U.S. Census Bureau & New York City Department of Housing Preservation and Development. (2023). New York City Housing Vacancy Survey (NYCHVS), 2023: Public Use File. https://www.nyc.gov/site/hpd/about/research.page ↩
- U.S. Census Bureau & New York City Department of Housing Preservation and Development. (2023). New York City Housing Vacancy Survey (NYCHVS), 2023: Public Use File. https://www.nyc.gov/site/hpd/about/research.page ↩
- Note: this count of NYCHA units is from 2024, while counts elsewhere in this section are from the 2023 NYCHVS. See New York City Housing Authority. (2024). NYCHA fact sheet.https://www.nyc.gov/assets/nycha/downloads/pdf/NYCHA_Fact_Sheet.pdf ↩
- “Other regulated units” in Figure 4 include 24,018 rent-controlled apartments, as well as 52,570 “other subsidized/regulated units” which include Mitchell-Lama units. Because the 2023 NYCHVS does not identify Mitchell-Lama units separately, we rely on a 2018 estimate from the Community Service Society, which identified 32,669 Mitchell-Lama units. See: Miranova, O. (2018, March). Closing the door: Subsidized housing at a time of federal instability. Community Service Society of New York. https://smhttp-ssl-58547.nexcesscdn.net/nycss/images/uploads/pubs/Closing_the_Door_FINAL_WEB.pdf For more information on the definition of other subsidized/regulated units, please see the 2023 NYCHVS: U.S. Census Bureau & New York City Department of Housing Preservation and Development. (2023). New York City Housing Vacancy Survey (NYCHVS), 2023. https://www.nyc.gov/site/hpd/about/research.page ↩
- For this count of Mitchell-lama properties, we rely on a 2018 estimate from the Community Service Society. Miranova, O. (2018, March). Closing the door: Subsidized housing at a time of federal instability. Community Service Society of New York. https://smhttp-ssl-58547.nexcesscdn.net/nycss/images/uploads/pubs/Closing_the_Door_FINAL_WEB.pdf ↩
- U.S. Census Bureau & New York City Department of Housing Preservation and Development. (2023). New York City Housing Vacancy Survey (NYCHVS), 2023: Public Use File. https://www.nyc.gov/site/hpd/about/research.page ↩
- We limit our examination of rent-stabilized properties to 6+ unit rental and condominium properties with 1 or more rent-stabilized units. We do not include rent-stabilized cooperatives in this analysis because little data is available about these units. ↩
- Properties with the J-51 tax exemption may include units that were previously deregulated and then reregulated as a condition of the exemption. As a result, some rent-stabilized units may have higher legal rents than units that were never deregulated, because they adjusted to market price, and then were required to be regulated again. ↩
- Median values are calculated from building-level average (imputed) rents. In other words, we take the median of per-building average rents, which summarizes the typical rent level across properties rather than across individual units. Average rents are estimated by dividing the total property income by the number of residential units among properties that contain no commercial square footage. Because factors such as rent nonpayment and vacancies will lower property-level income, this approach provides a lower-bound estimate of actual unit-level rents. In addition, we are unable to determine if imputed rents are rented below their legal regulated rents (‘preferential rents’). A 2013 IBO report estimated that roughly 23 percent of registered stabilized units at the time had preferential rents, and a 2019 IBO report found that 257,000 apartments had preferential rents in 2017. Since the 2019 Housing Stability and Tenant Protection Act (HSTPA), preferential rents must remain in place for the duration of the tenancy. ↩
- We analyze these metrics using the Department of Finance’s Notice of Property Value (NOPV) data, and we exclude properties without commercial space and those with zero income or expenses. These exclusions limit our universe of properties; for example, among 90%+ legacy properties, the number of residential units declines from 463,333 to 278,662. For more information, please see the appendix. ↩
- In addition, 347 properties built after 1973 without an exemption or a subsidy contain 3,844 rent-stabilized units, and a total of 30,333 units. For more information, please see the “other” category in Table 1 of the technical appendix. ↩
- For more information on the programs included in this category, please see Table 1 in the methodology. ↩
- For more information on the definition of buildings in this category, please see Table 1 in the methodology. ↩
- For more information on the methodology for the Subsidized Housing Database, please see: NYU Furman Center. (n.d.). Methodology: Subsidized Housing Database. https://www.furmancenter.org/coredata/userguide/methodology ↩
- New York City Department of Finance. FY 2025 guidelines for properties valued based on the income approach: Including office buildings, retail, and residential properties. https://www.nyc.gov/assets/finance/downloads/pdf/24pdf/fy25-assessment-roll-guidelines.pdf ↩