
State of the City's Housing Stock 2025
In this section, we examine housing production, rent stabilization, and affordability trends across New York City’s housing stock. New housing production reached a milestone in 2025, with residential completions rising to the highest annual total since we began tracking this indicator in 2010, likely driven by a surge of permits filed in 2022 before the expiration of the 421-a tax exemption. Meanwhile, permitting activity showed modest signs of recovery but remained far below pre-2022 levels. While the number of completed market rate units increased year-over-year, the number of government-subsidized units fell by almost 10 percent in 2025. For the first time, this chapter also includes counts of rent-stabilized units in a set of defined categories, which we will now begin to track over time.
Permitting and Completion Trends Across All Building Sizes
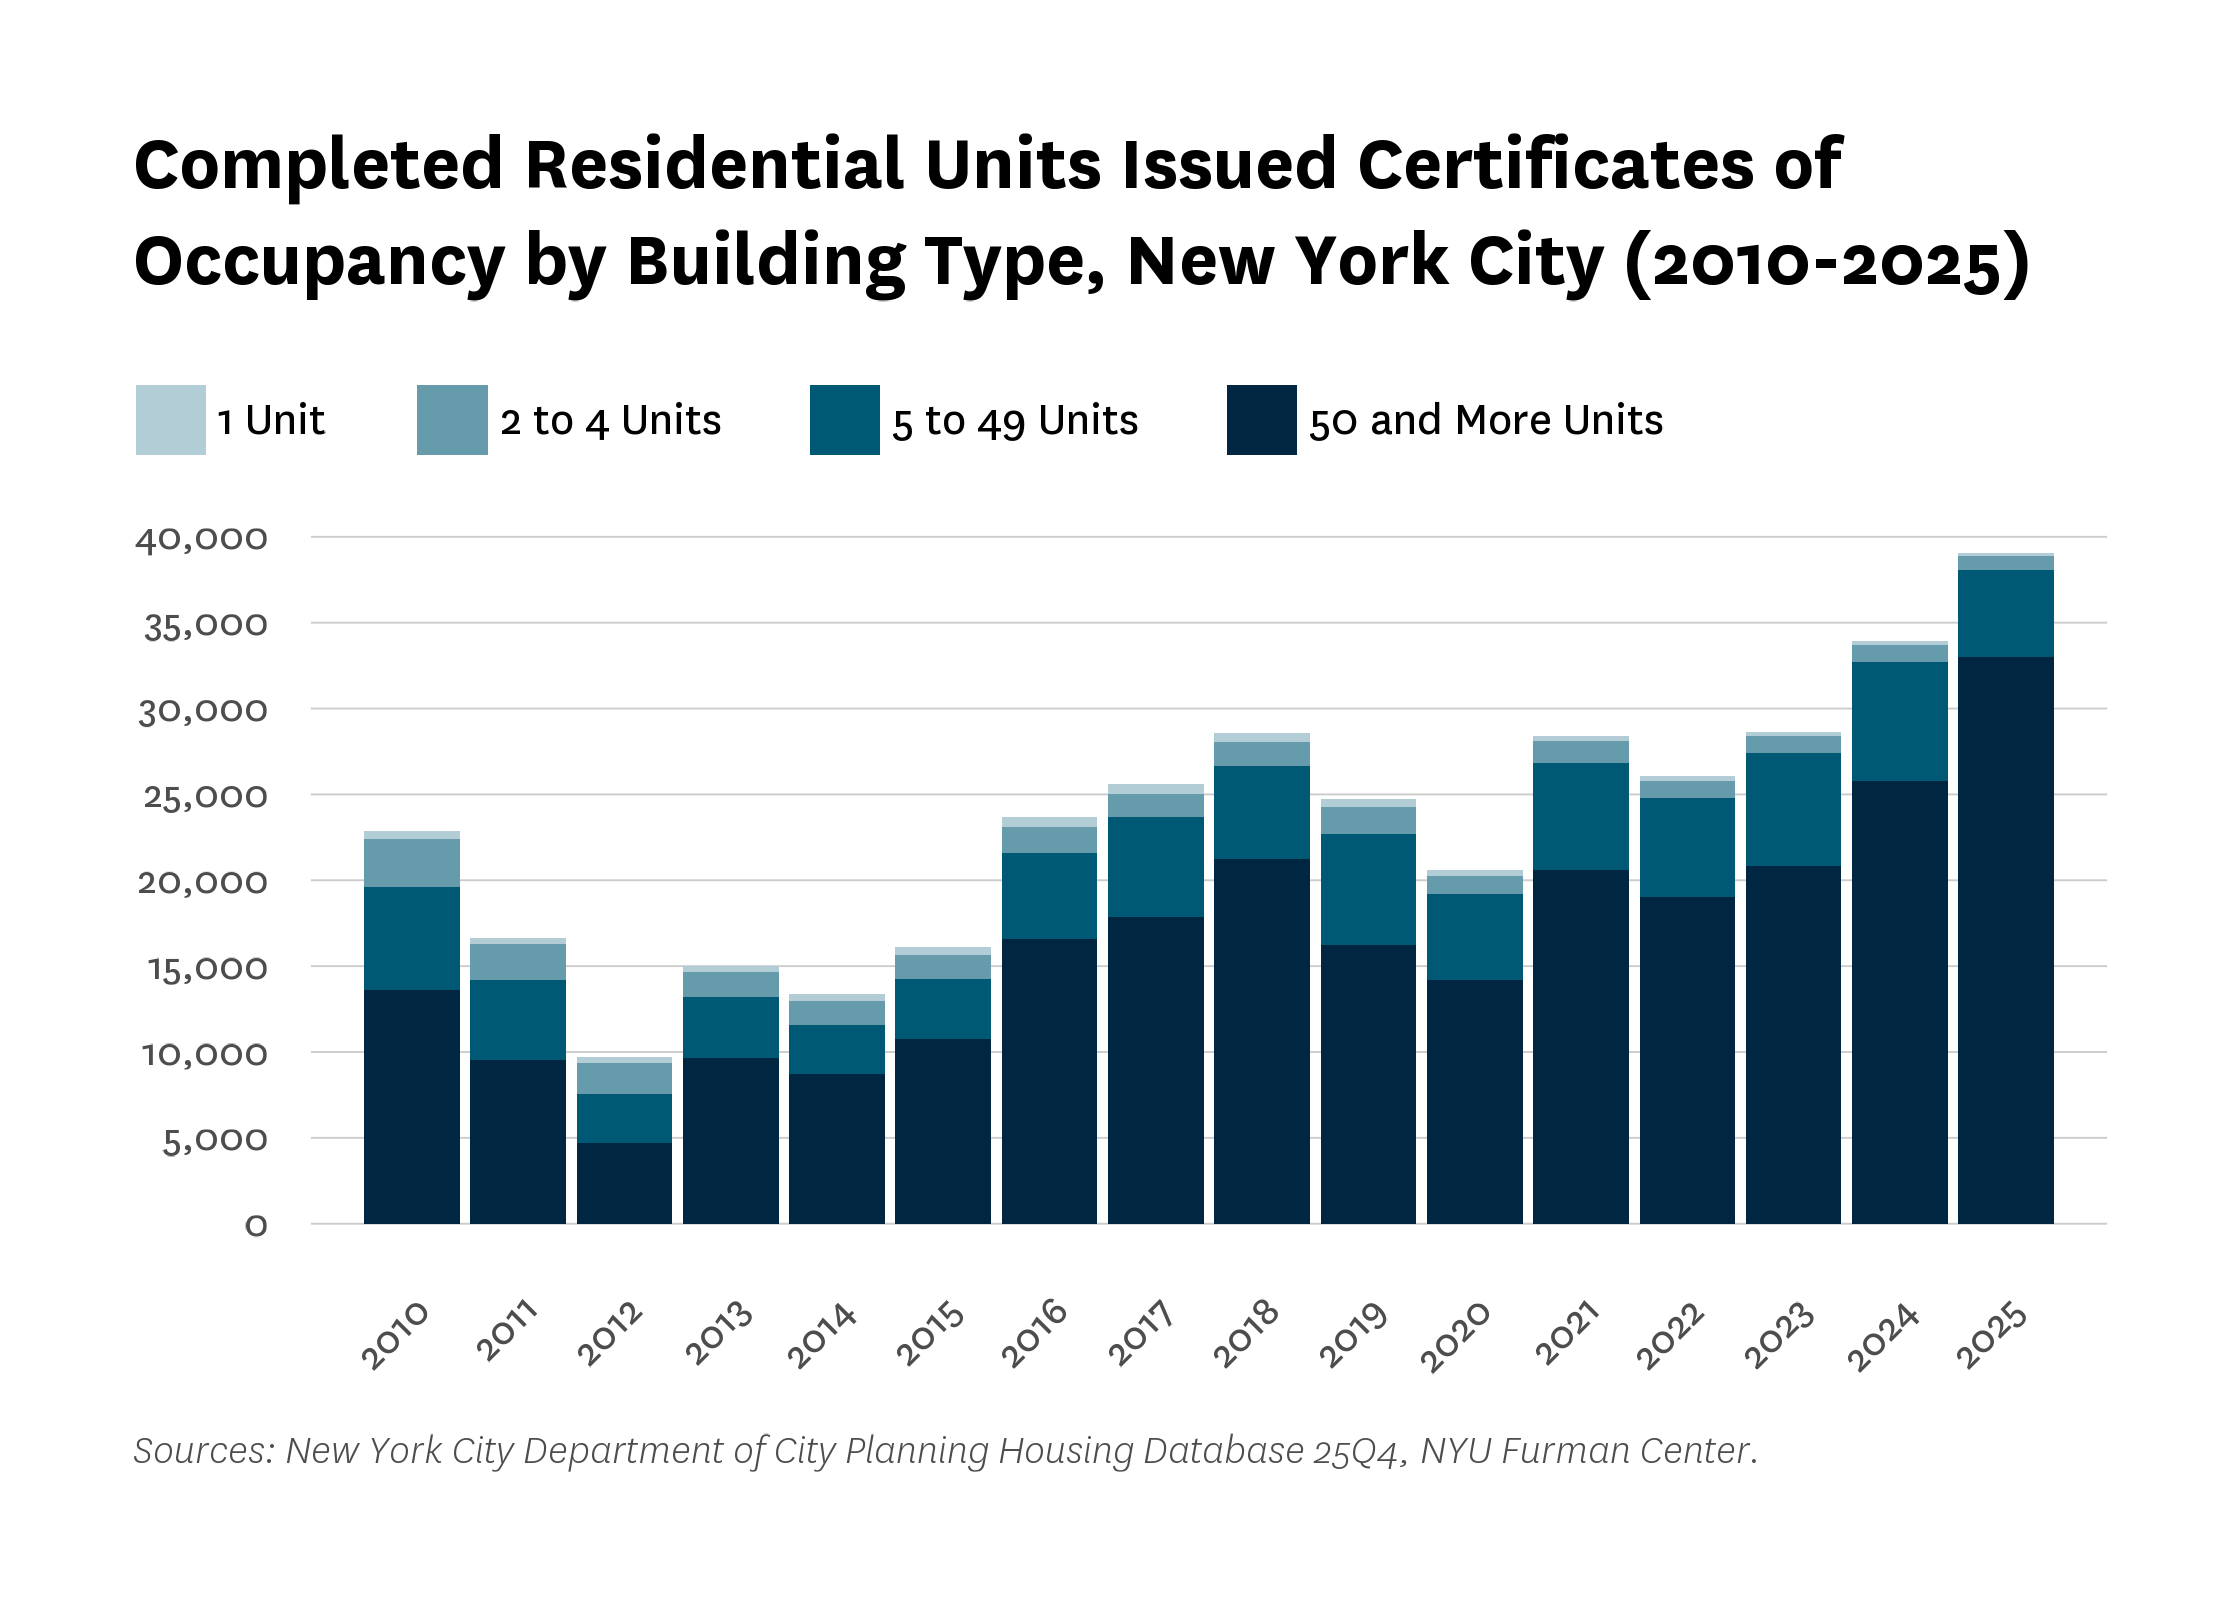
The number of units completed citywide rose to 39,073 in 2025, a 15.2 percent increase over the prior year and the largest annual total recorded since at least 2010 (Figure 1). This surge was driven by large multifamily buildings of 50 or more units, which accounted for 32,989 completions, nearly 85 percent of the citywide total. Completions of 1–49 unit buildings declined, with 1-4 unit buildings together contributing fewer than 1,000 units.
Figure 1:
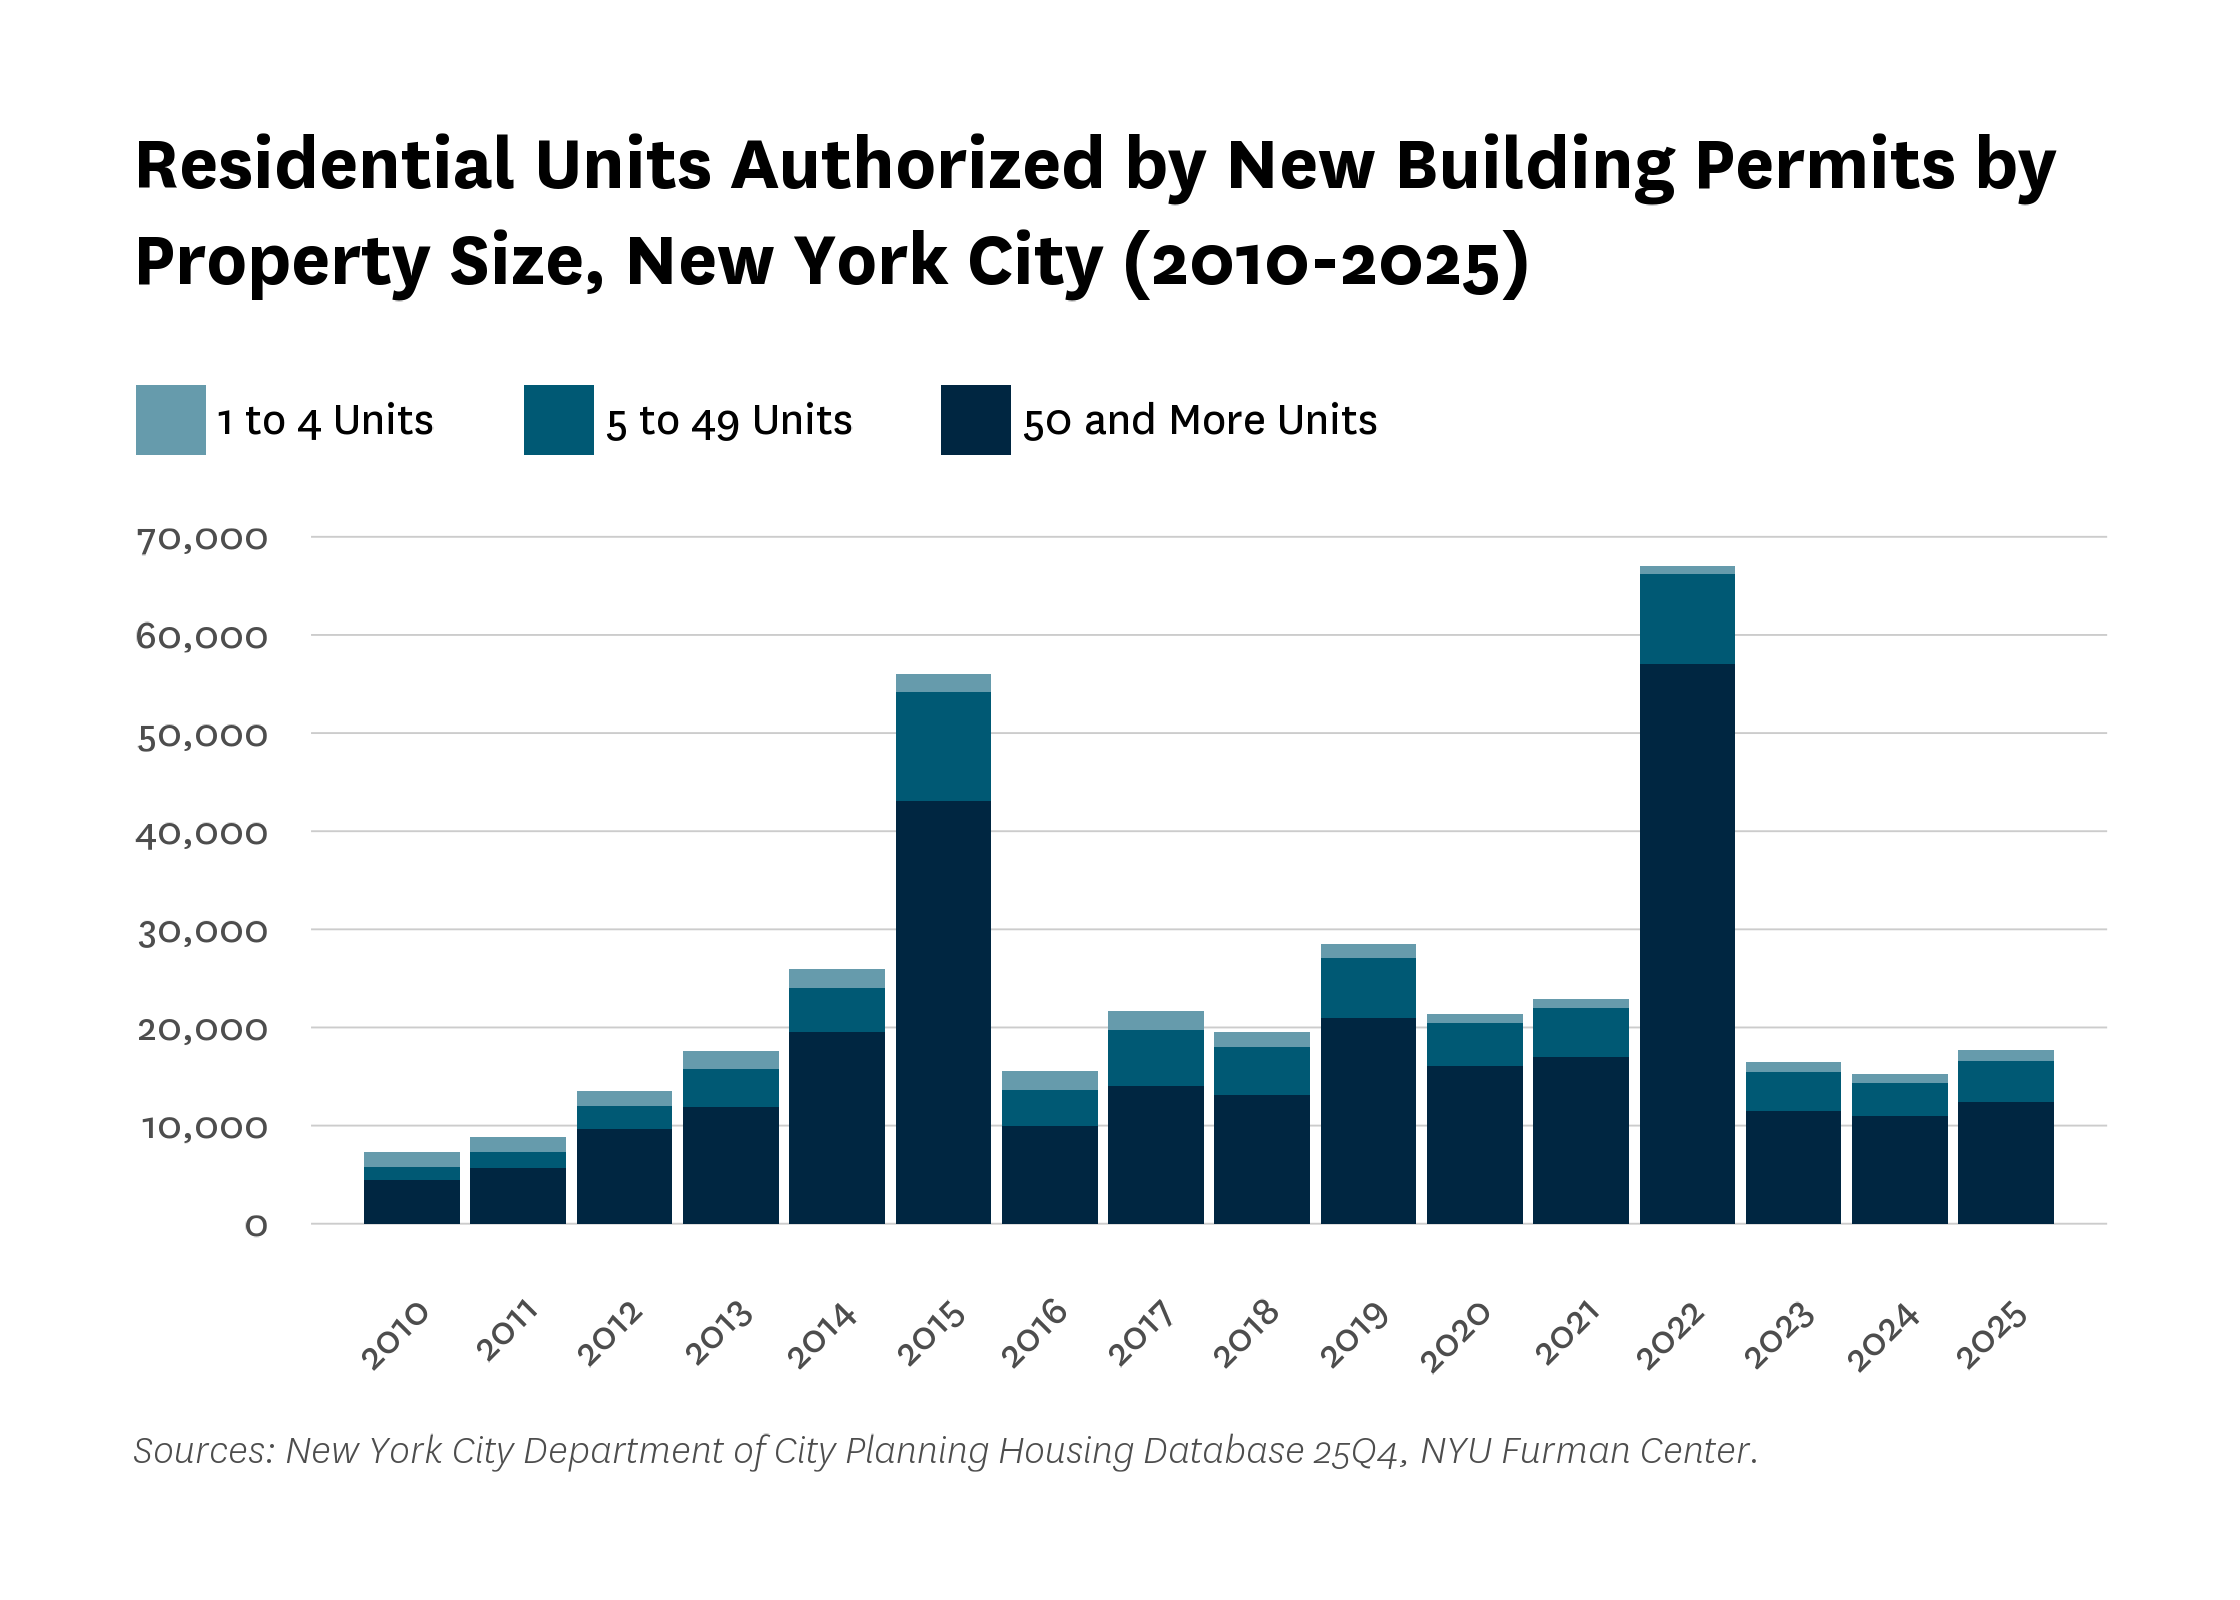
Permitting activity remained below historical norms in 2025 (Figure 2). A total of 17,669 units were authorized. This represents a 15.6 percent increase from 2024 but still a 73.7 percent decline from the 2022 peak. Large-scale developments continued to dominate, with 50+ unit buildings accounting for 70.1 percent of permitted units. Small buildings in the 1–4 unit range ticked up slightly to 1,089 units, remaining a marginal share of overall activity.
Figure 2:
Affordable Housing as a Share of New Multifamily (4+ Unit) Construction
While the above figures describe overall production trends, the following section looks more closely at how much of this new housing has been income-restricted. In this section, we focus on multifamily buildings with four or more units—the segment where most income-restricted housing is built.
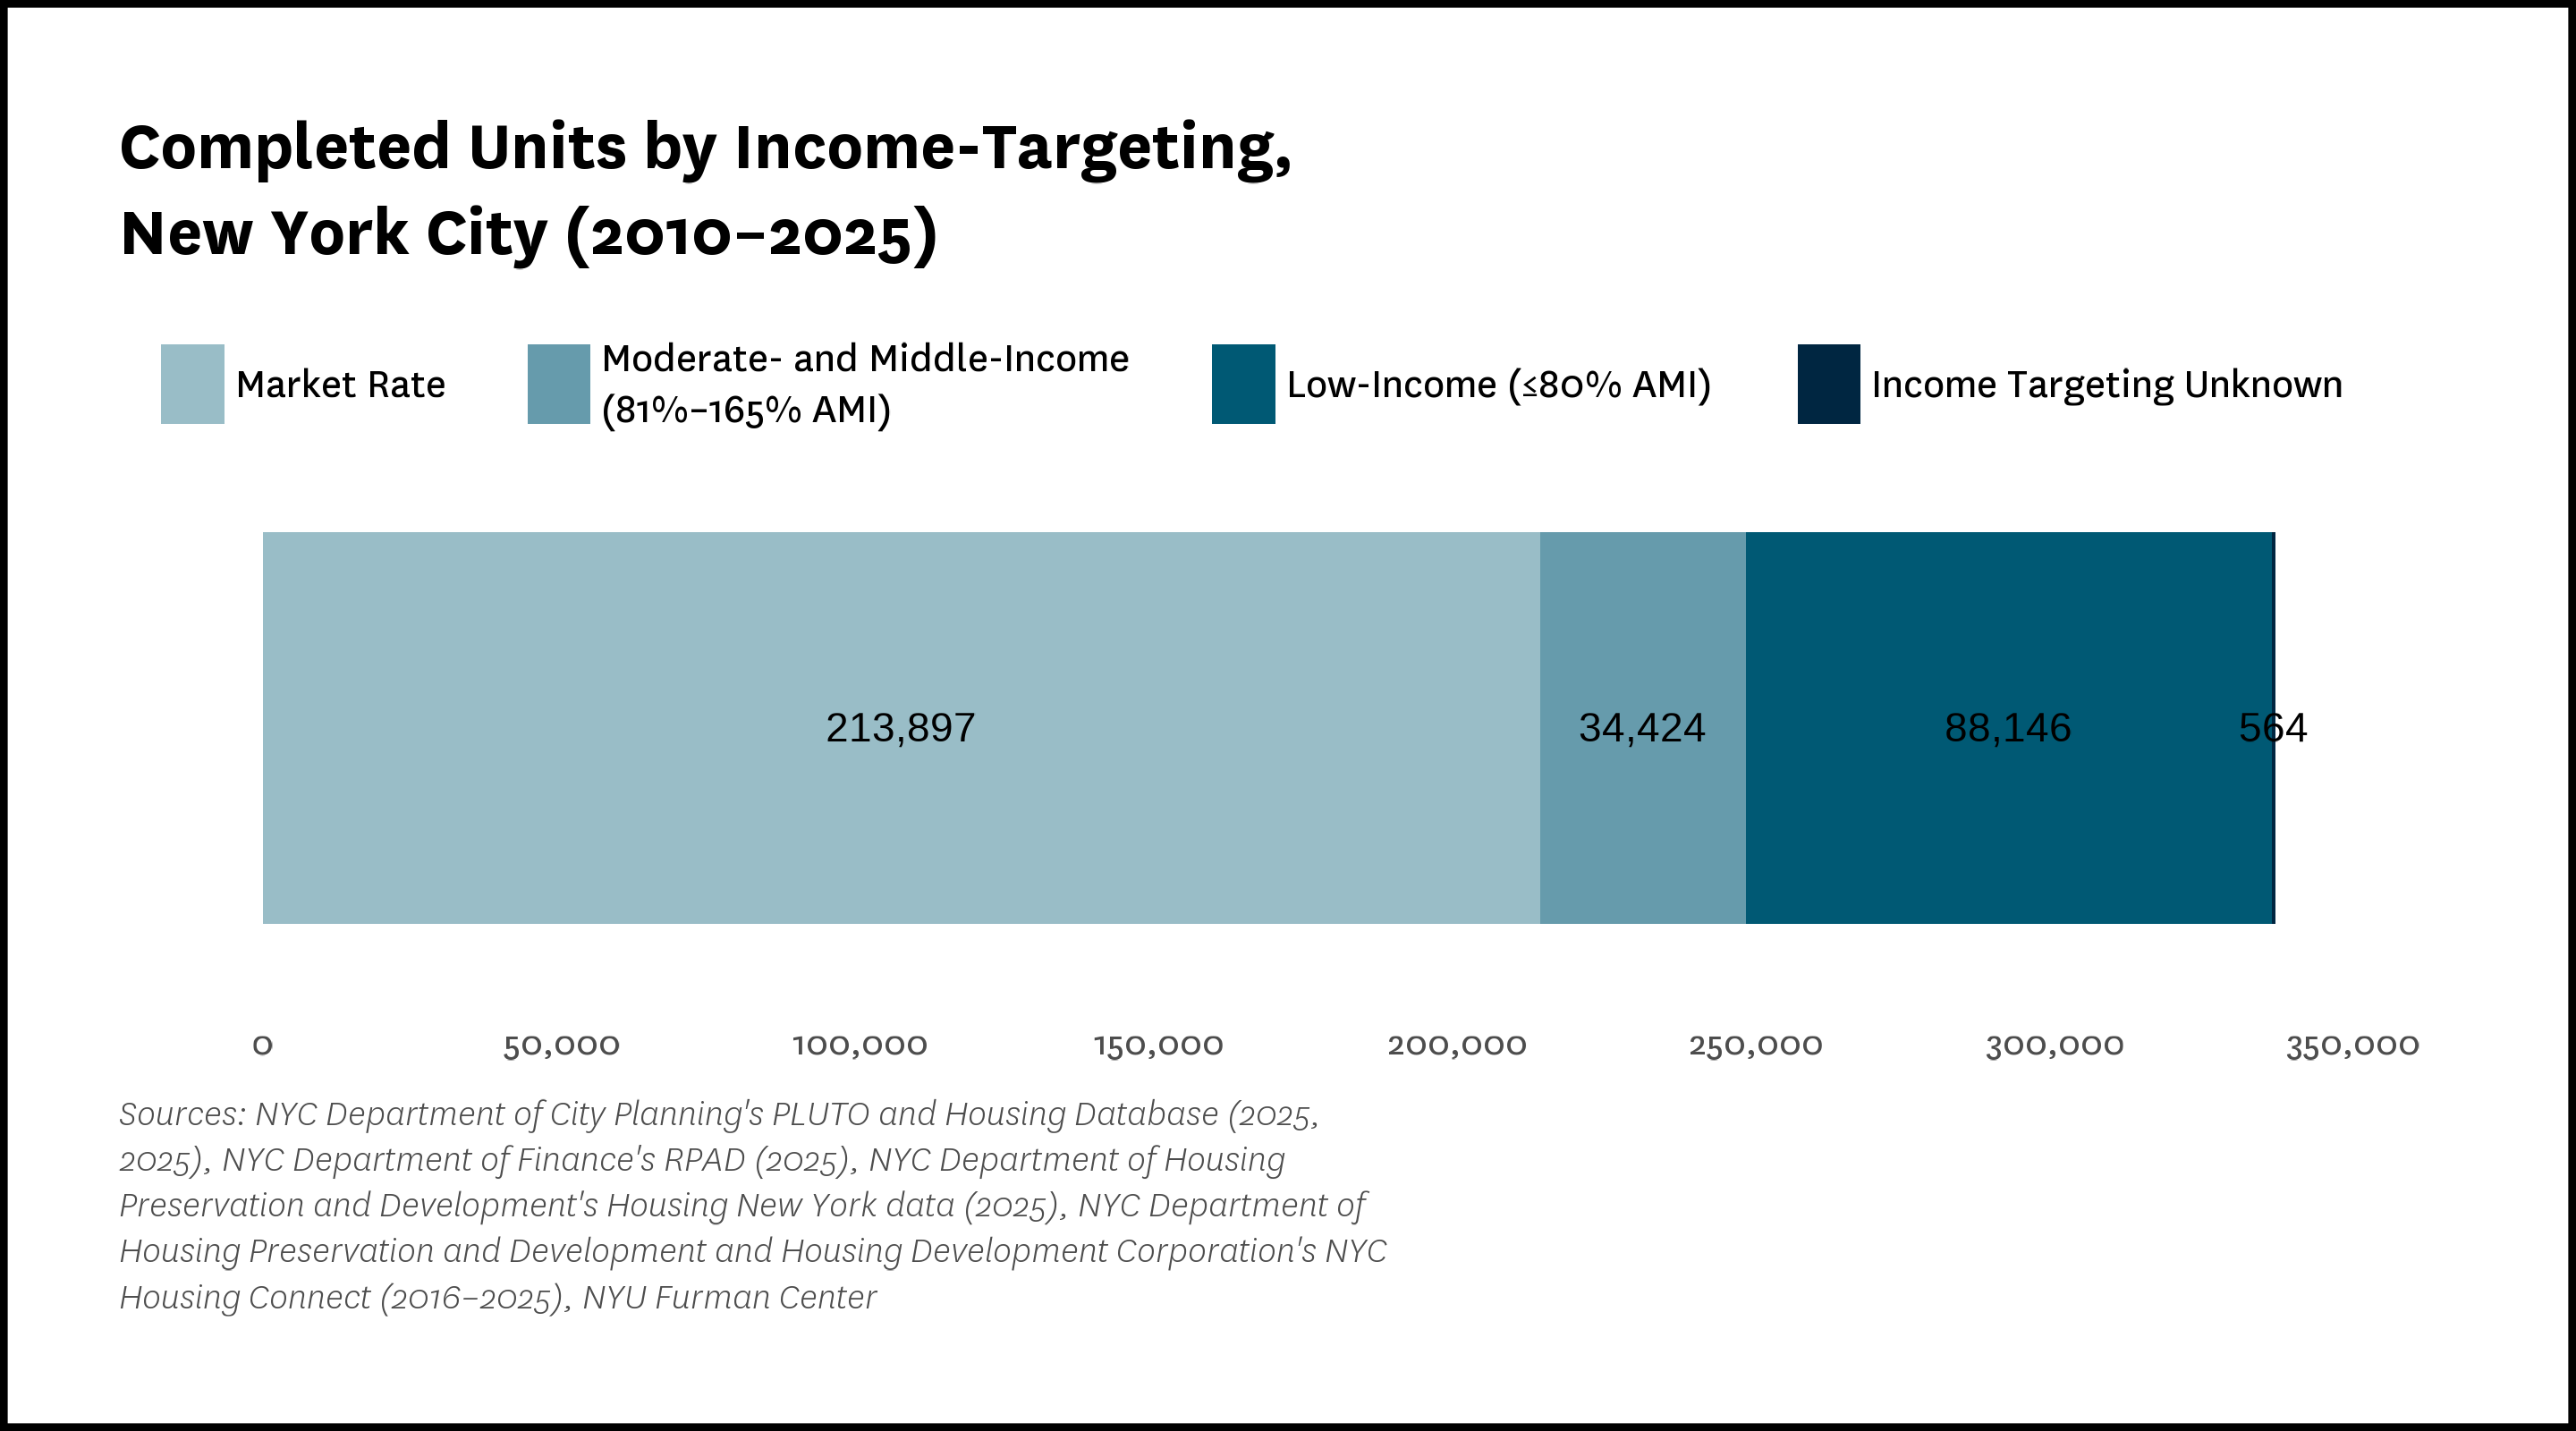
Between 2010 and 2025, 337,031 multifamily units were completed in New York City. Of those, an estimated 88,146 units (26.2 percent) were income-restricted and targeted to low-income households earning up to 80 percent of Area Median Income (AMI). An additional 34,424 units (10.2 percent) were targeted to moderate- and middle-income households earning between 81 and 165 percent of AMI. The remaining 213,897 units (63.5 percent) were market-rate, with 564 units (0.2 percent) having unknown income targeting (Figure 3). This share is calculated from multifamily (4+ unit) completions, not from all housing production.
These figures should be viewed as provisional, particularly for the most recent year. Because our methodology relies on identifying the underlying tax benefits or subsidies used in a development—and that information often lags behind physical completion—the share of income-restricted units in 2025 may rise over time as additional data becomes available.
Figure 3:
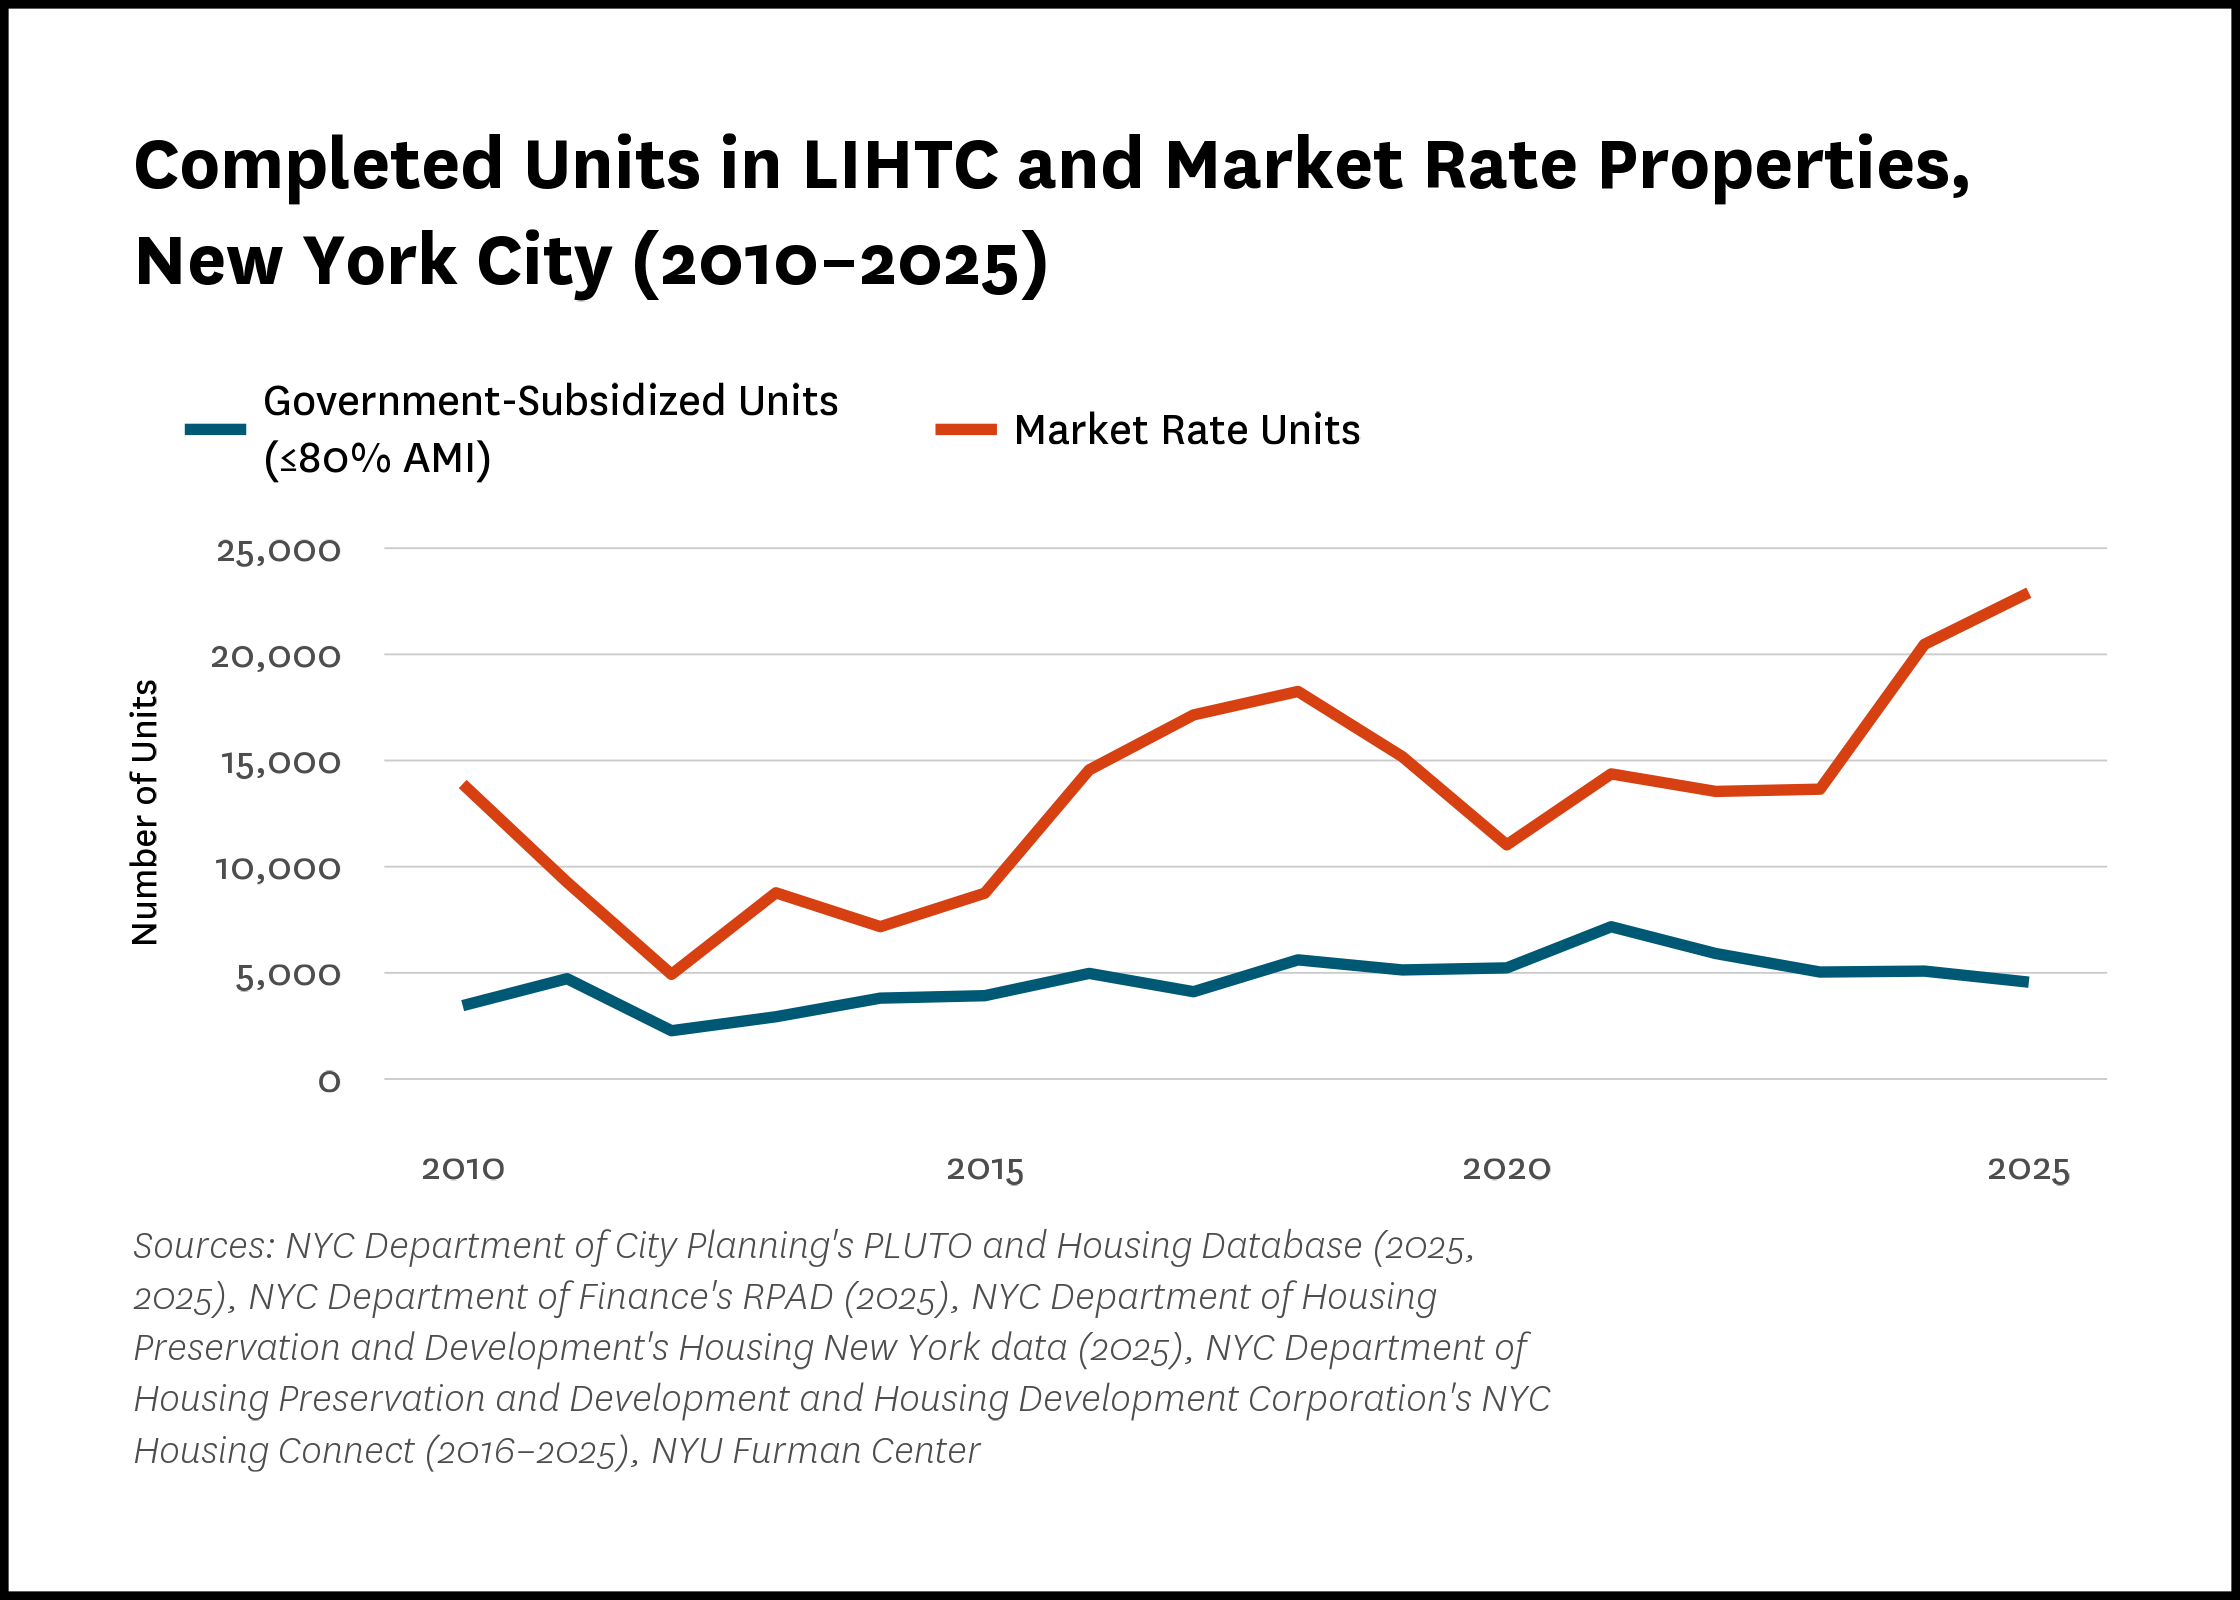
In 2025, market-rate completions continued their upward trajectory, setting a new high for the period since 2010, and rising 11.9 percent over last year’s total (Figure 4). By contrast, government-subsidized completions dipped to 4,561 units in 2025, a 10.3 percent decline from 5,082 in 2024. Over the last 16 years, subsidized completions have remained relatively stable, with a peak of 7,172 units in 2021. The result is a widening gap between market-rate and subsidized production in recent years.
Figure 4:
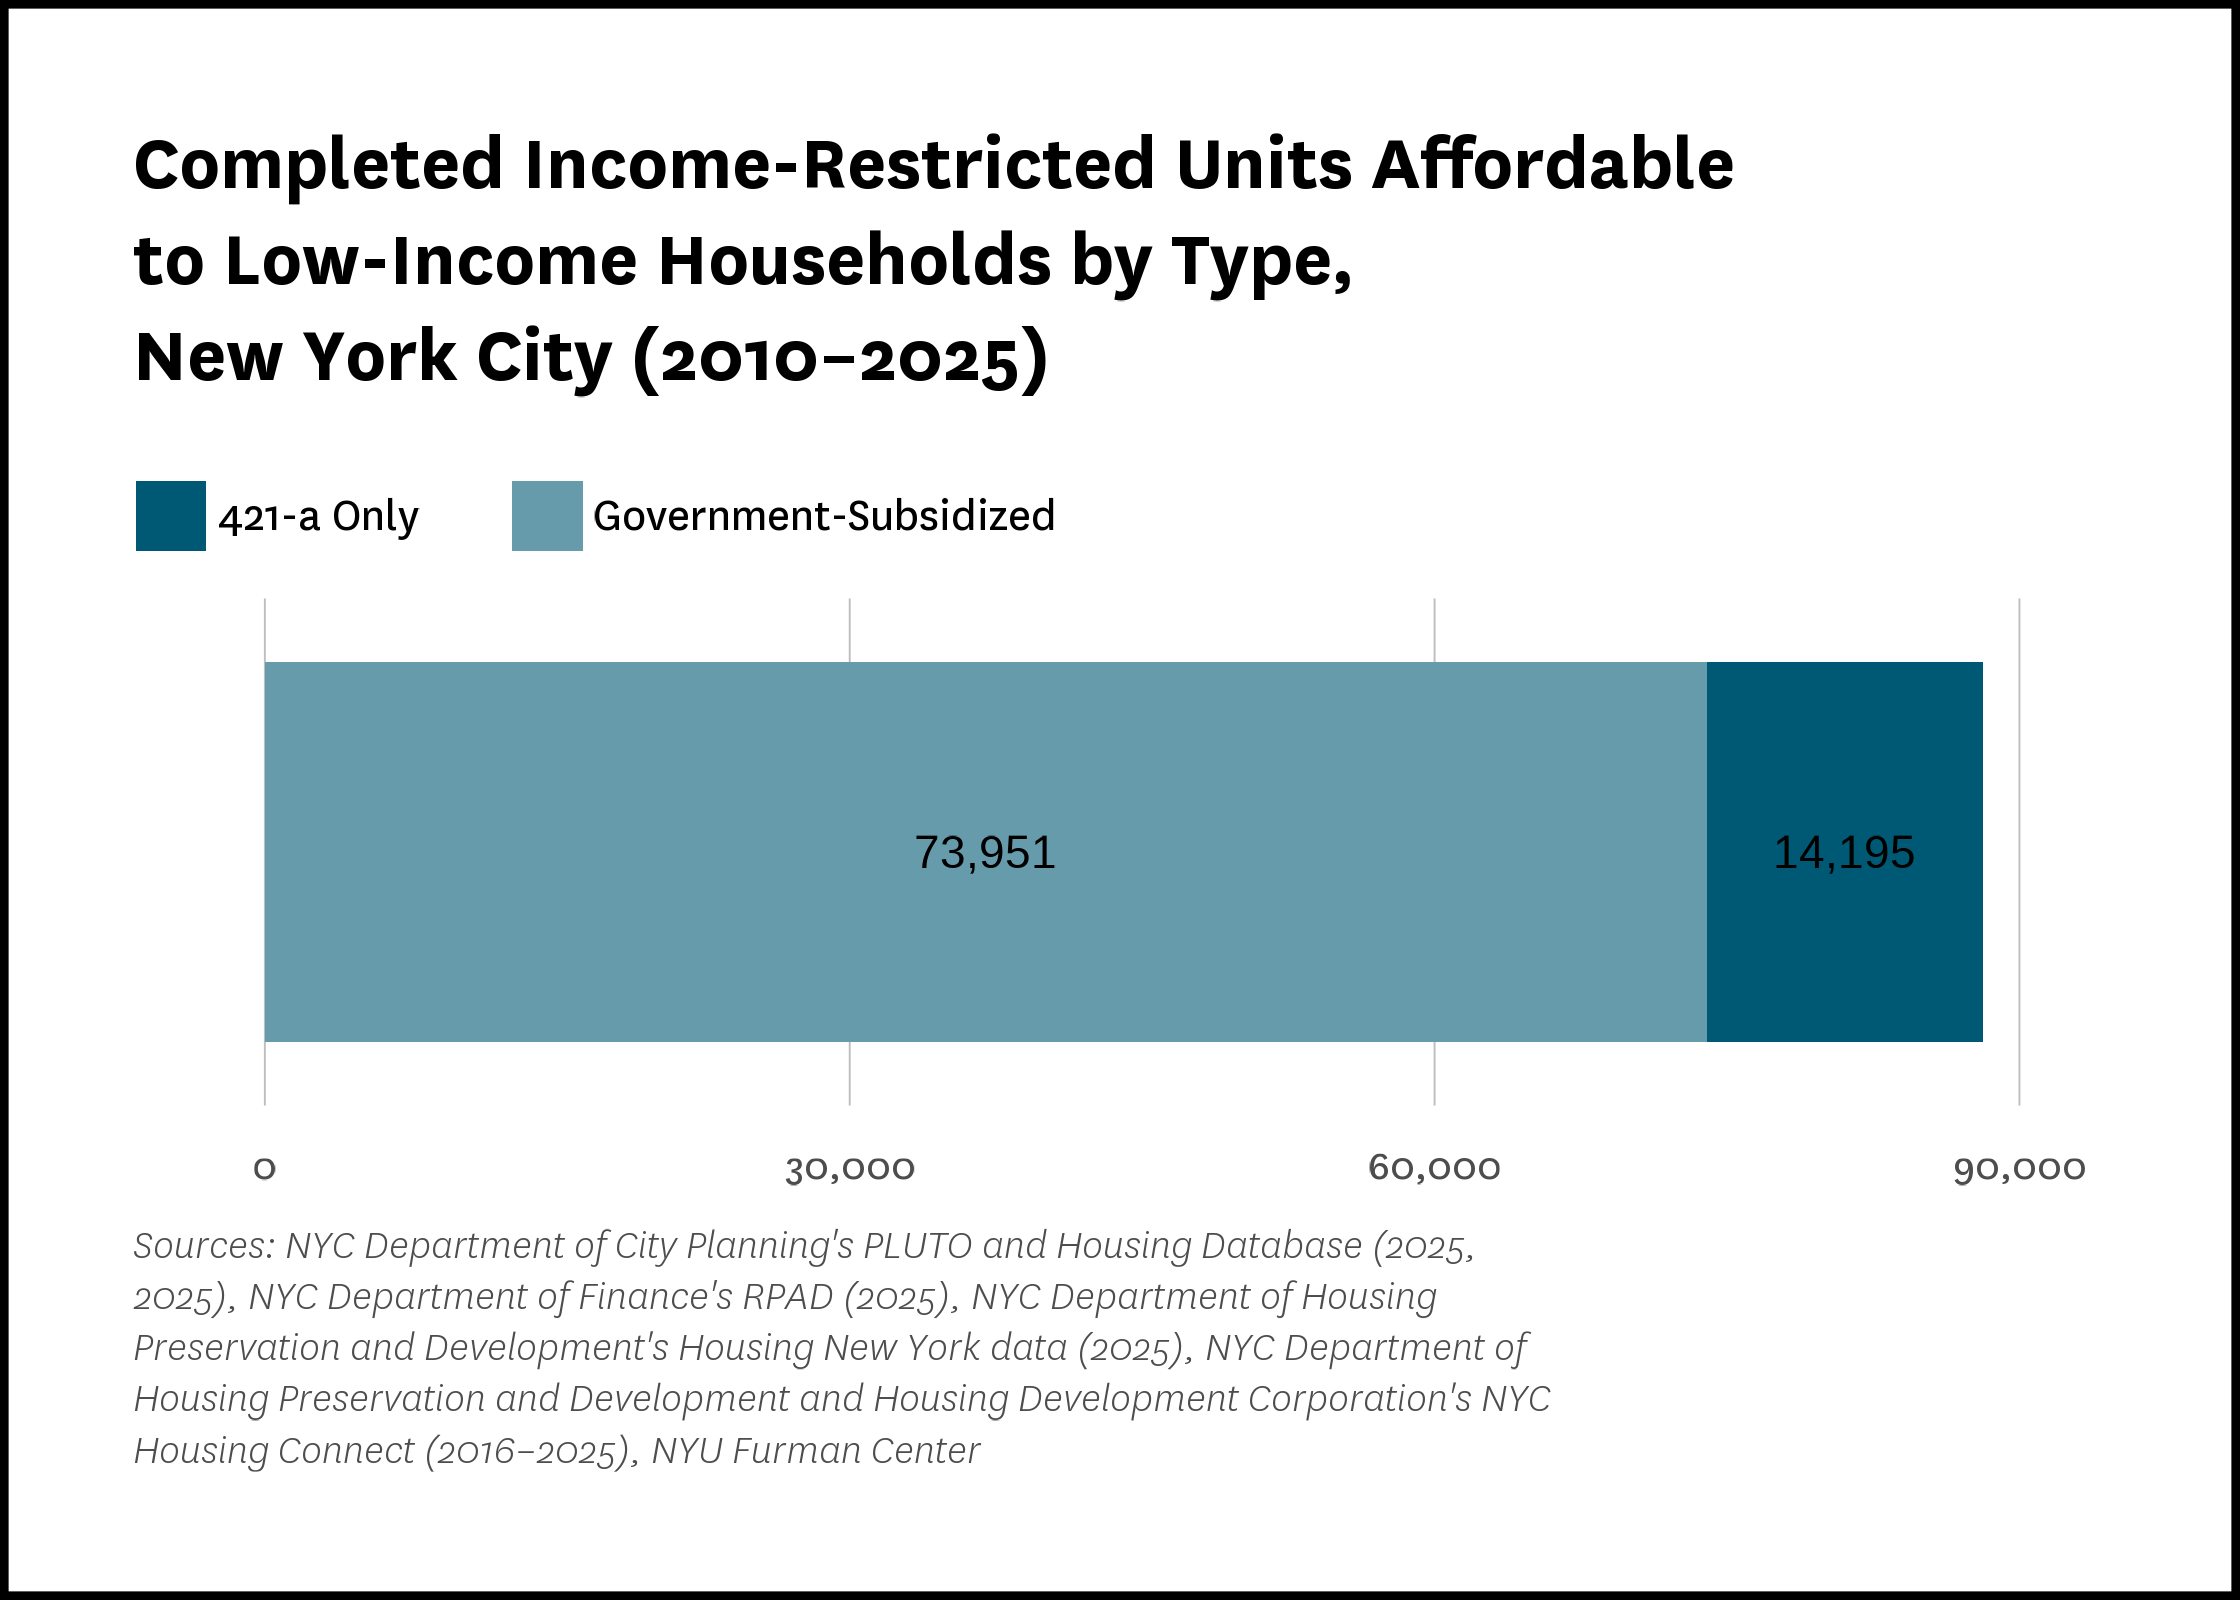
Of the 88,146 income-restricted units completed between 2010 and 2025, 73,951 or 83.9 percent were in buildings that received direct government subsidies. The remaining 14,195 units or 16.1 percent were produced through 421-a alone, meaning they were privately developed with affordability requirements tied exclusively to the tax exemption rather than direct subsidy.
Figure 5:
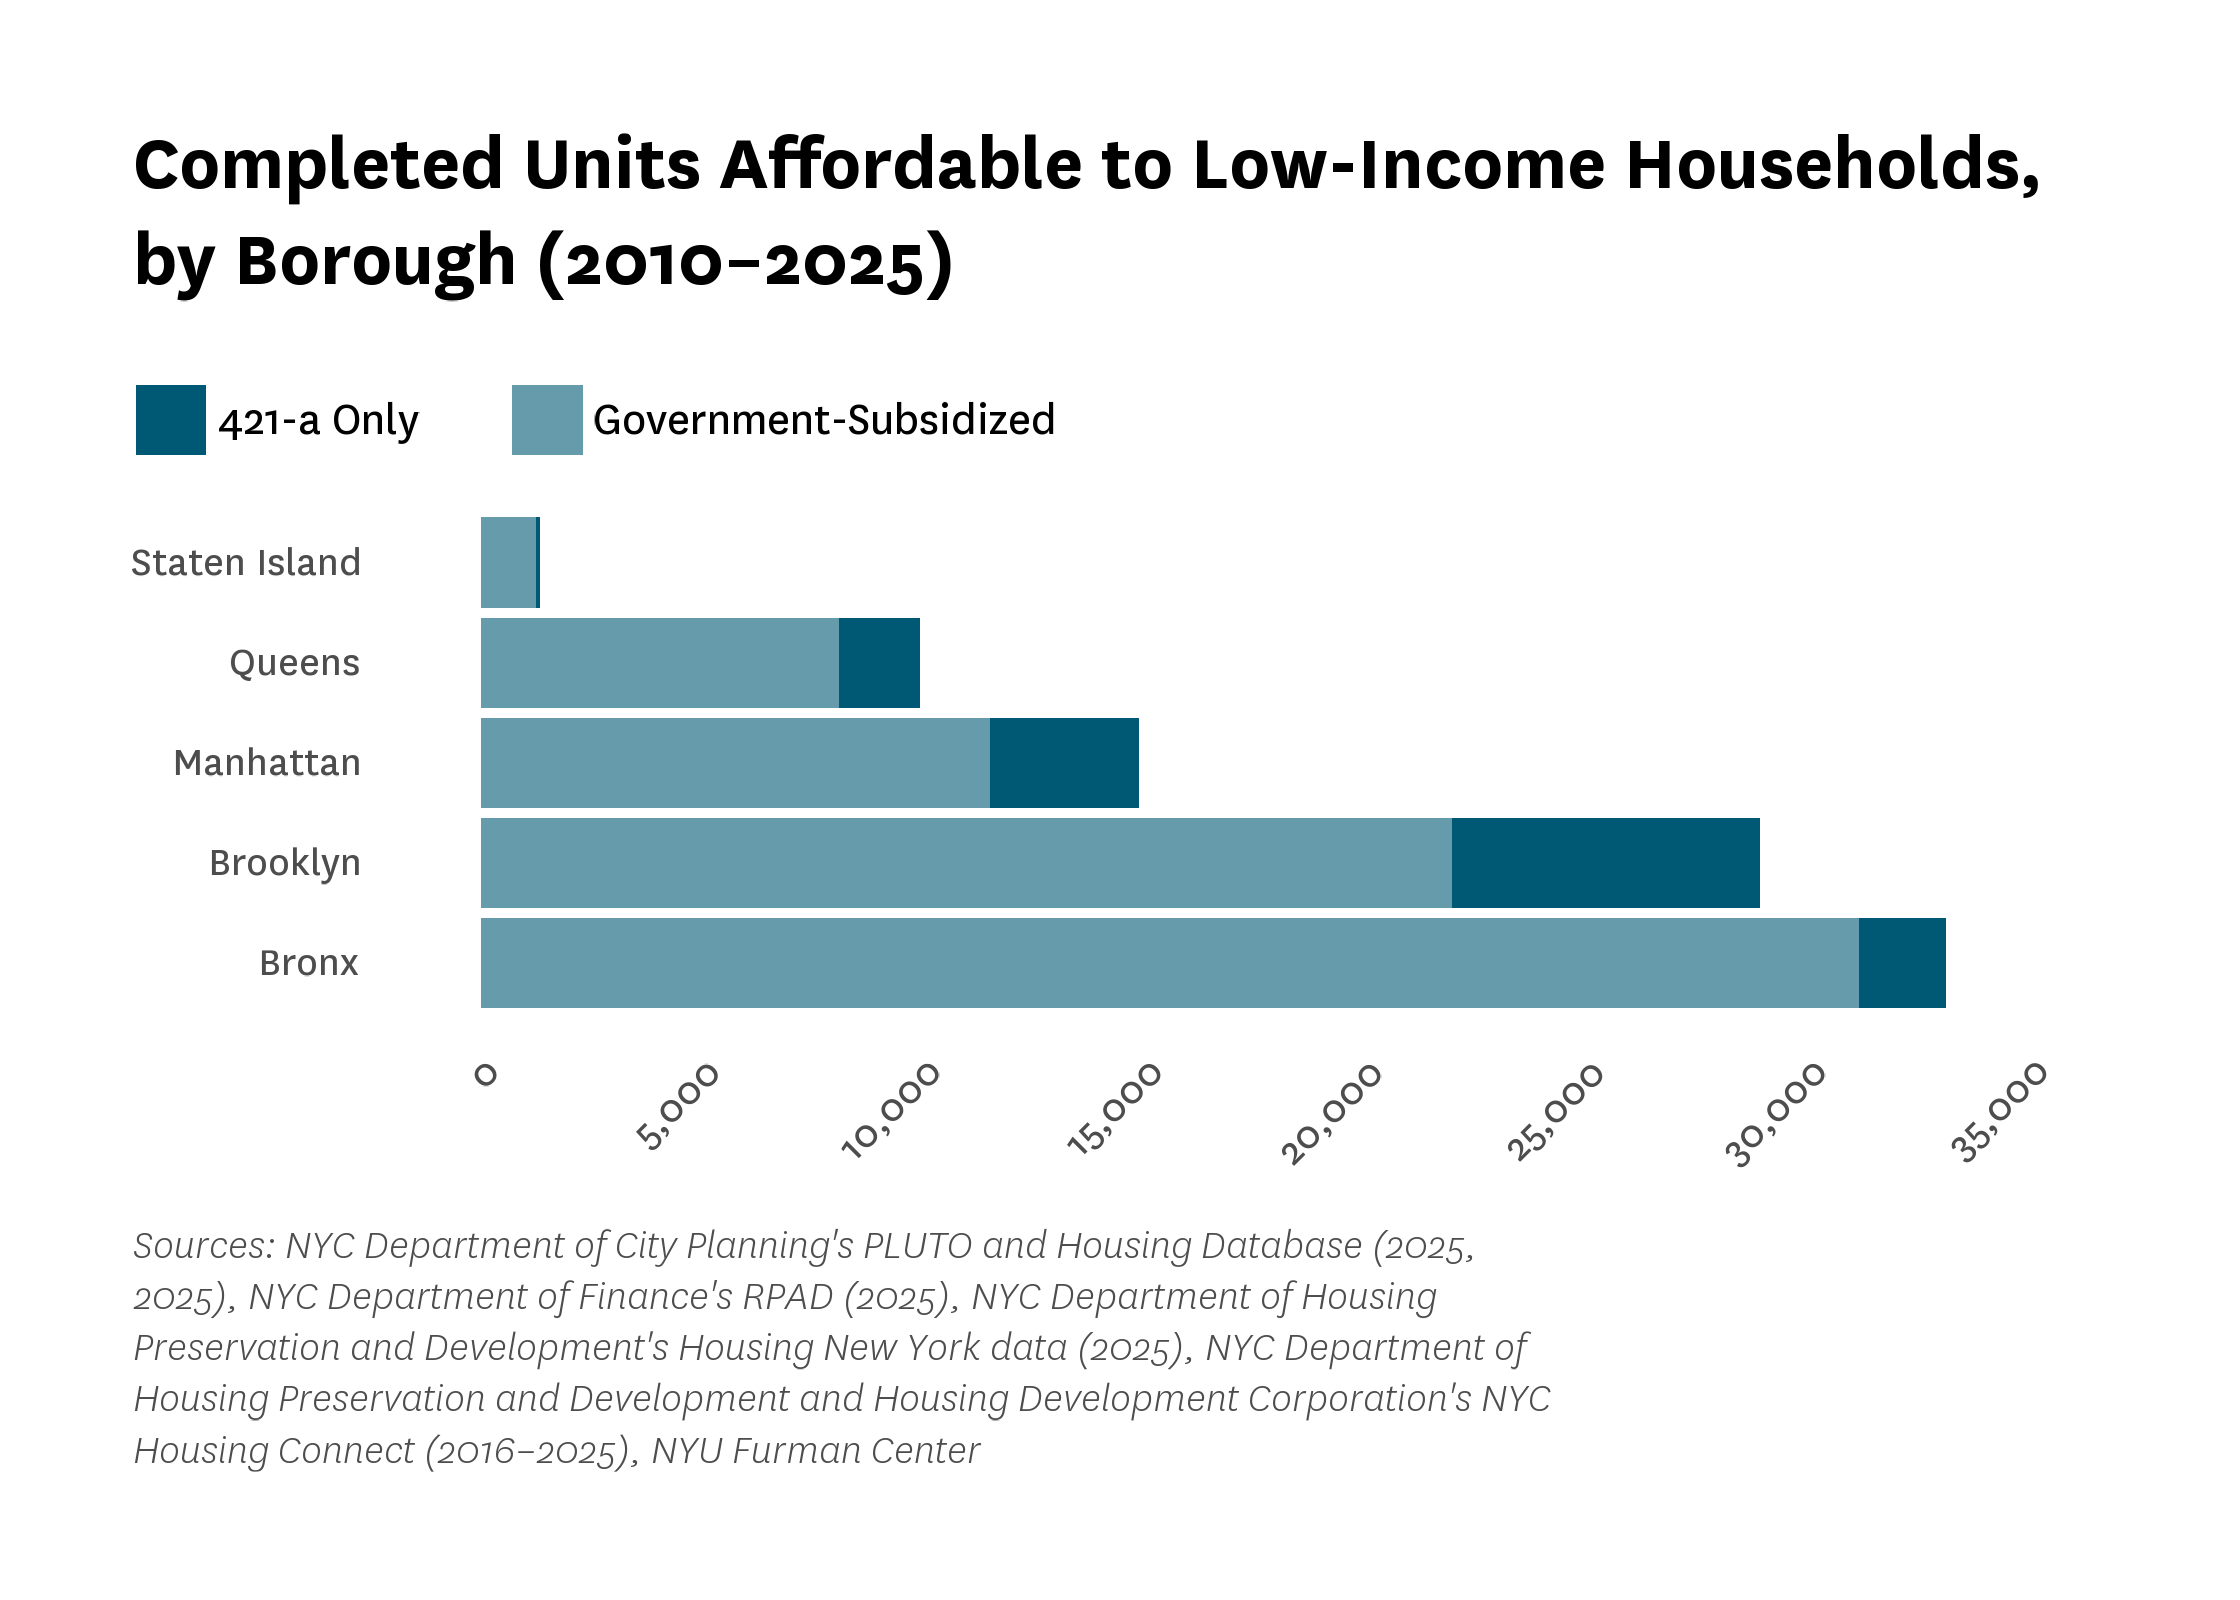
The total production of low-income housing varied across boroughs. The Bronx added the most such units, totaling over 33,000 units, 31,136 in subsidized projects and 1,973 via 421-a alone. Brooklyn followed with roughly 28,900 (21,950 subsidized and 6,952 through 421-a only), and Manhattan produced about 14,900 (11,509 subsidized, 3,365 421-a only). Queens added approximately 9,930 units, and Staten Island just over 1,300 (Figure 6).
Figure 6:
The Rent-Stabilized Housing Stock
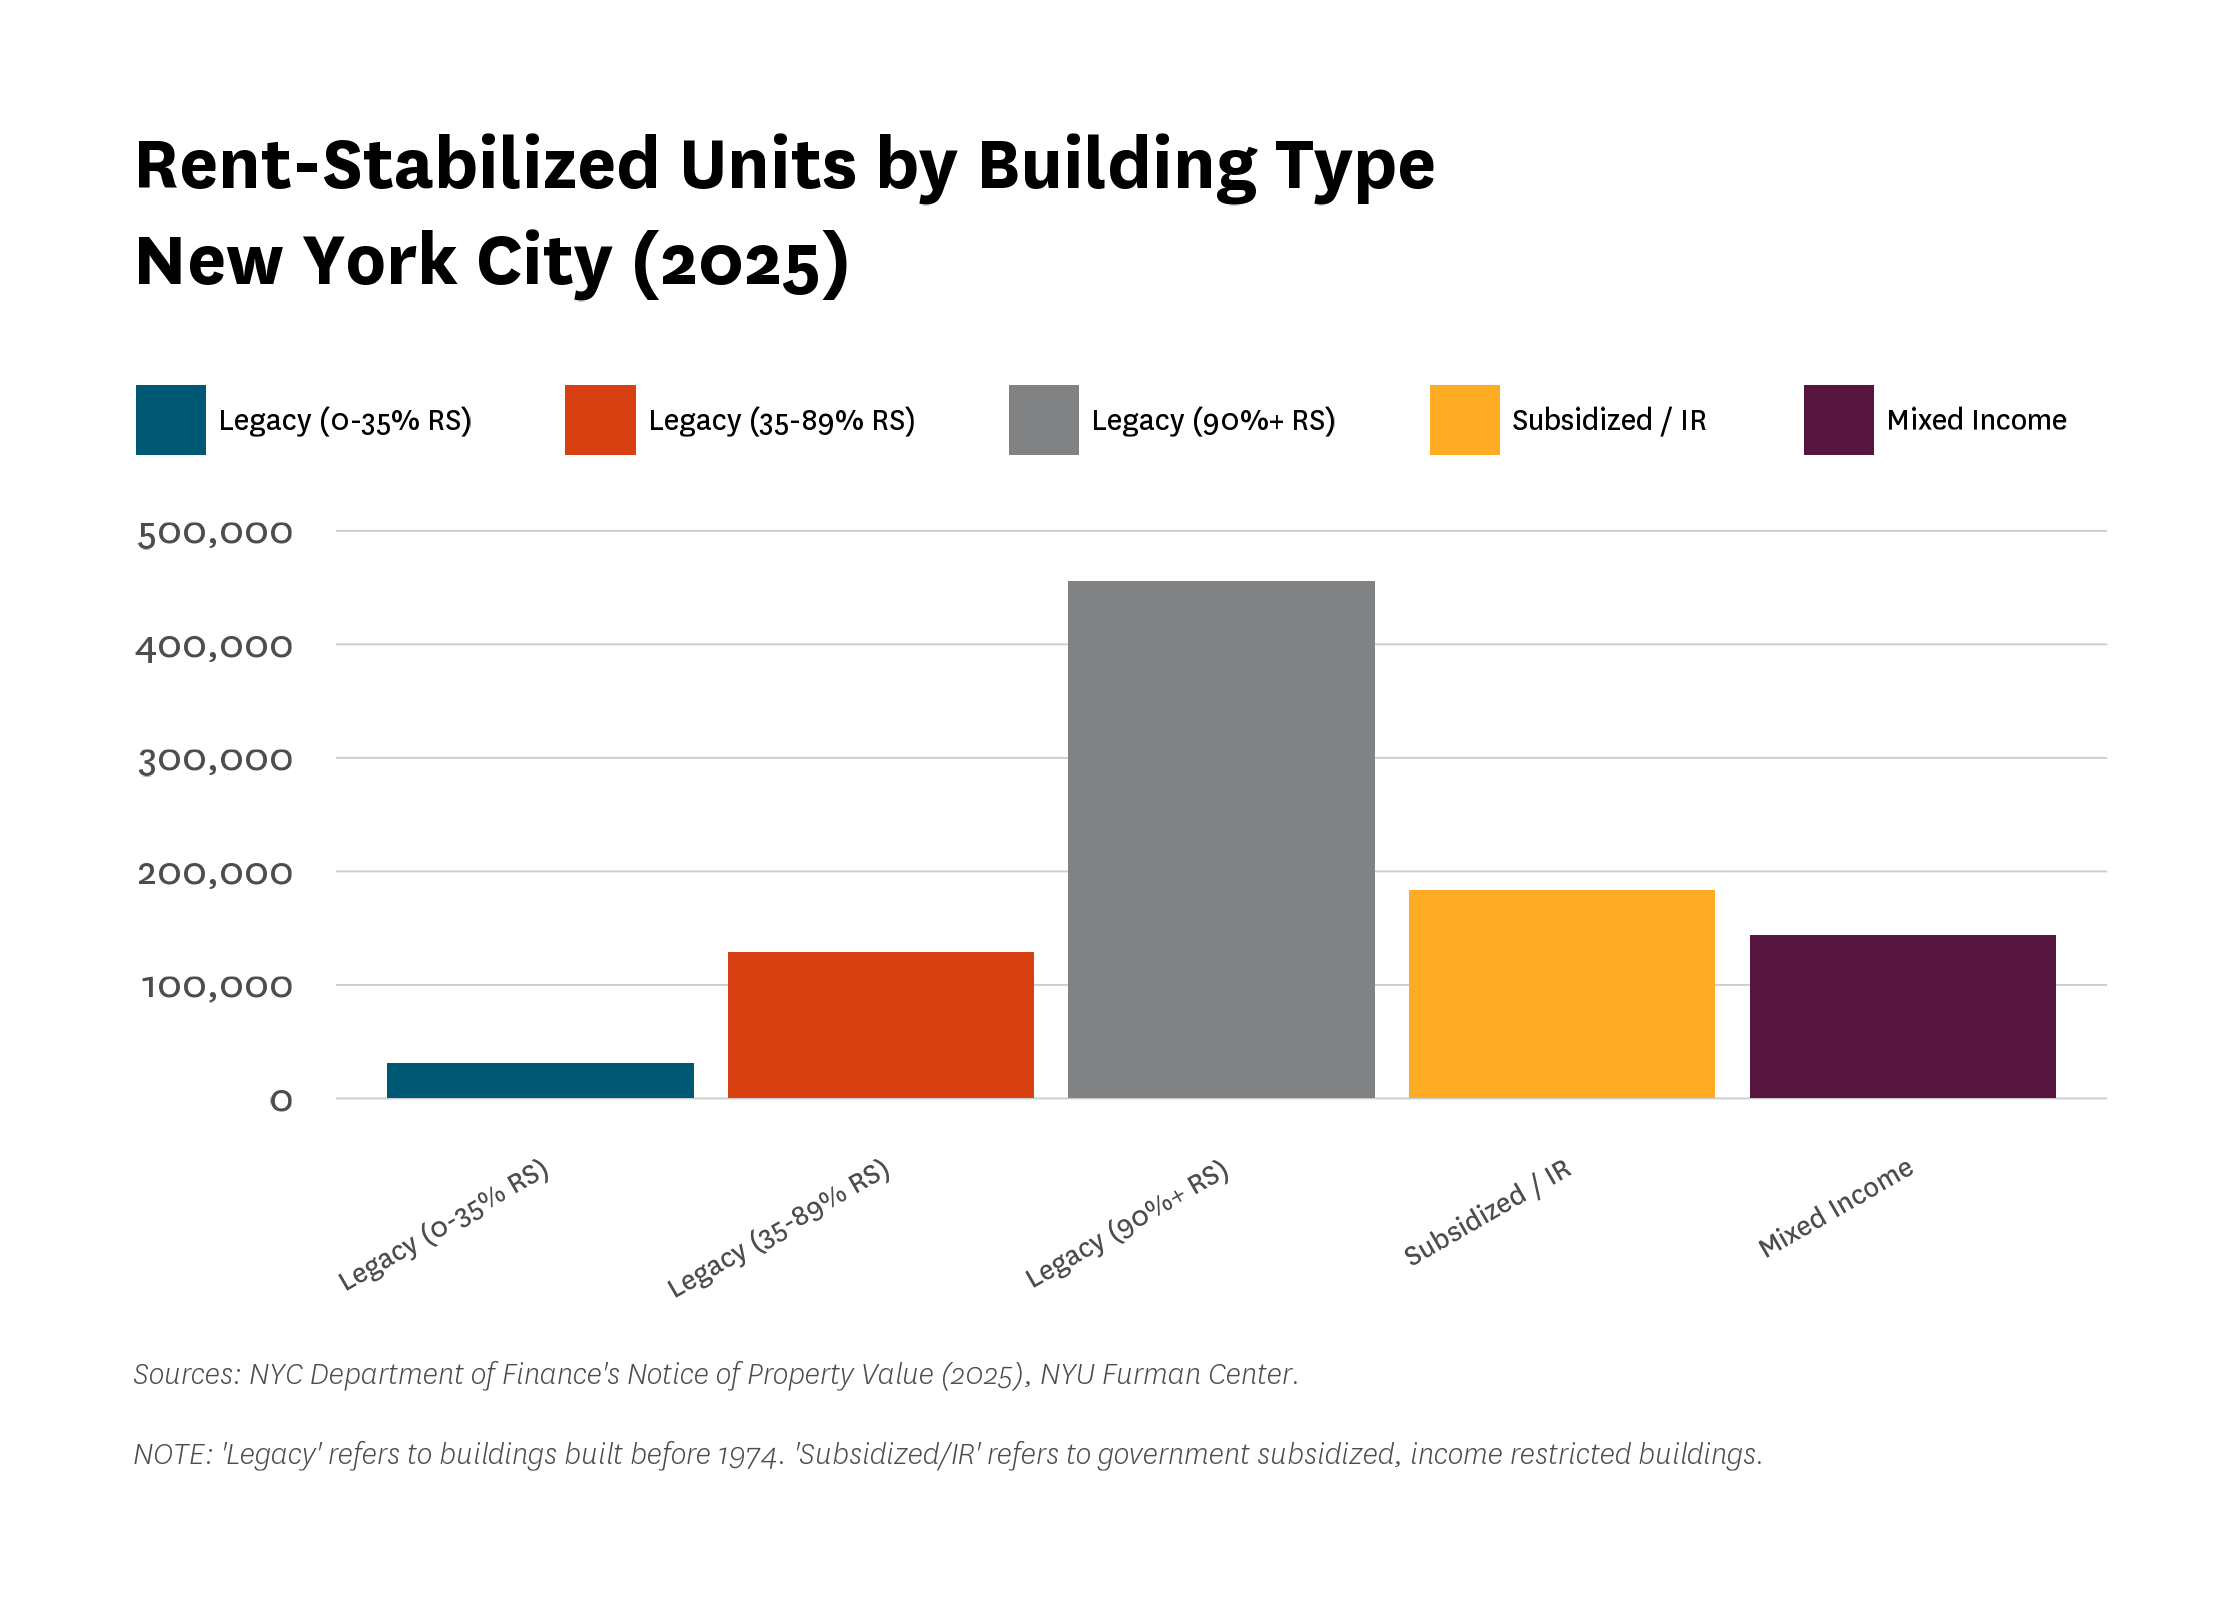
In 2025, New York City’s rent-stabilized housing stock totaled approximately 944,491 units (Figure 7). Legacy buildings (pre-1974 multifamily buildings with six or more units that contain at least one rent-stabilized apartment) with 90 percent or more rent-stabilized units accounted for 455,979 units, nearly half of the citywide total. Legacy buildings with between 35 percent and 89 percent of their units rent stabilized contributed an additional 129,291 units, while buildings with fewer than 35 percent of their units stabilized contributed 31,572 to the total. Beyond the legacy stock, government-subsidized and income-restricted buildings contained 183,315 rent-stabilized units, and mixed-income properties accounted for 144,334 rent-stabilized units.
Figure 7:
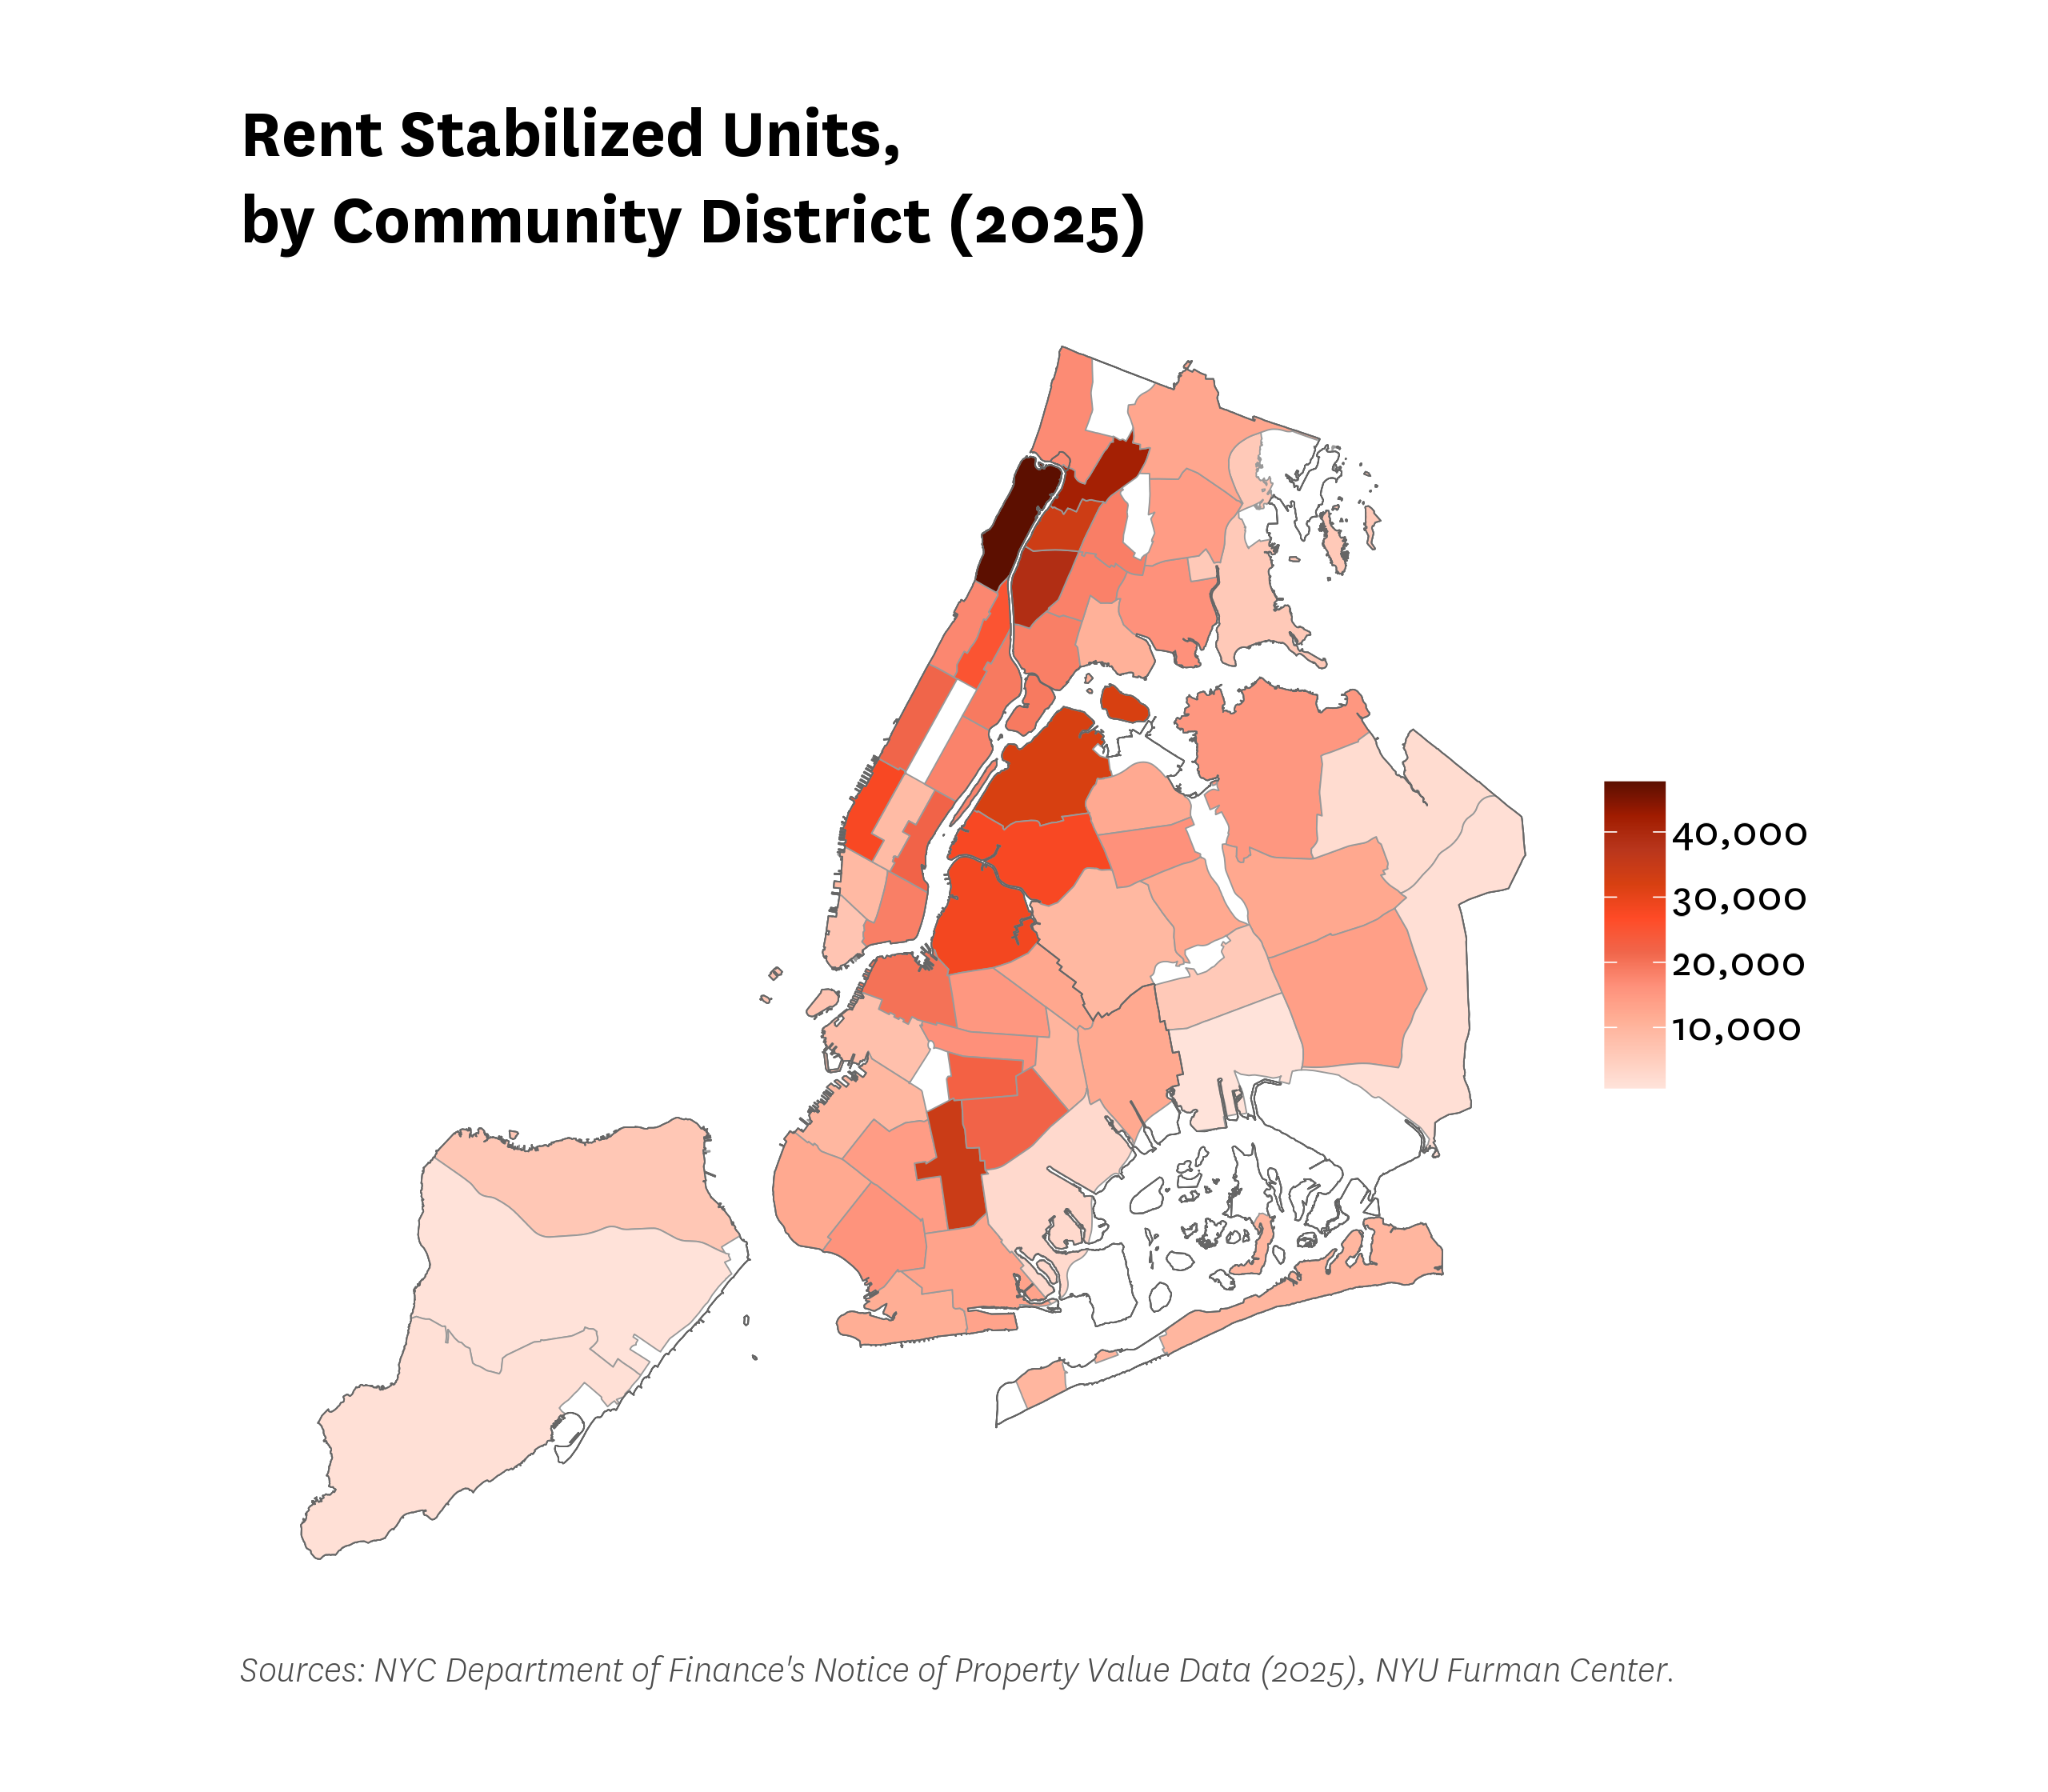
Rent-stabilized units are unevenly distributed across New York City’s 59 community districts (Figure 8). Washington Heights/Inwood in Manhattan had the largest number of rent-stabilized units (47,690), representing 63 percent of its total housing stock. However, Kingsbridge Heights/Bedford in the Bronx had the greatest concentration of rent-stabilized units in the city, with almost three-quarters of all units in the community district being rent-stabilized. In Brooklyn, Flatbush/Midwood and South Crown Heights/Lefferts Gardens stand out, with stabilized units comprising roughly half of each community district’s housing. Queens and Staten Island had notably lower shares overall, with many districts falling below 20 percent rent stabilized.
Figure 8:
For more detailed information on affordable housing and rent-stabilized housing by neighborhood, see our community district profiles.
Conclusion
2025 marked a new high point for housing completions in New York City, with more units completed than in any year since we began tracking the measure in 2010. Over the last 16 years, the city added more than 373,000 housing units across buildings of all sizes. But the recent jump in completions is unlikely to represent a lasting trend. Instead, it is likely tied in large part to developers rushing to finish projects ahead of key state imposed deadlines, particularly the expiration of the 421-a tax exemption program. At the same time, new permitting activity, which offers a preview of future construction, saw a modest rebound in 2025 compared to the prior year, but remained low relative to historical levels, suggesting that the current pace of multifamily development may not continue.
From 2010 to 2025, New York City also added 88,146 income-restricted units affordable to low-income households. The vast majority were created through government-subsidized programs, while a smaller portion came from privately financed developments that included affordable units through 421-a’s requirements alone.
As the market responds to new initiatives such as 485-x, 467-m, City of Yes zoning changes and the Charter Revision Commission’s ballot measures, a key question will be whether these tools can support enough housing, across a wide range of neighborhoods, and at affordability levels that match the needs of lower-income New Yorkers.