State of Renters and Their Homes 2025
This section utilizes the latest census and administrative data to identify both recent and long-term trends in New York City’s rental housing landscape. Although the share of renter households has declined slightly over the past decade, the city remains overwhelmingly renter-majority—unlike the nation as a whole, where most households own their homes. Renter incomes have generally increased, but gains in income have not always kept pace with rising rents, and affordability and housing quality vary widely across neighborhoods.
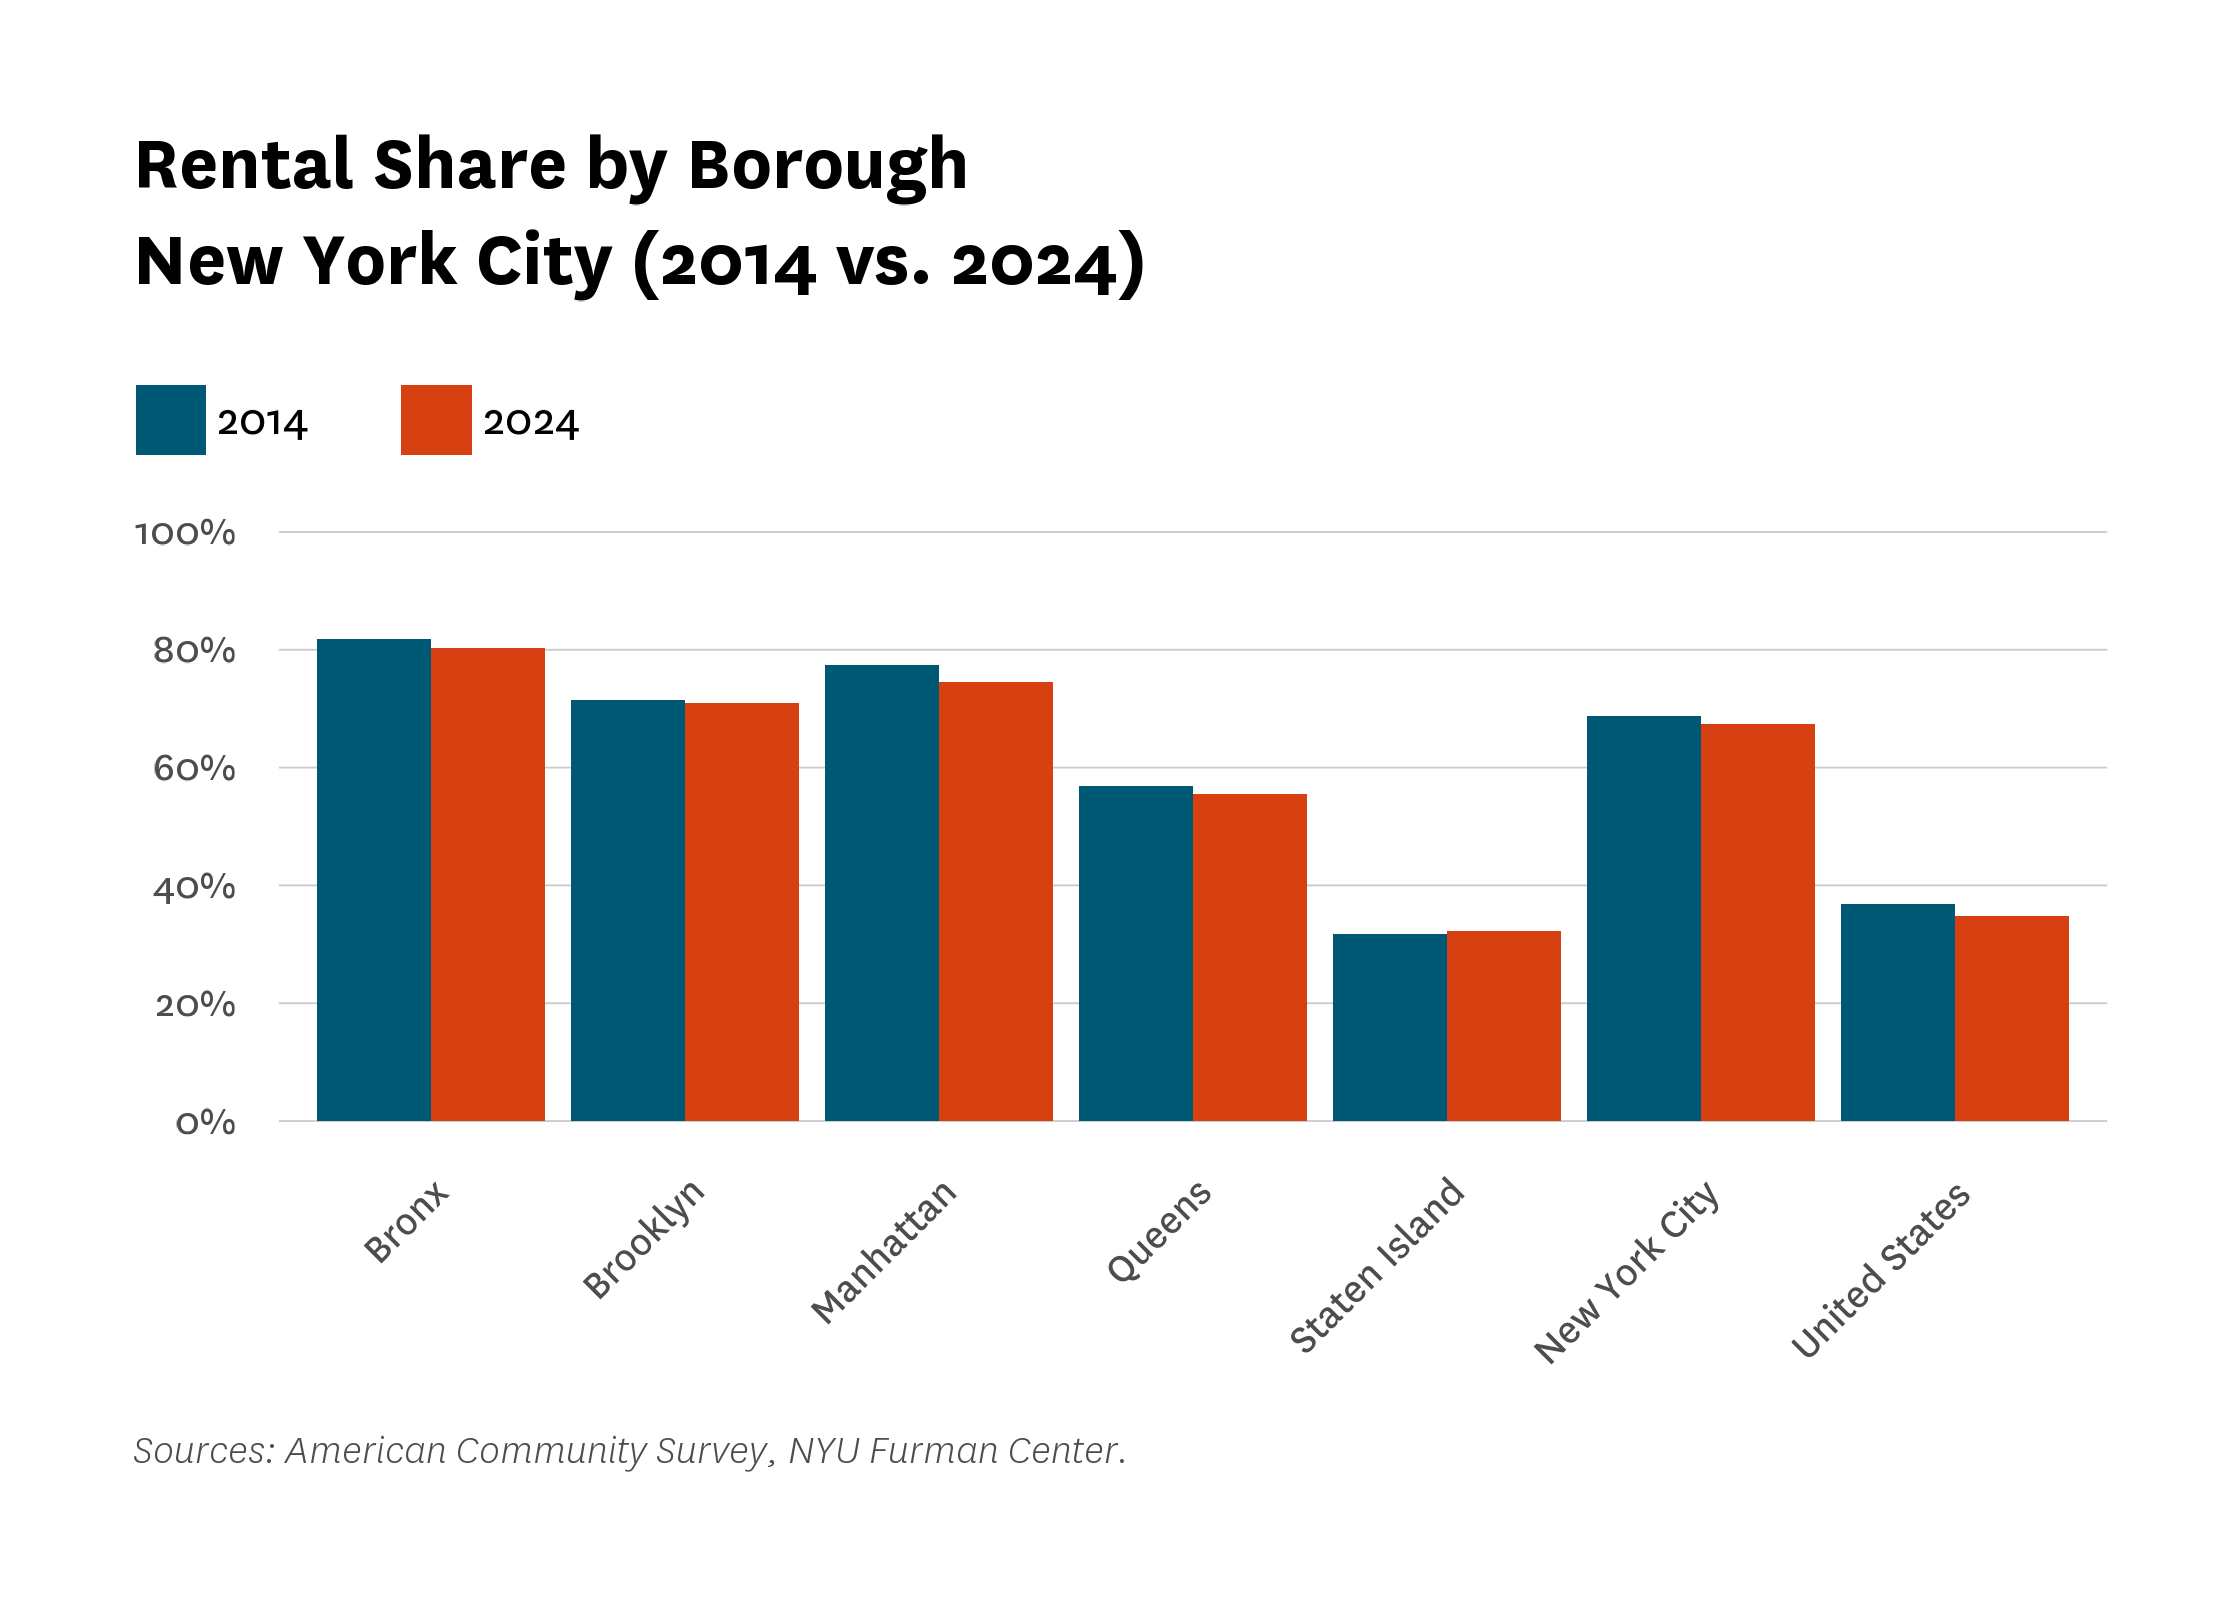
Between 2014 and 2024, the share of renter households in the city declined slightly, from 68.8 to 67.3 percent (Figure 1). The Bronx continued to have the city’s highest renter share (80.3%), while Staten Island remained the lowest (32.3%). Manhattan experienced the largest decline over the decade, down 2.9 percentage points. In contrast, Brooklyn and Staten Island were the only boroughs where the renter share remained roughly the same over the past decade, changing by less than 1 percentage point over the past decade.
Figure 1:
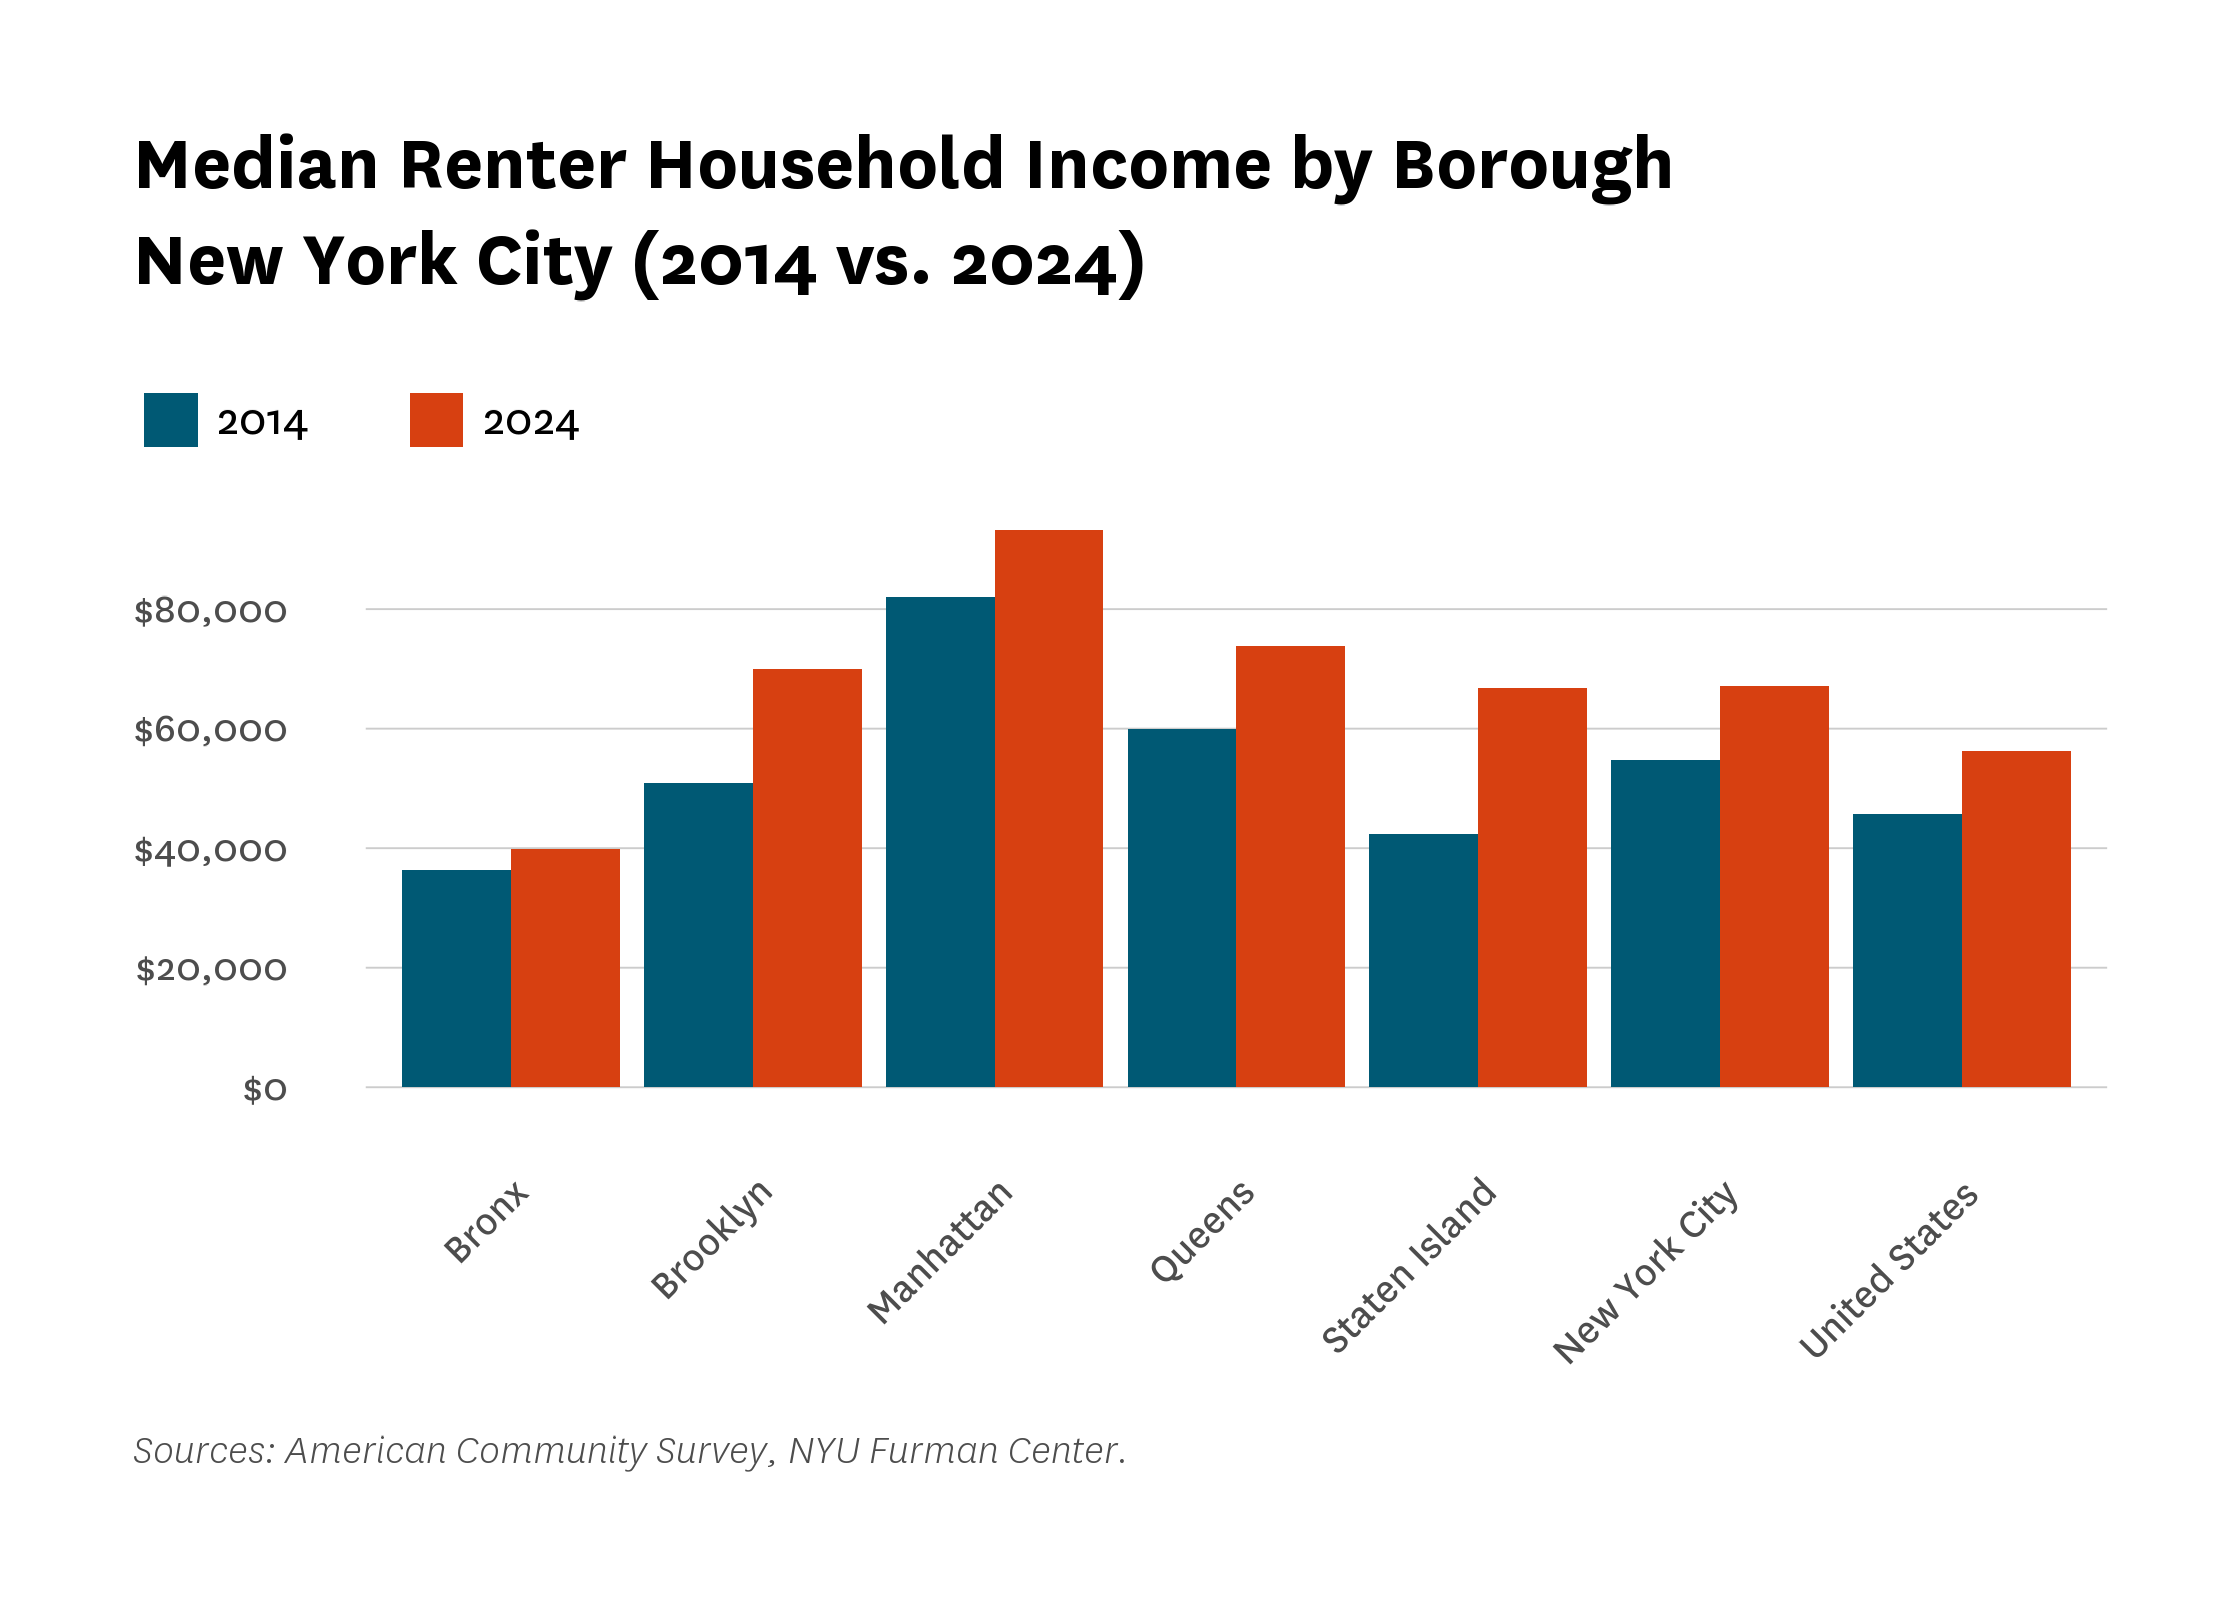
Renter household incomes rose citywide during the same period. By 2024, the median New York City renter household earned $67,060—a 22.6 percent increase over 2014 in inflation-adjusted dollars (Figure 2). This trend tracks the national growth rate of 23.3 percent. Staten Island saw the largest gain (57.8%), followed by Brooklyn (37.3%) and Queens (23.0%). Incomes grew more modestly in Manhattan (13.5%) and the Bronx (9.5%).
Figure 2:
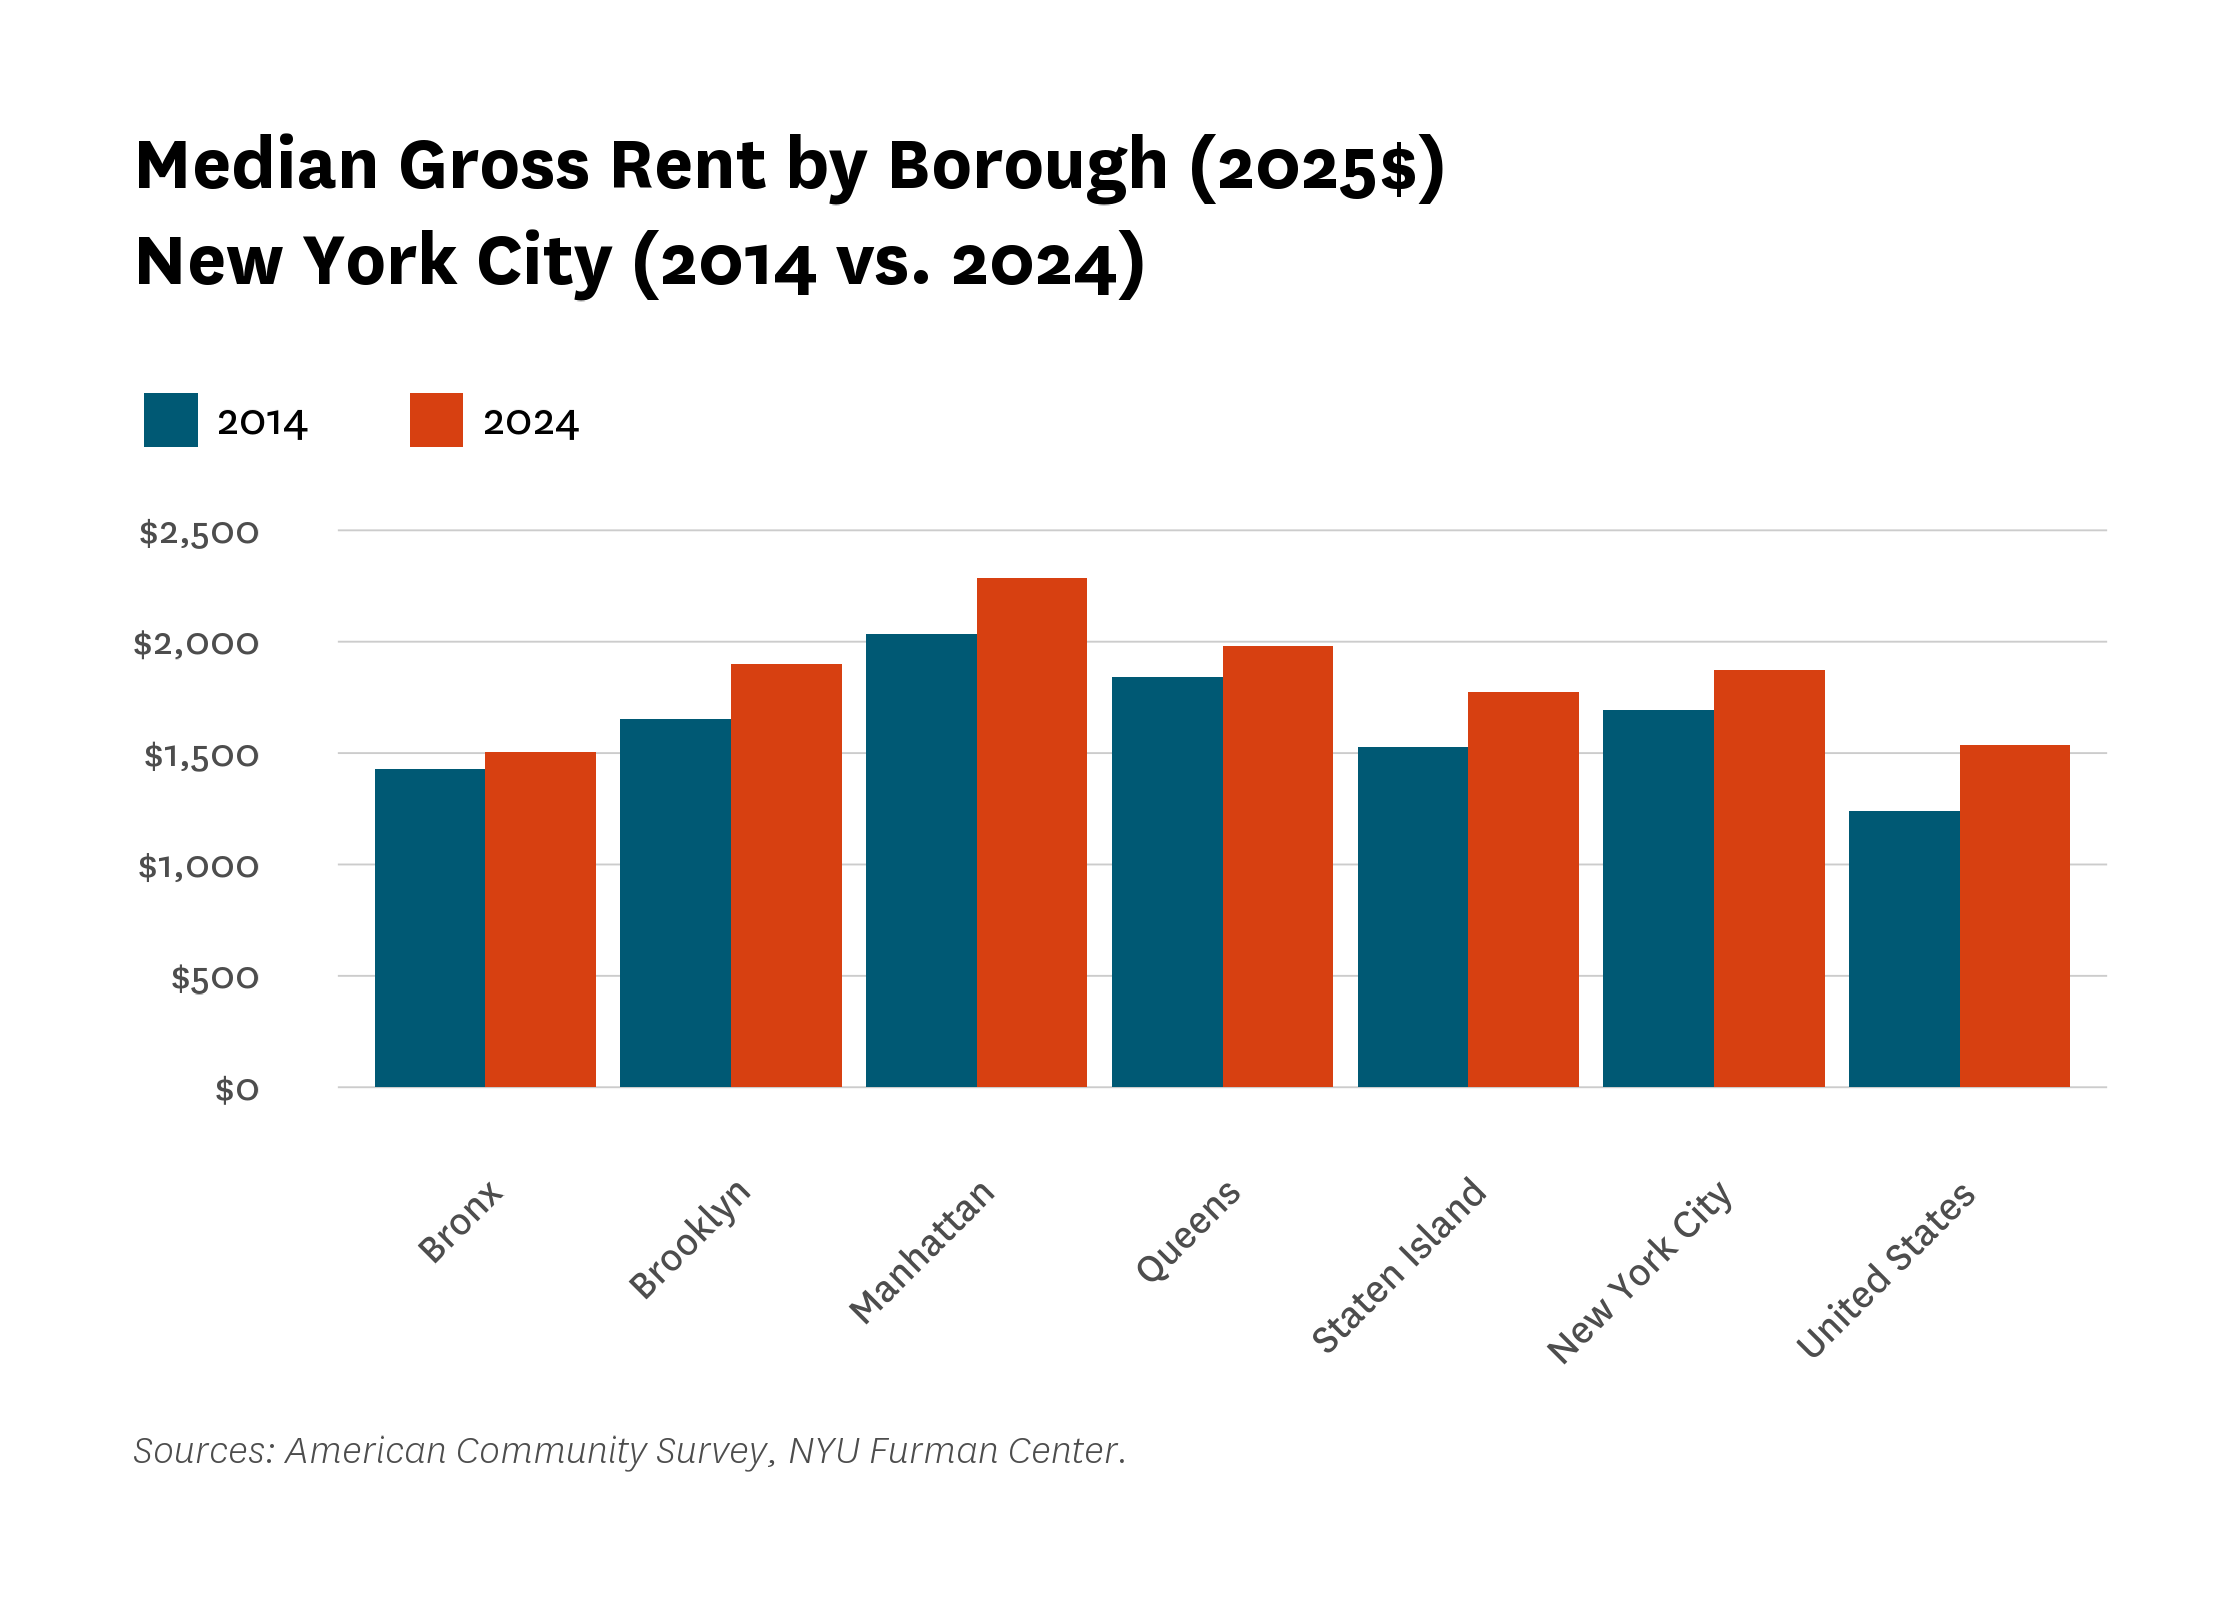
Over the past decade, median gross rent in New York City rose by 10.5 percent after adjusting for inflation, significantly below the national increase of 24.0 percent (Figure 3). Gross rent includes contract rent plus estimated utilities and reflects the full cost of housing. Rent growth was uneven: Staten Island saw the steepest percentage increase (16.4%), followed by Brooklyn (14.8%), Manhattan (12.5%) and Queens (7.5%). The Bronx recorded the smallest gain, just 5.3 percent. While rents remain highest in Manhattan,a good portion of the real rent growth over the decade was concentrated in the outer boroughs—often in neighborhoods where income growth was also strongest.
Figure 3:
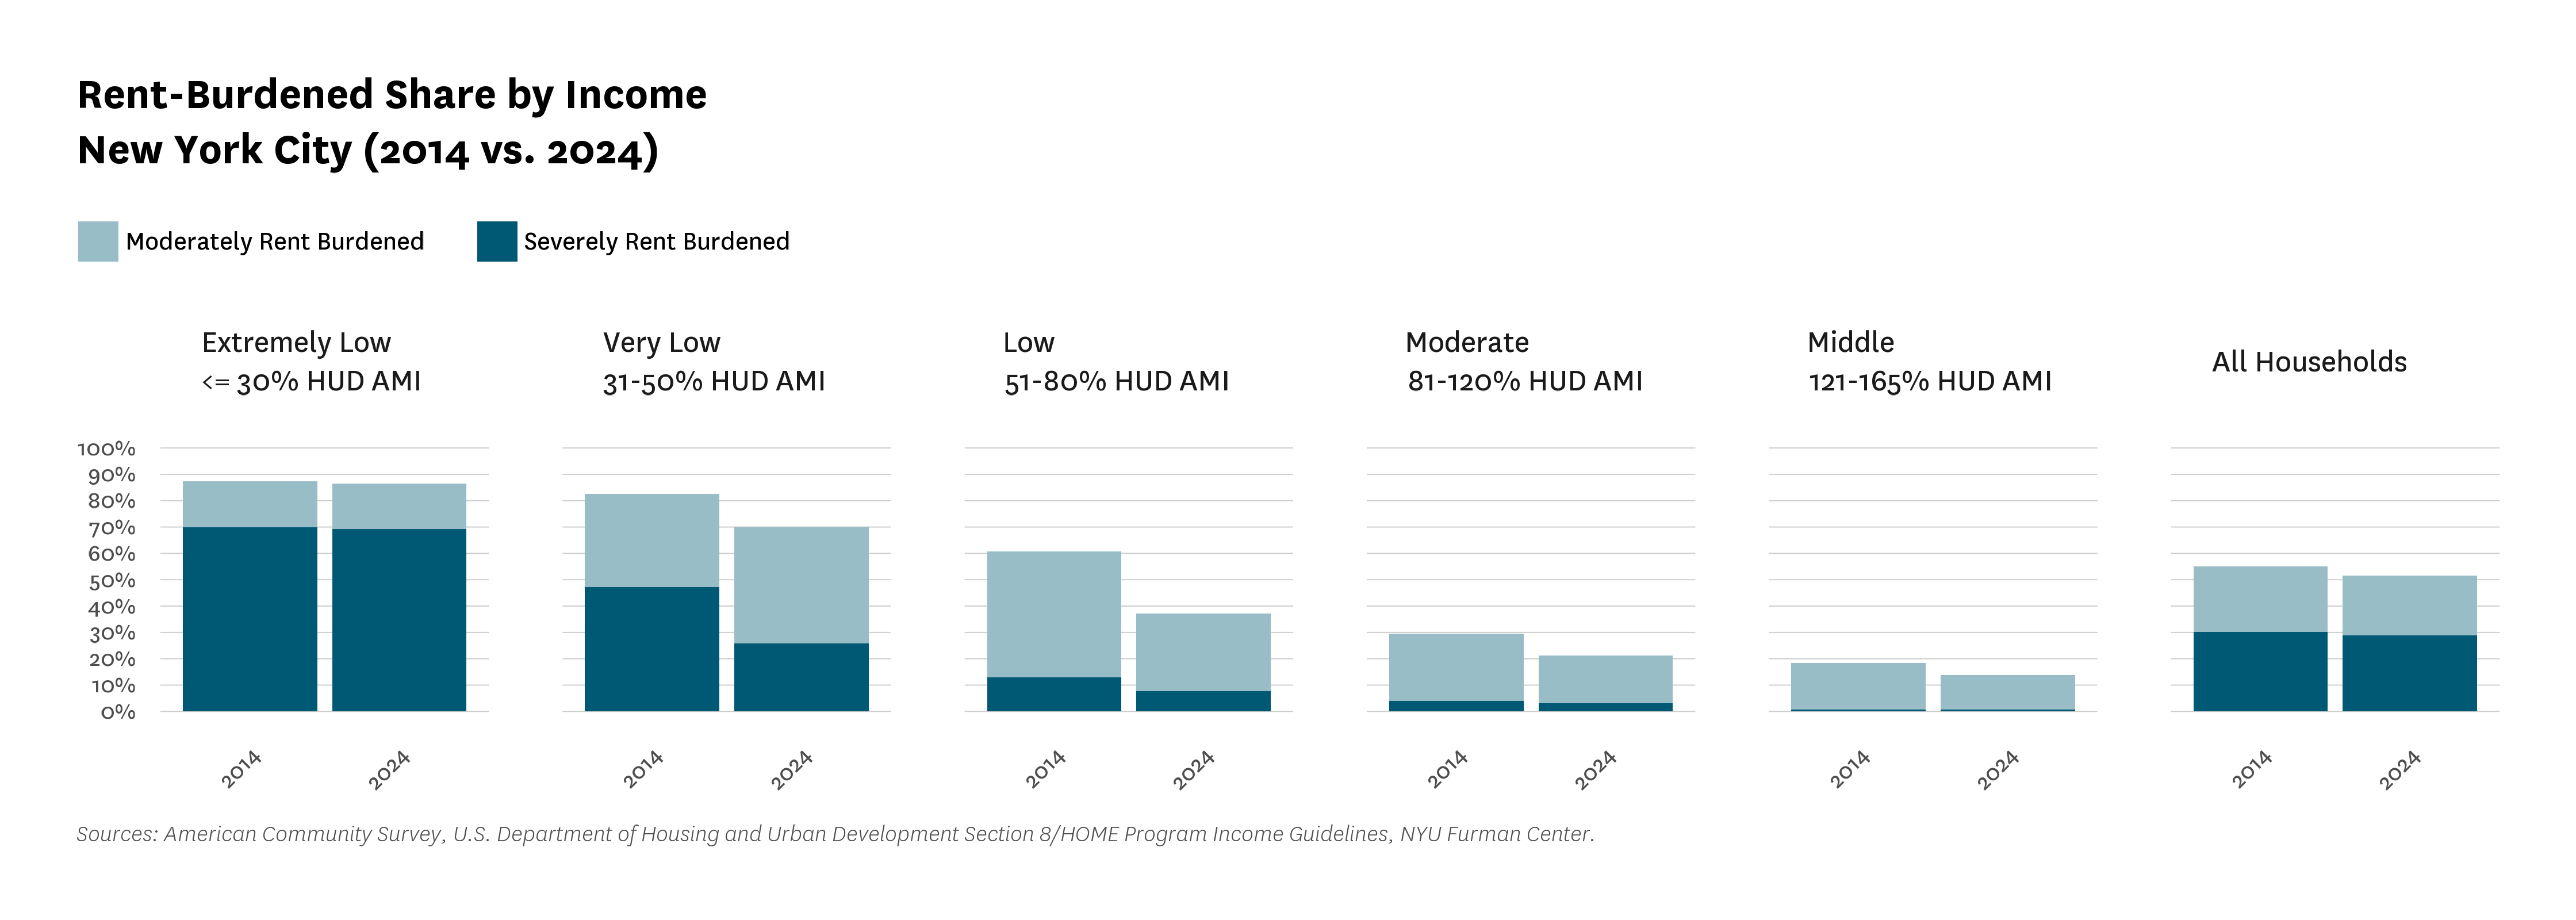
Despite rising incomes, affordability remains a persistent concern for New Yorkers. Just over half of renter households were rent-burdened in 2024—spending 30 percent or more of their income on rent (Figure 4). Between 2014 and 2024, the share of moderately burdened households fell from 25.0 to 22.8 percent, and the share of severely burdened households dropped from 30.2 to 28.8 percent. These citywide figures obscure variation across income groups, however. Low-income renters saw the largest decline in moderate burdens (18.4 percentage points), while very low-income renters saw a notable reduction in severe burdens (21.3 percentage points). In contrast, moderate- and middle-income renters experienced smaller shifts, with the share of severely rent-burdened middle-income renters remaining virtually unchanged (0.04 percentage points). Similarly, the share of extremely low-income households that are moderately and severely rent-burdened was persistently high, changing by less than one percentage point over the last decade.
Figure 4:
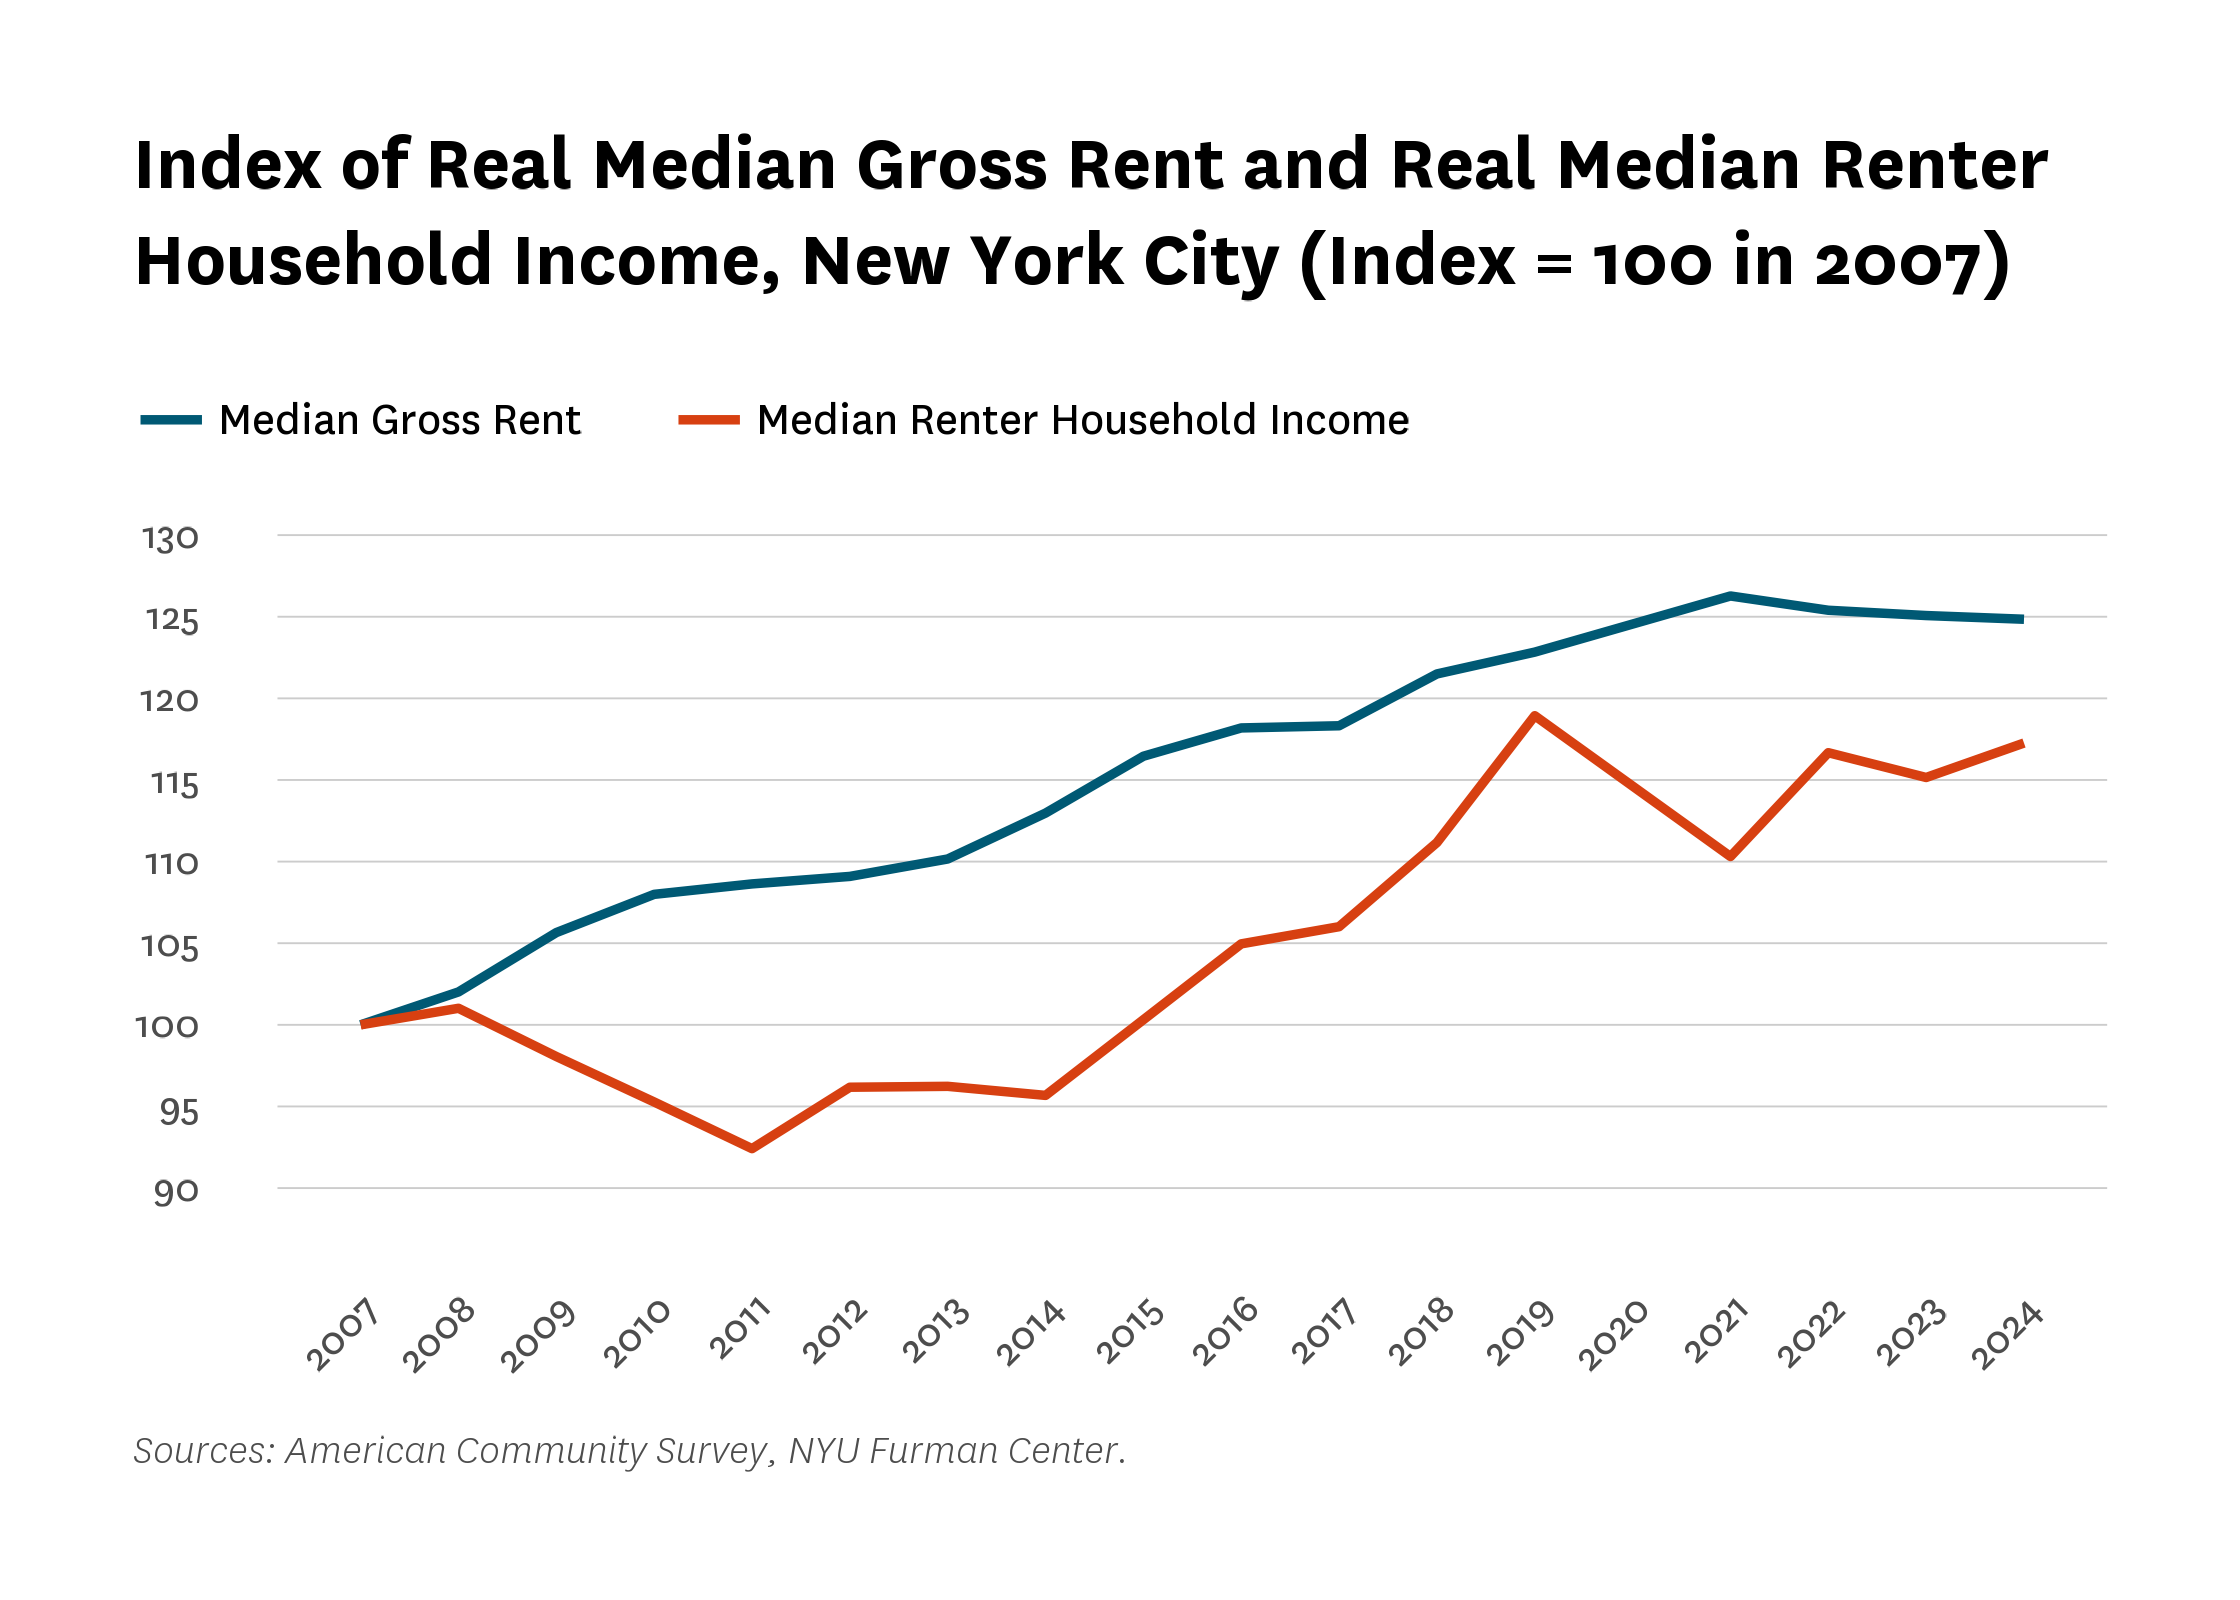
Over the past decade, renter incomes have not consistently kept pace with rental housing costs. Between 2014 and 2019, incomes increased enough to almost match increases in rent levels, with 2019 marking the most affordable point since the Great Recession (Figure 5). That trend reversed during the pandemic: by 2021, renter incomes had fallen to 110 percent of their 2007 value—down from 119 percent in 2019—while rents climbed to 126 percent of their 2007 value. Incomes have since partially rebounded to 117 percent of their 2007 value in 2024. However, during this period, rents held relatively steady at about 125 percent of their 2007 value. The flattening of rents and increases in renter household income between 2021 and 2024 is an encouraging trend as the city continues its recovery from the pandemic.
Figure 5:
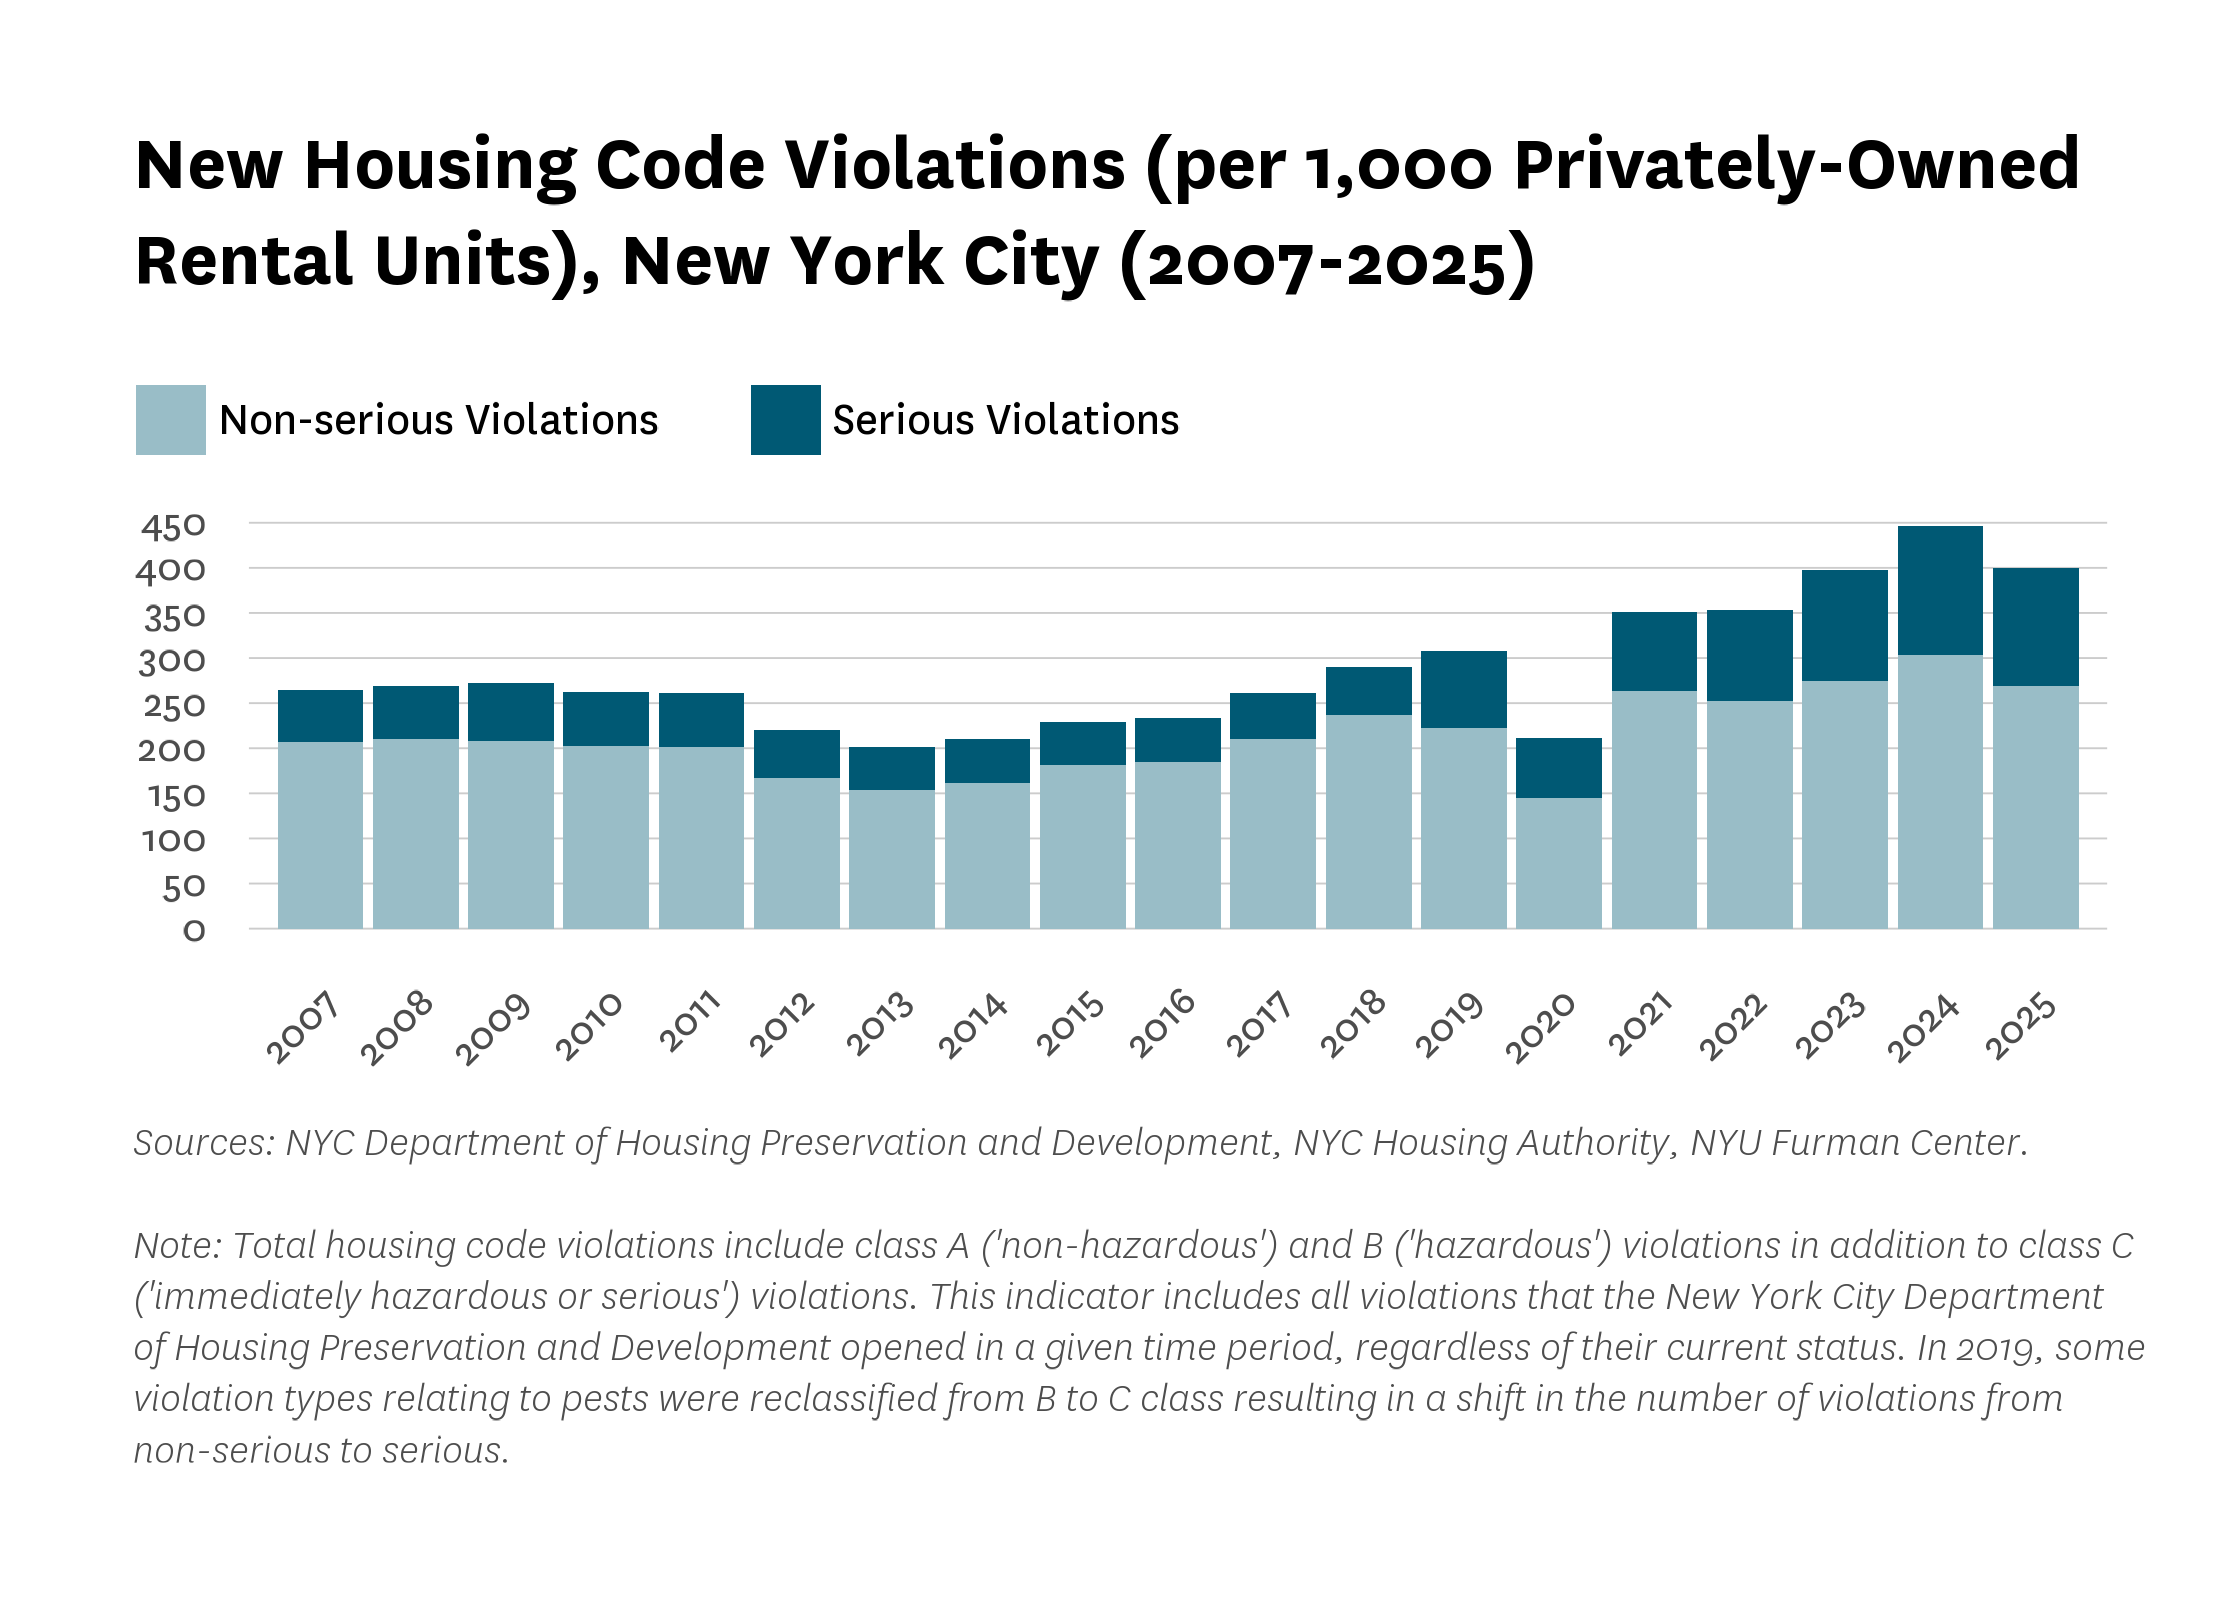
Indicators of housing quality suggest that trends over the last three years in violation counts may be driven by some combination of increased HPD enforcement activity and growing physical distress in the multifamily stock. Between 2024 and 2025, the rate of new housing code violations declined back to 2023 levels (Figure 6) but 2023 violations counts were still higher than every prior year. Non-serious violations declined by 11.6 percent, while serious violations declined by 8.4 percent but still remained above 2023 numbers.
Figure 6:
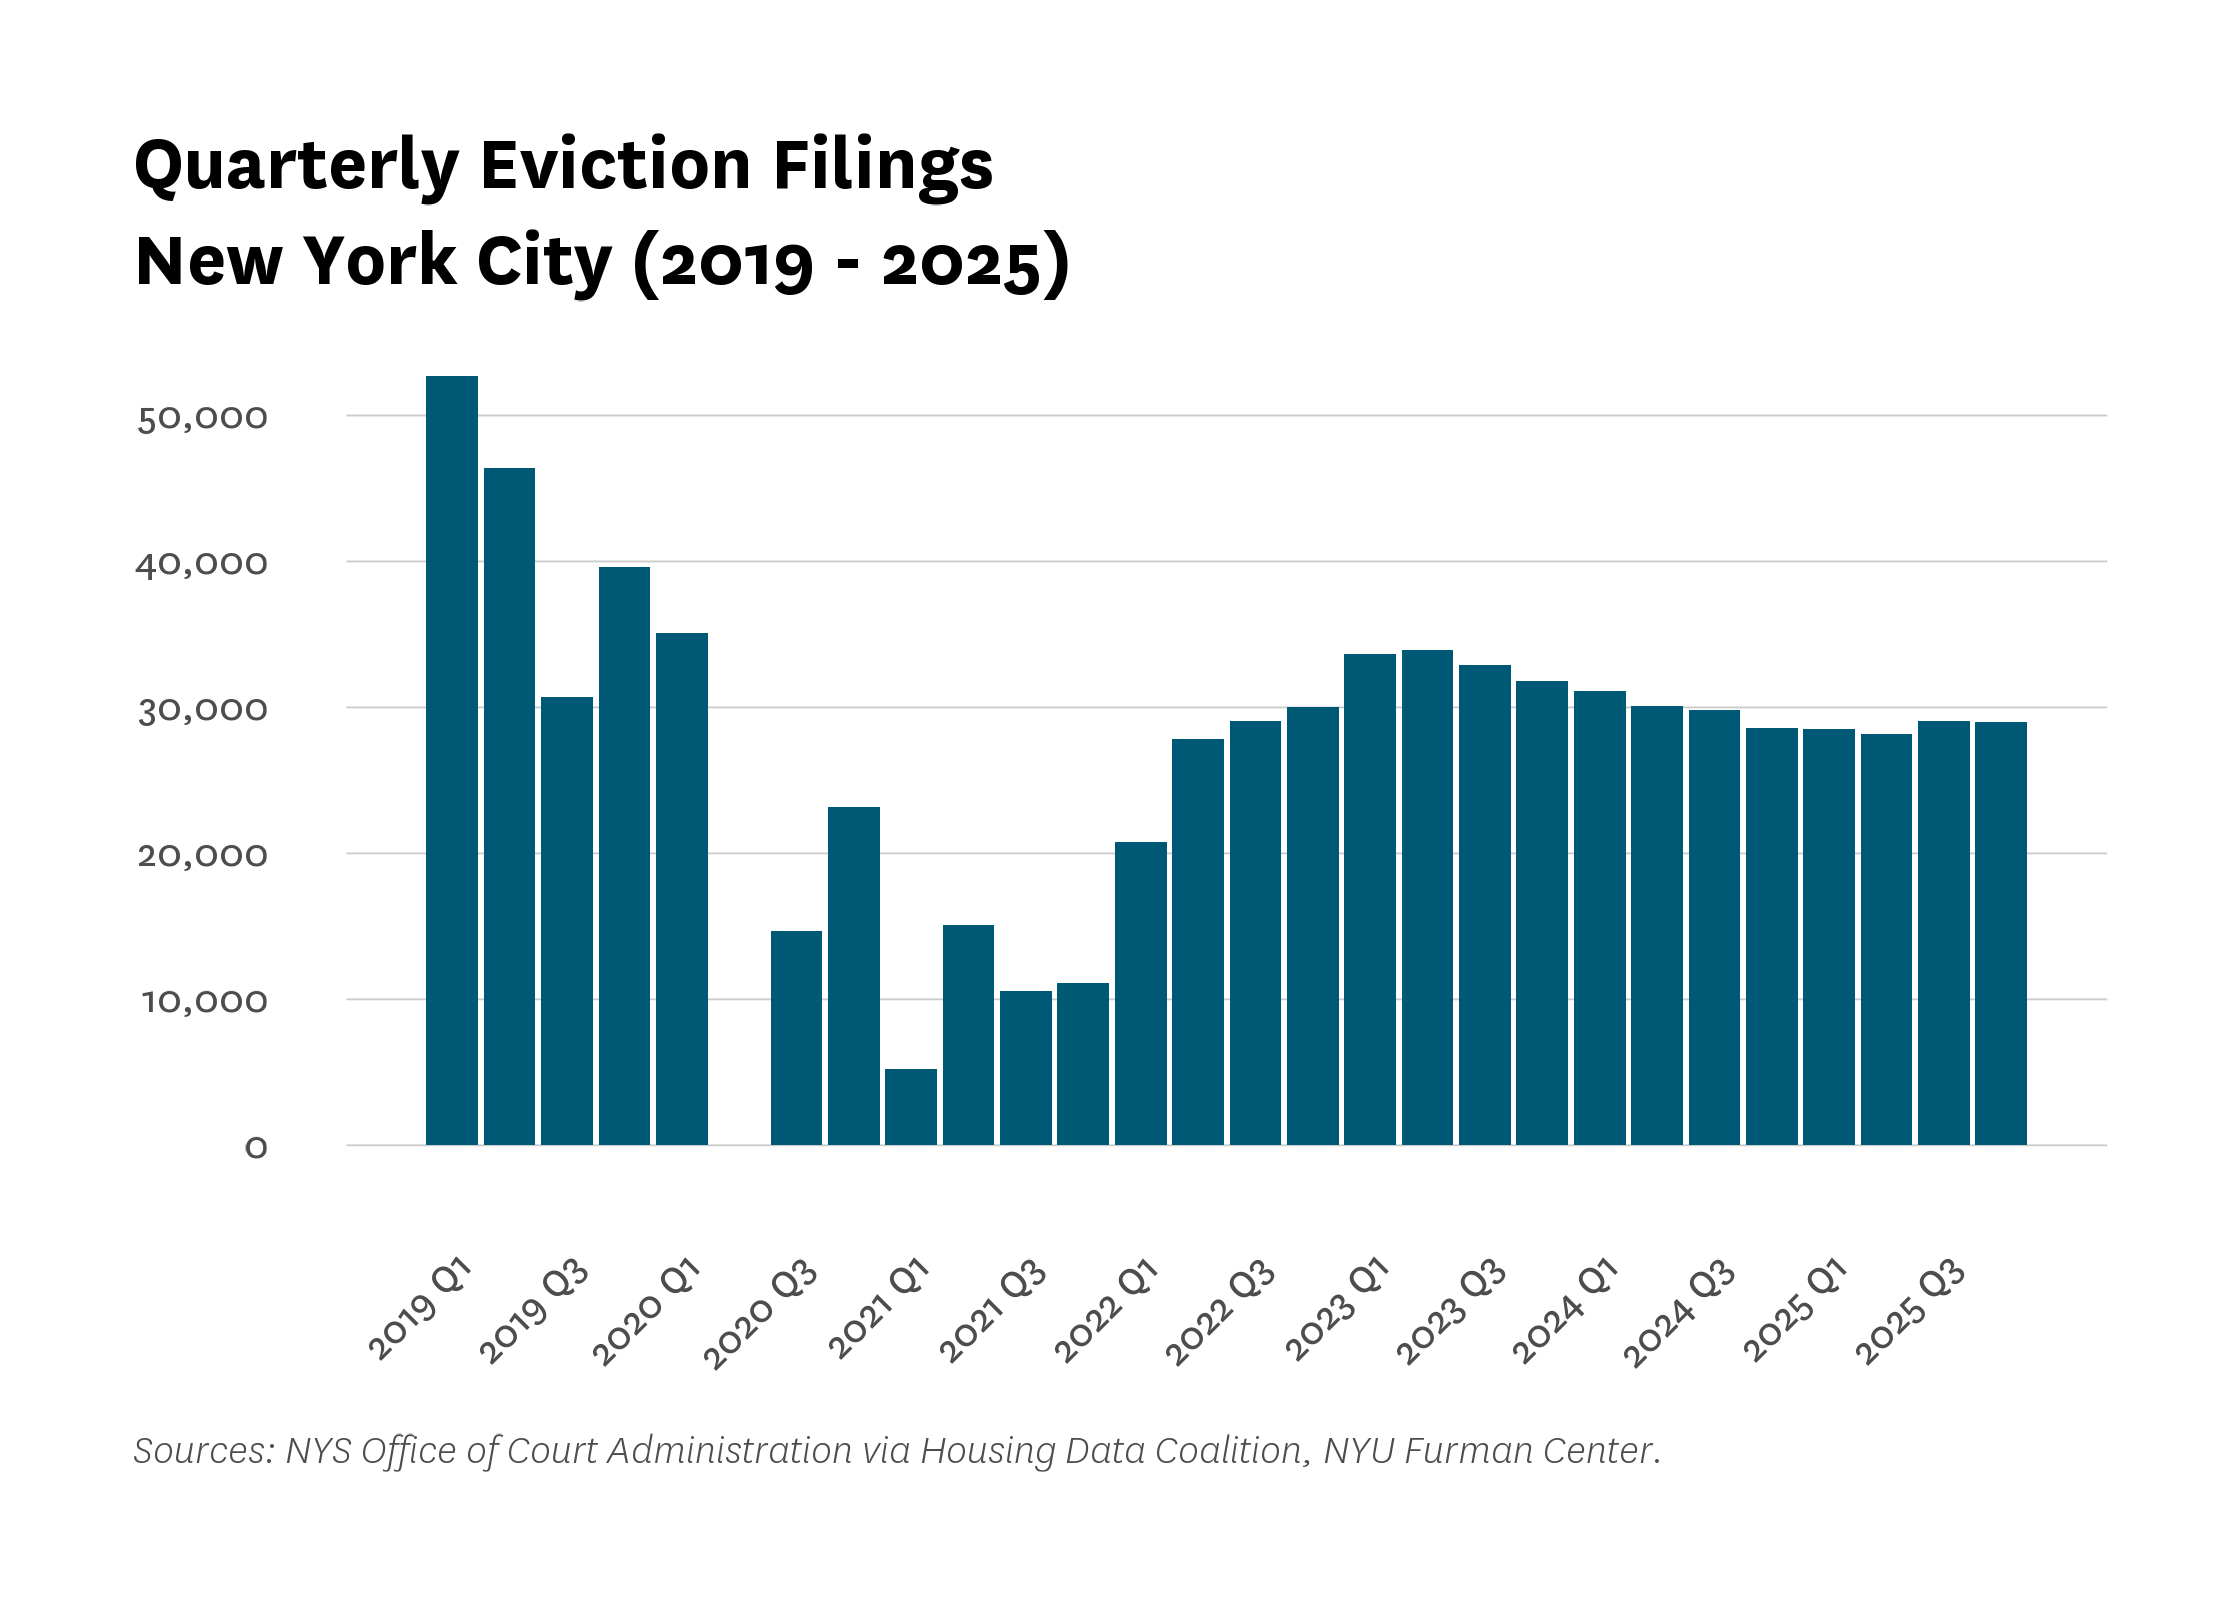
Eviction filings in 2025 remained well below pre-pandemic levels, as shown in Figure 7 by comparing the 2019 and early 2020 quarterly filings (ranging from 30,695 filings to 52,734 filings per quarter) to 2025 quarterly filings (ranging from 28,165 to 29,041 filings per quarter). Between 2024 and 2025, the total number of filings declined by 4.2 percent. Housing courts saw 114,681 new eviction filings in 2025, a decline from the previous two years, but still higher than in 2020, 2021, and 2022, when the pandemic and emergency policy interventions both sharply curtailed filings and limited court operations.
Figure 7:
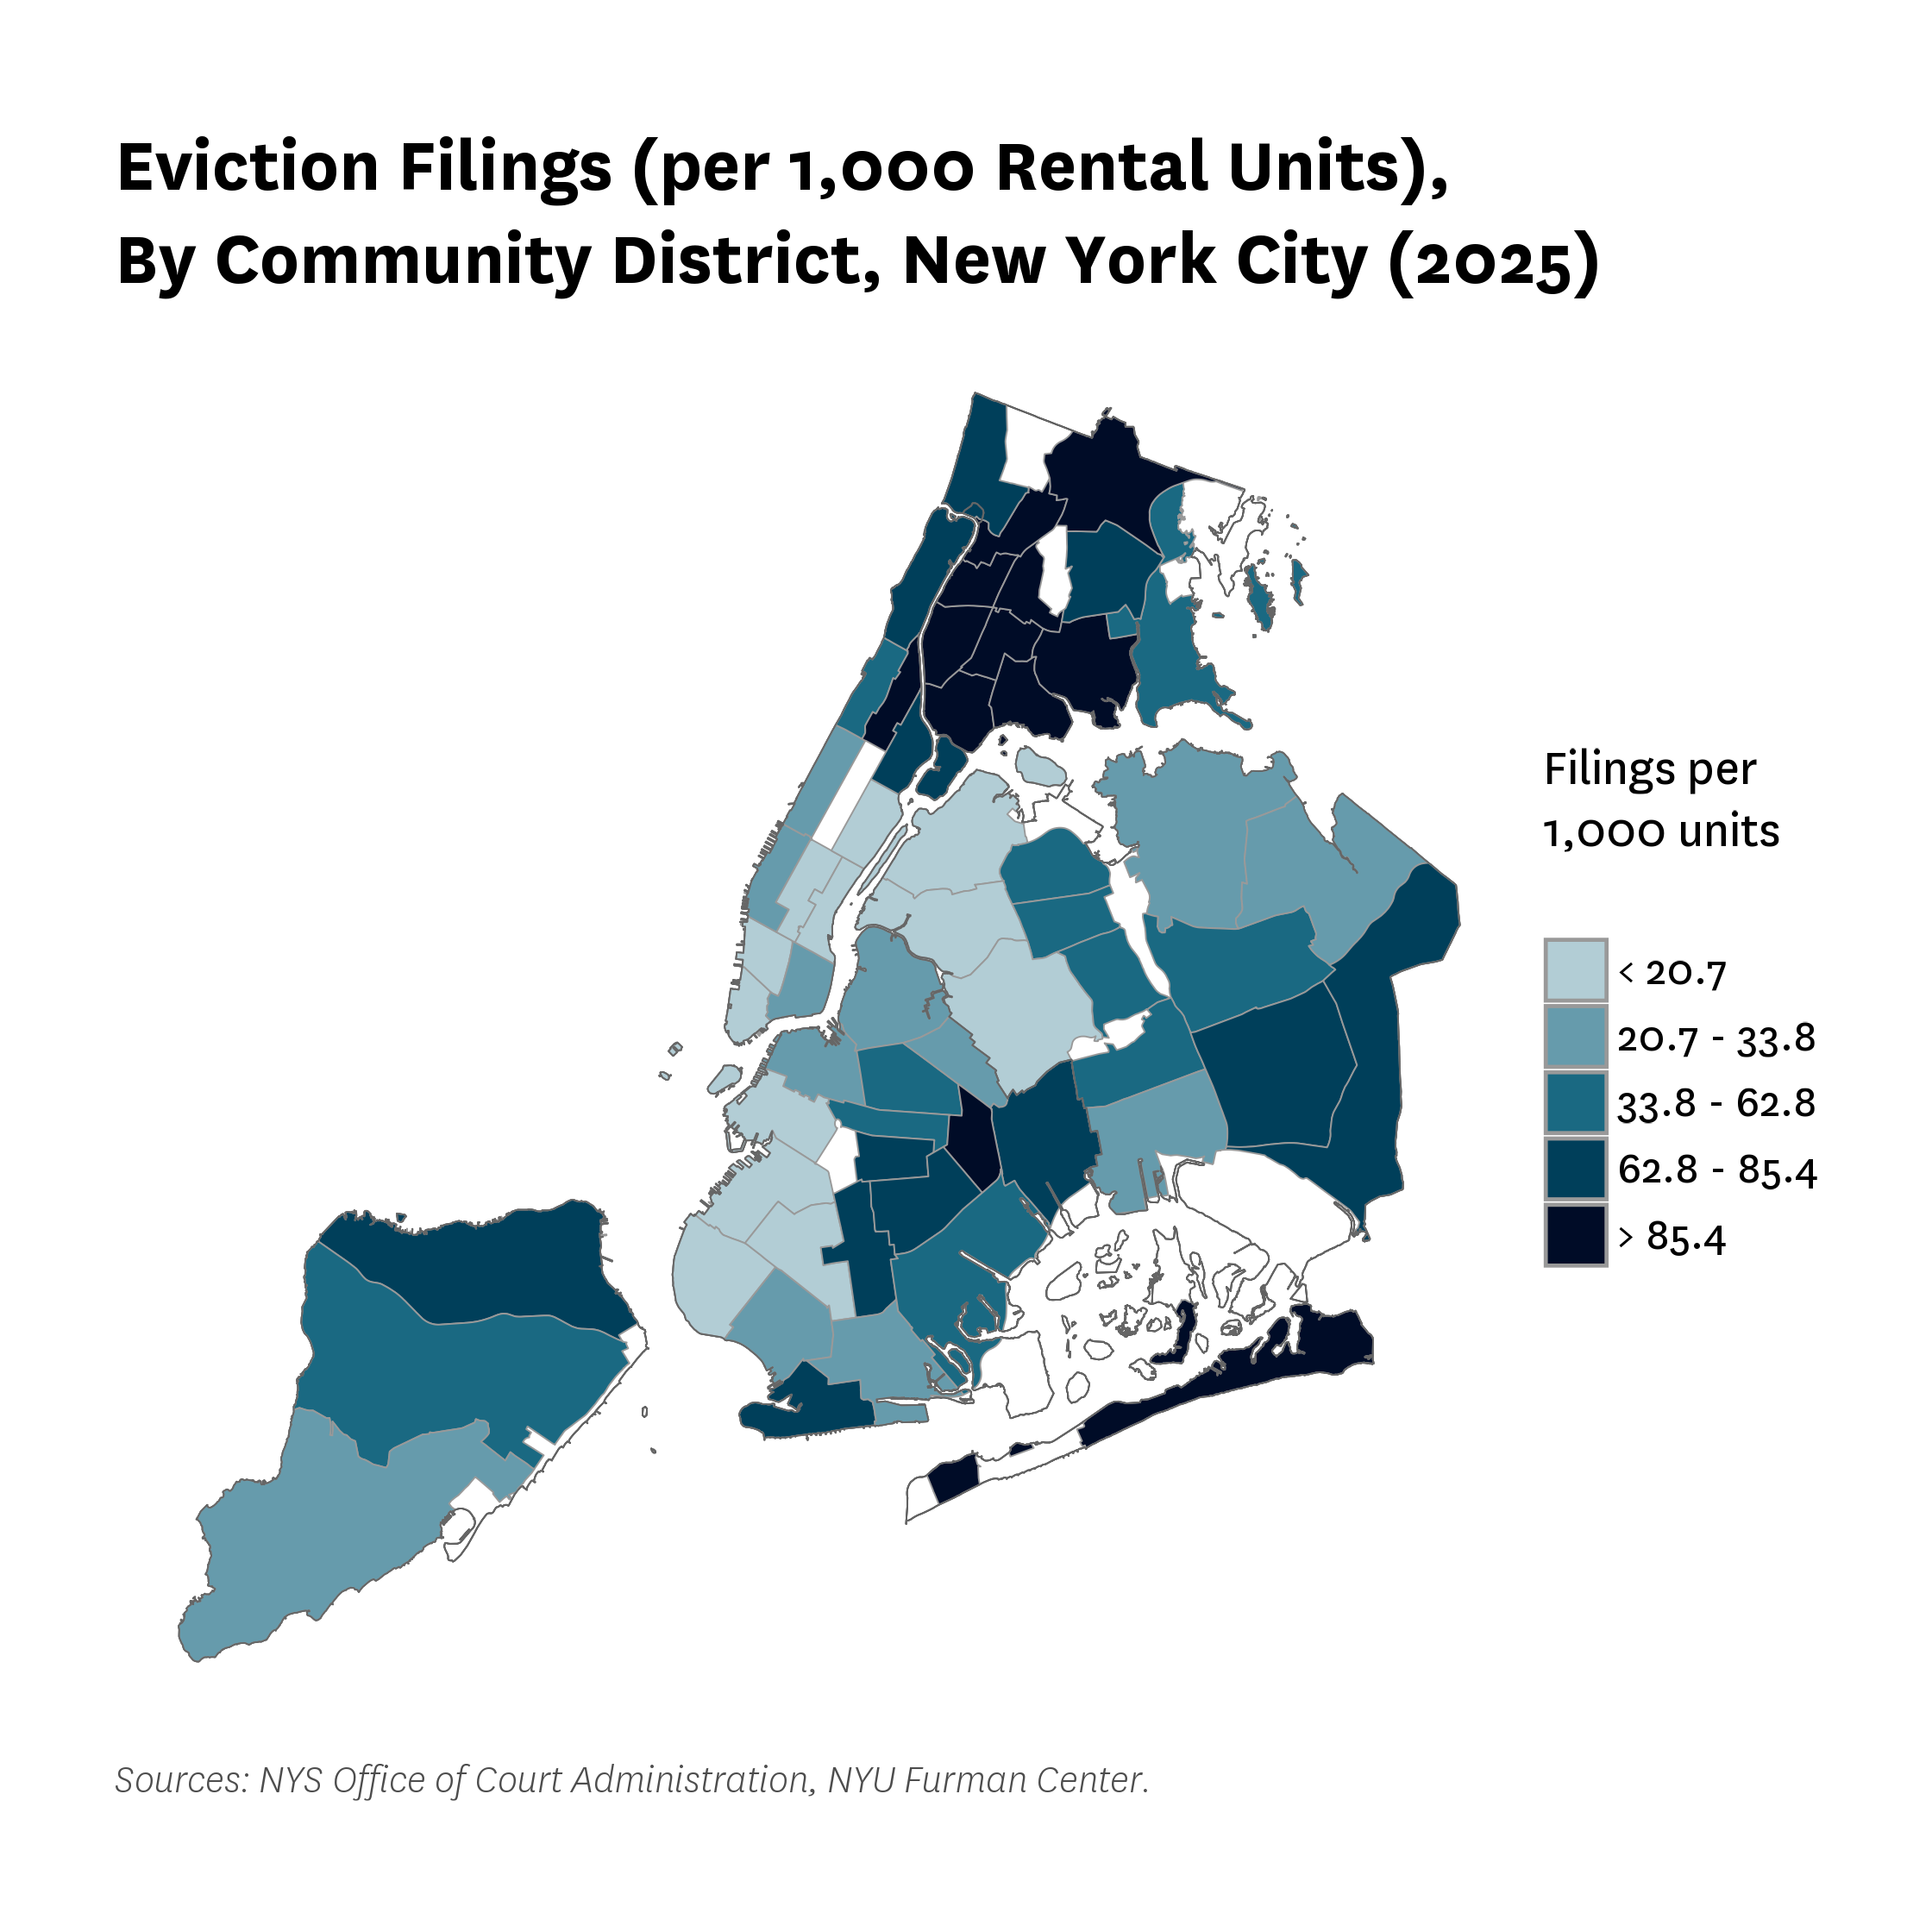
Geographic disparities in eviction risk remain stark. In 2024, eviction filing rates ranged from 11.2 per 1,000 rental units in Greenwich Village/Soho to 120.8 per 1,000 rental units in Fordham/University Heights (Figure 8). The Bronx had the highest borough-wide rate (93.79), followed by Queens (46.01), Staten Island (45.77), Brooklyn (43.42), and Manhattan (35.43). The seven community districts with the highest filing rates were all in the Bronx; the eighth was Rockaway/Broad Channel in Queens. These figures highlight the geography of housing instability, even as citywide eviction filings trend downward.
Figure 8: