
State of Homeowners and Their Homes 2025
This section outlines major trends in homeownership, home financing, and residential property values in New York City, as shown in the charts that follow. Although the overall homeownership rate across the city has stayed relatively consistent over the past decade, the financial and market conditions influencing how households access, maintain, and benefit from homeownership have evolved. Rising interest rates, shifts in mortgage activity, cost burdens, and geographically uneven sales price trends have shaped both access to homeownership and its outcomes across neighborhoods and demographic groups. Unless otherwise noted, all income and property value figures in this section are adjusted for inflation and presented in 2024 dollars.
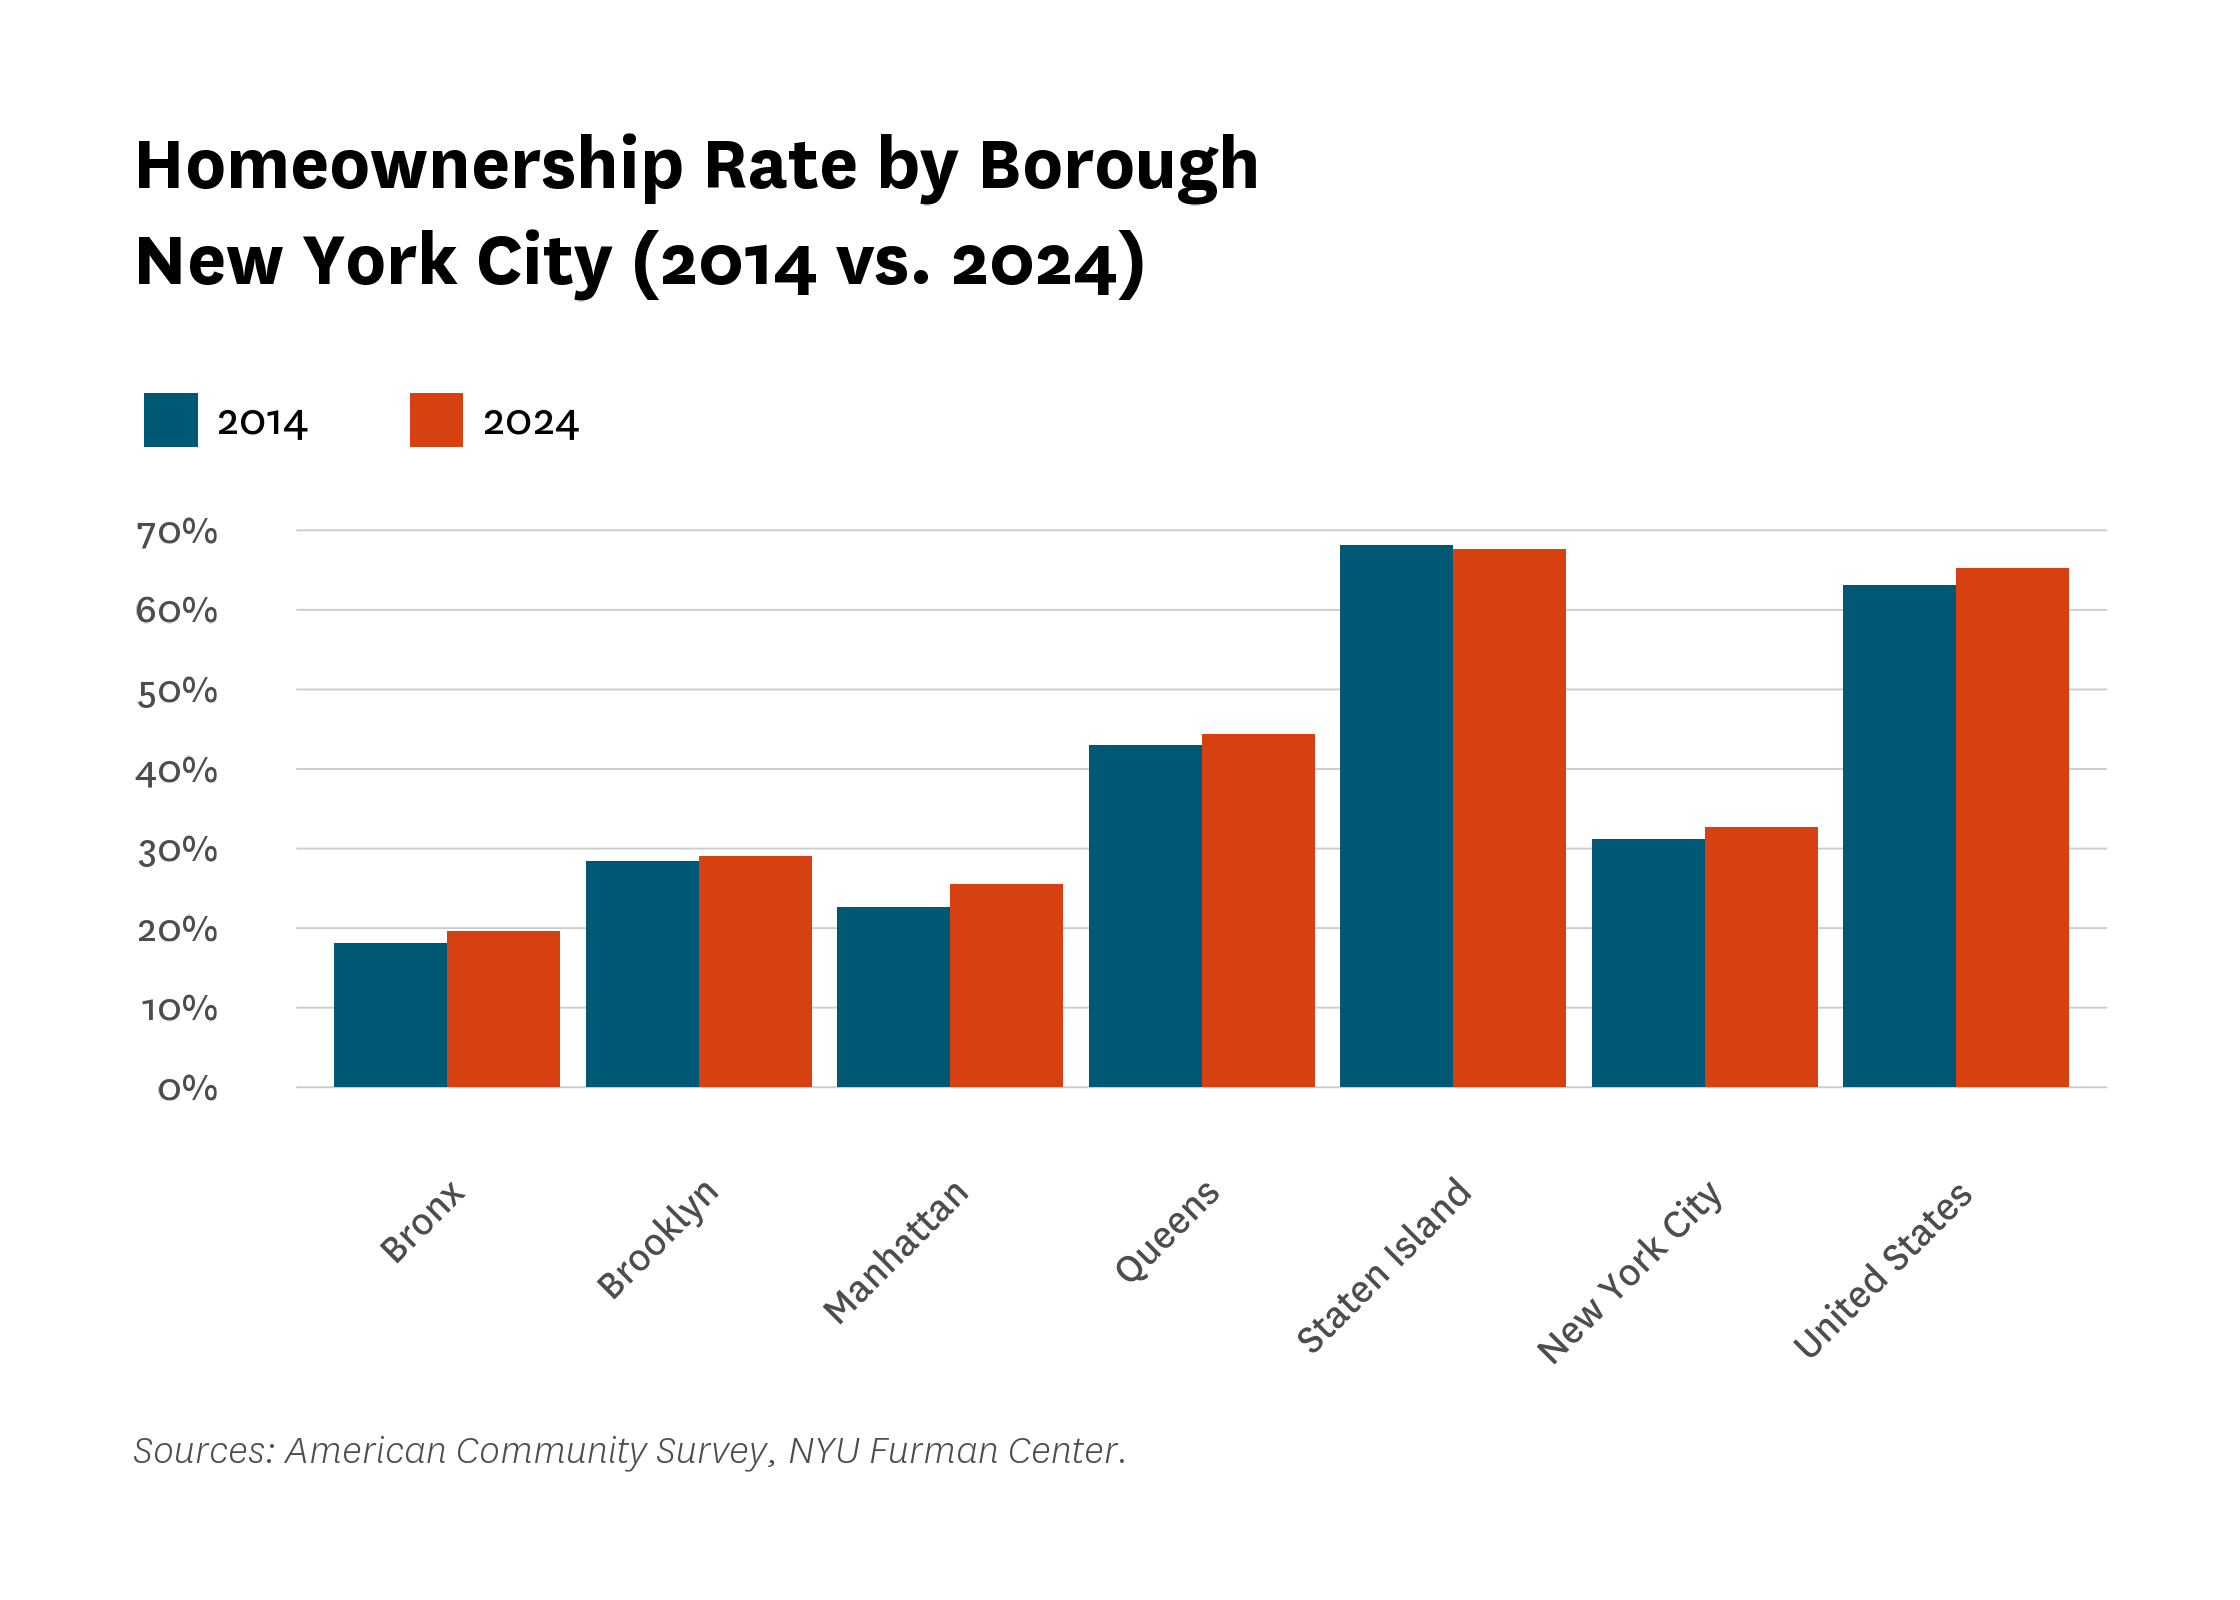
The homeownership rate in New York City has remained largely unchanged over the past decade, rising only marginally from 31.2 percent in 2014 to 32.7 percent in 2024 (Figure 1). Staten Island consistently reported the highest homeownership rate at 67.7 percent, which remains above the national average of 65.3 percent. Queens had the second-highest rate at 44.4 percent, while the Bronx (19.7 percent), Brooklyn (29.1 percent), and Manhattan (25.6 percent) remained below the citywide average. Only Staten Island experienced a decline in homeownership over the period.
Figure 1:
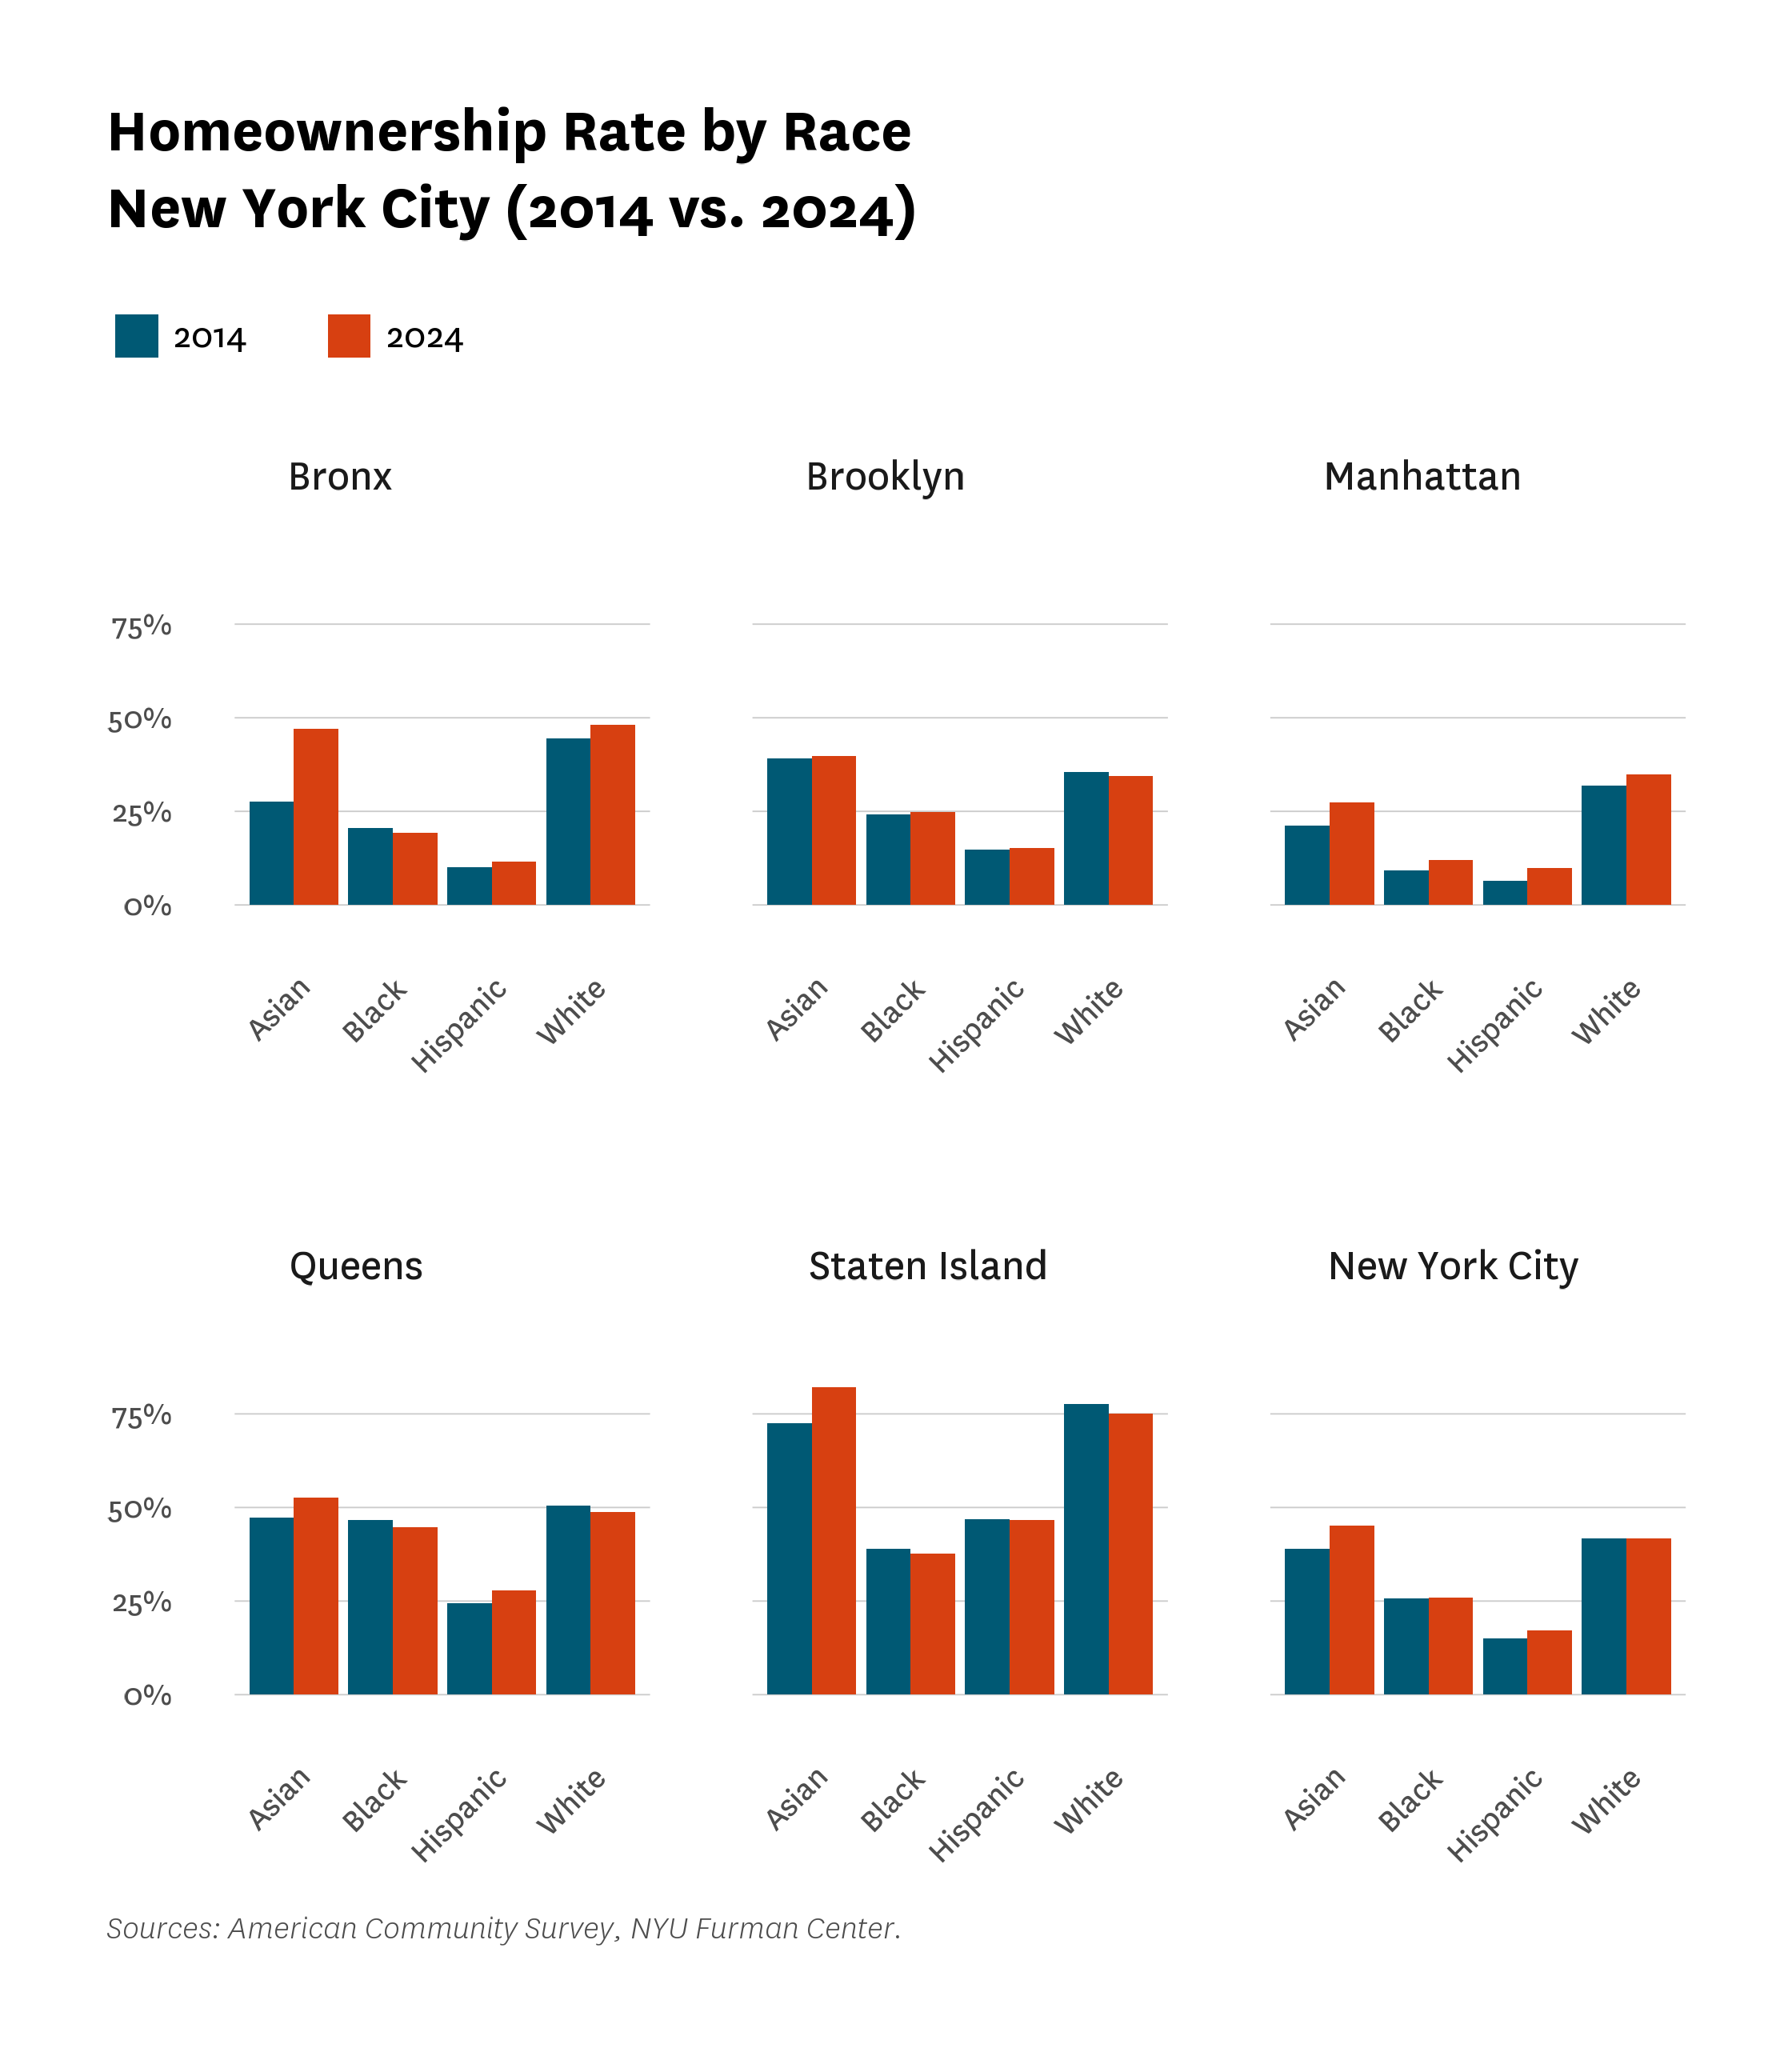
Homeownership outcomes vary widely across racial and ethnic groups. As shown in Figure 2, Asian households had the highest homeownership rate across the city in 2024 at 45.2 percent, followed by white households at 41.7 percent. Black and Hispanic households had significantly lower rates at 25.9 percent and 17.2 percent, respectively. The widest disparities were observed in Staten Island, where homeownership rates for Asian and white households exceeded those of Black and Hispanic households by more than 28 percentage points. The Bronx and Manhattan also showed large racial gaps, while Queens had the smallest, with just a 4-point difference between Black and white households.
Over the past decade, Asian households saw the largest citywide increase in homeownership—rising by 6.1 percentage points—at least 4 percentage points more than any other racial or ethnic group. White homeownership remained essentially flat citywide (declining by less than 0.1 percentage points), while Black ownership increased only marginally (0.1 percentage points) and Hispanic rates rose more noticeably (2.1 percentage points). At the borough level, Black homeownership declined in the Bronx, Queens, and Staten Island; Hispanic homeownership declined in Staten Island, and white homeownership declined in Brooklyn, Queens, and Staten Island. These changes contributed to persistent disparities in ownership across race and geography.
Figure 2:
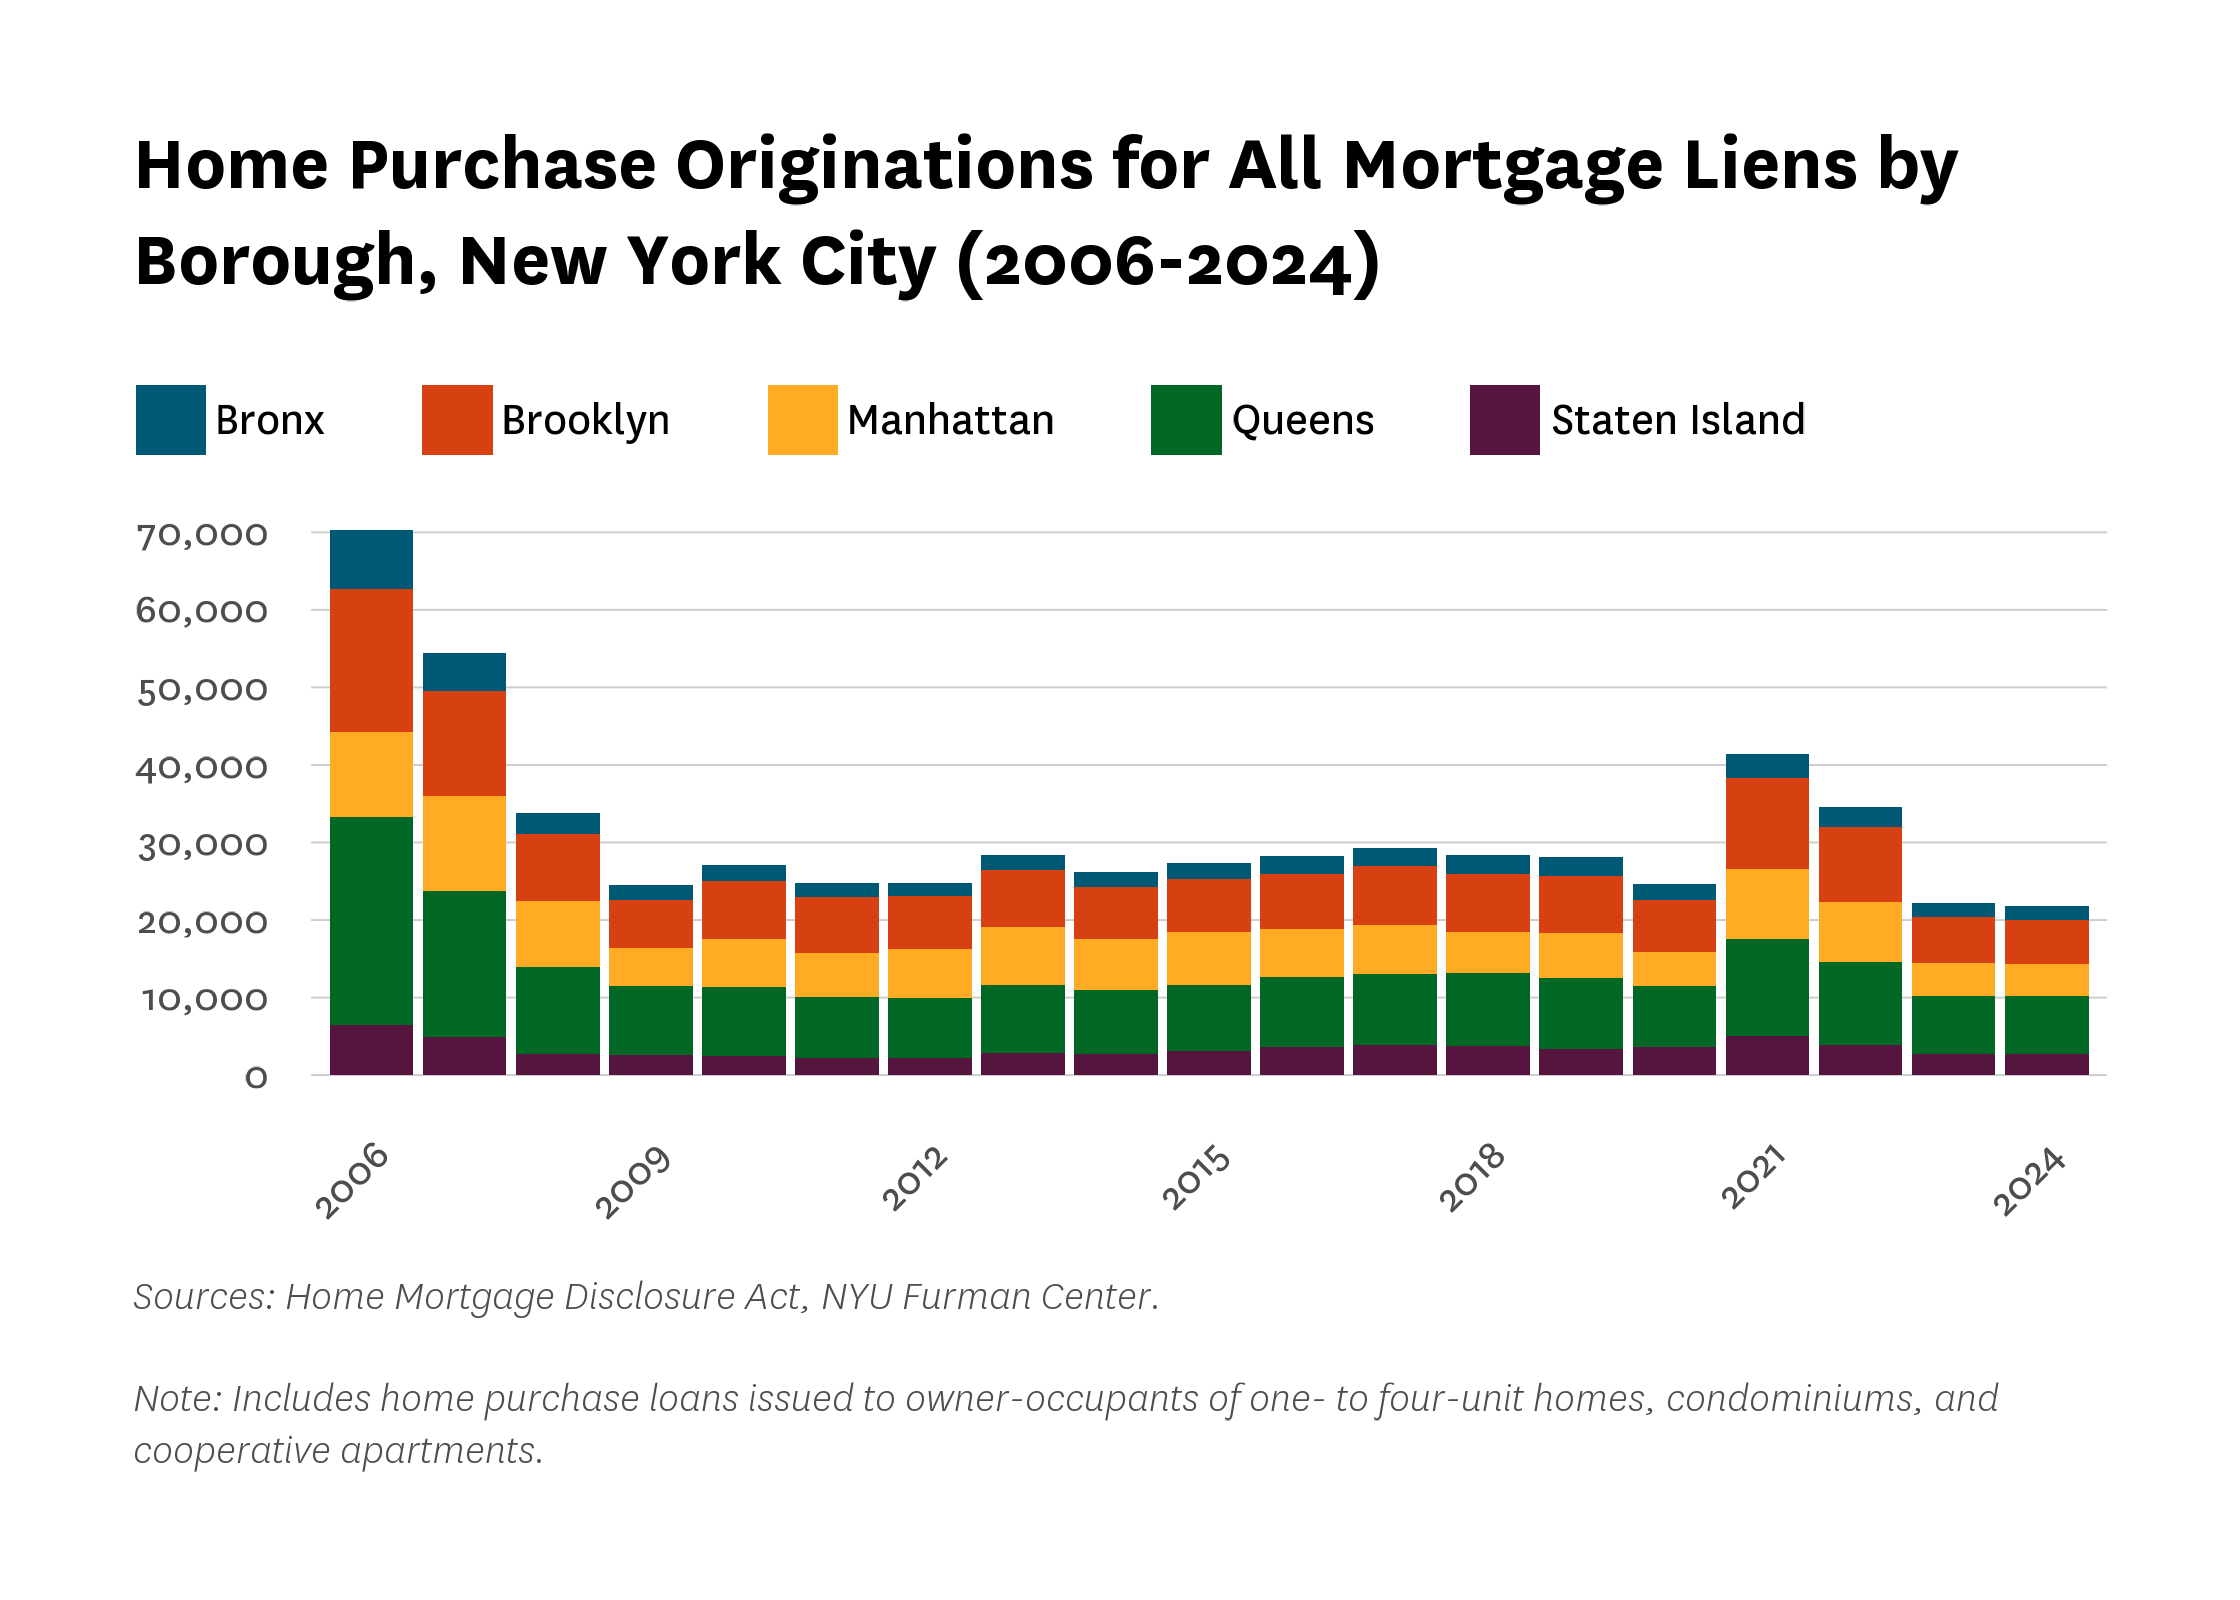
Mortgage activity shifted only slightly in 2024. In 2021, there was a citywide 67.8 percent increase in mortgage-financed home originations during the pandemic, followed by a 16.6 percent drop in activity in 2022, a 35.8 percent drop in 2023, and a further 1.6 percent drop in 2024. In 2024, Manhattan saw the largest year-over-year decline in originations (5.3 percent), while Queens had the smallest decline (0.9 percent) and Staten Island was the only borough to see a modest increase (2.9 percent). The drop in mortgage activity from 2021 may reflect both reduced homebuying and changes in interest rates.
Figure 3:
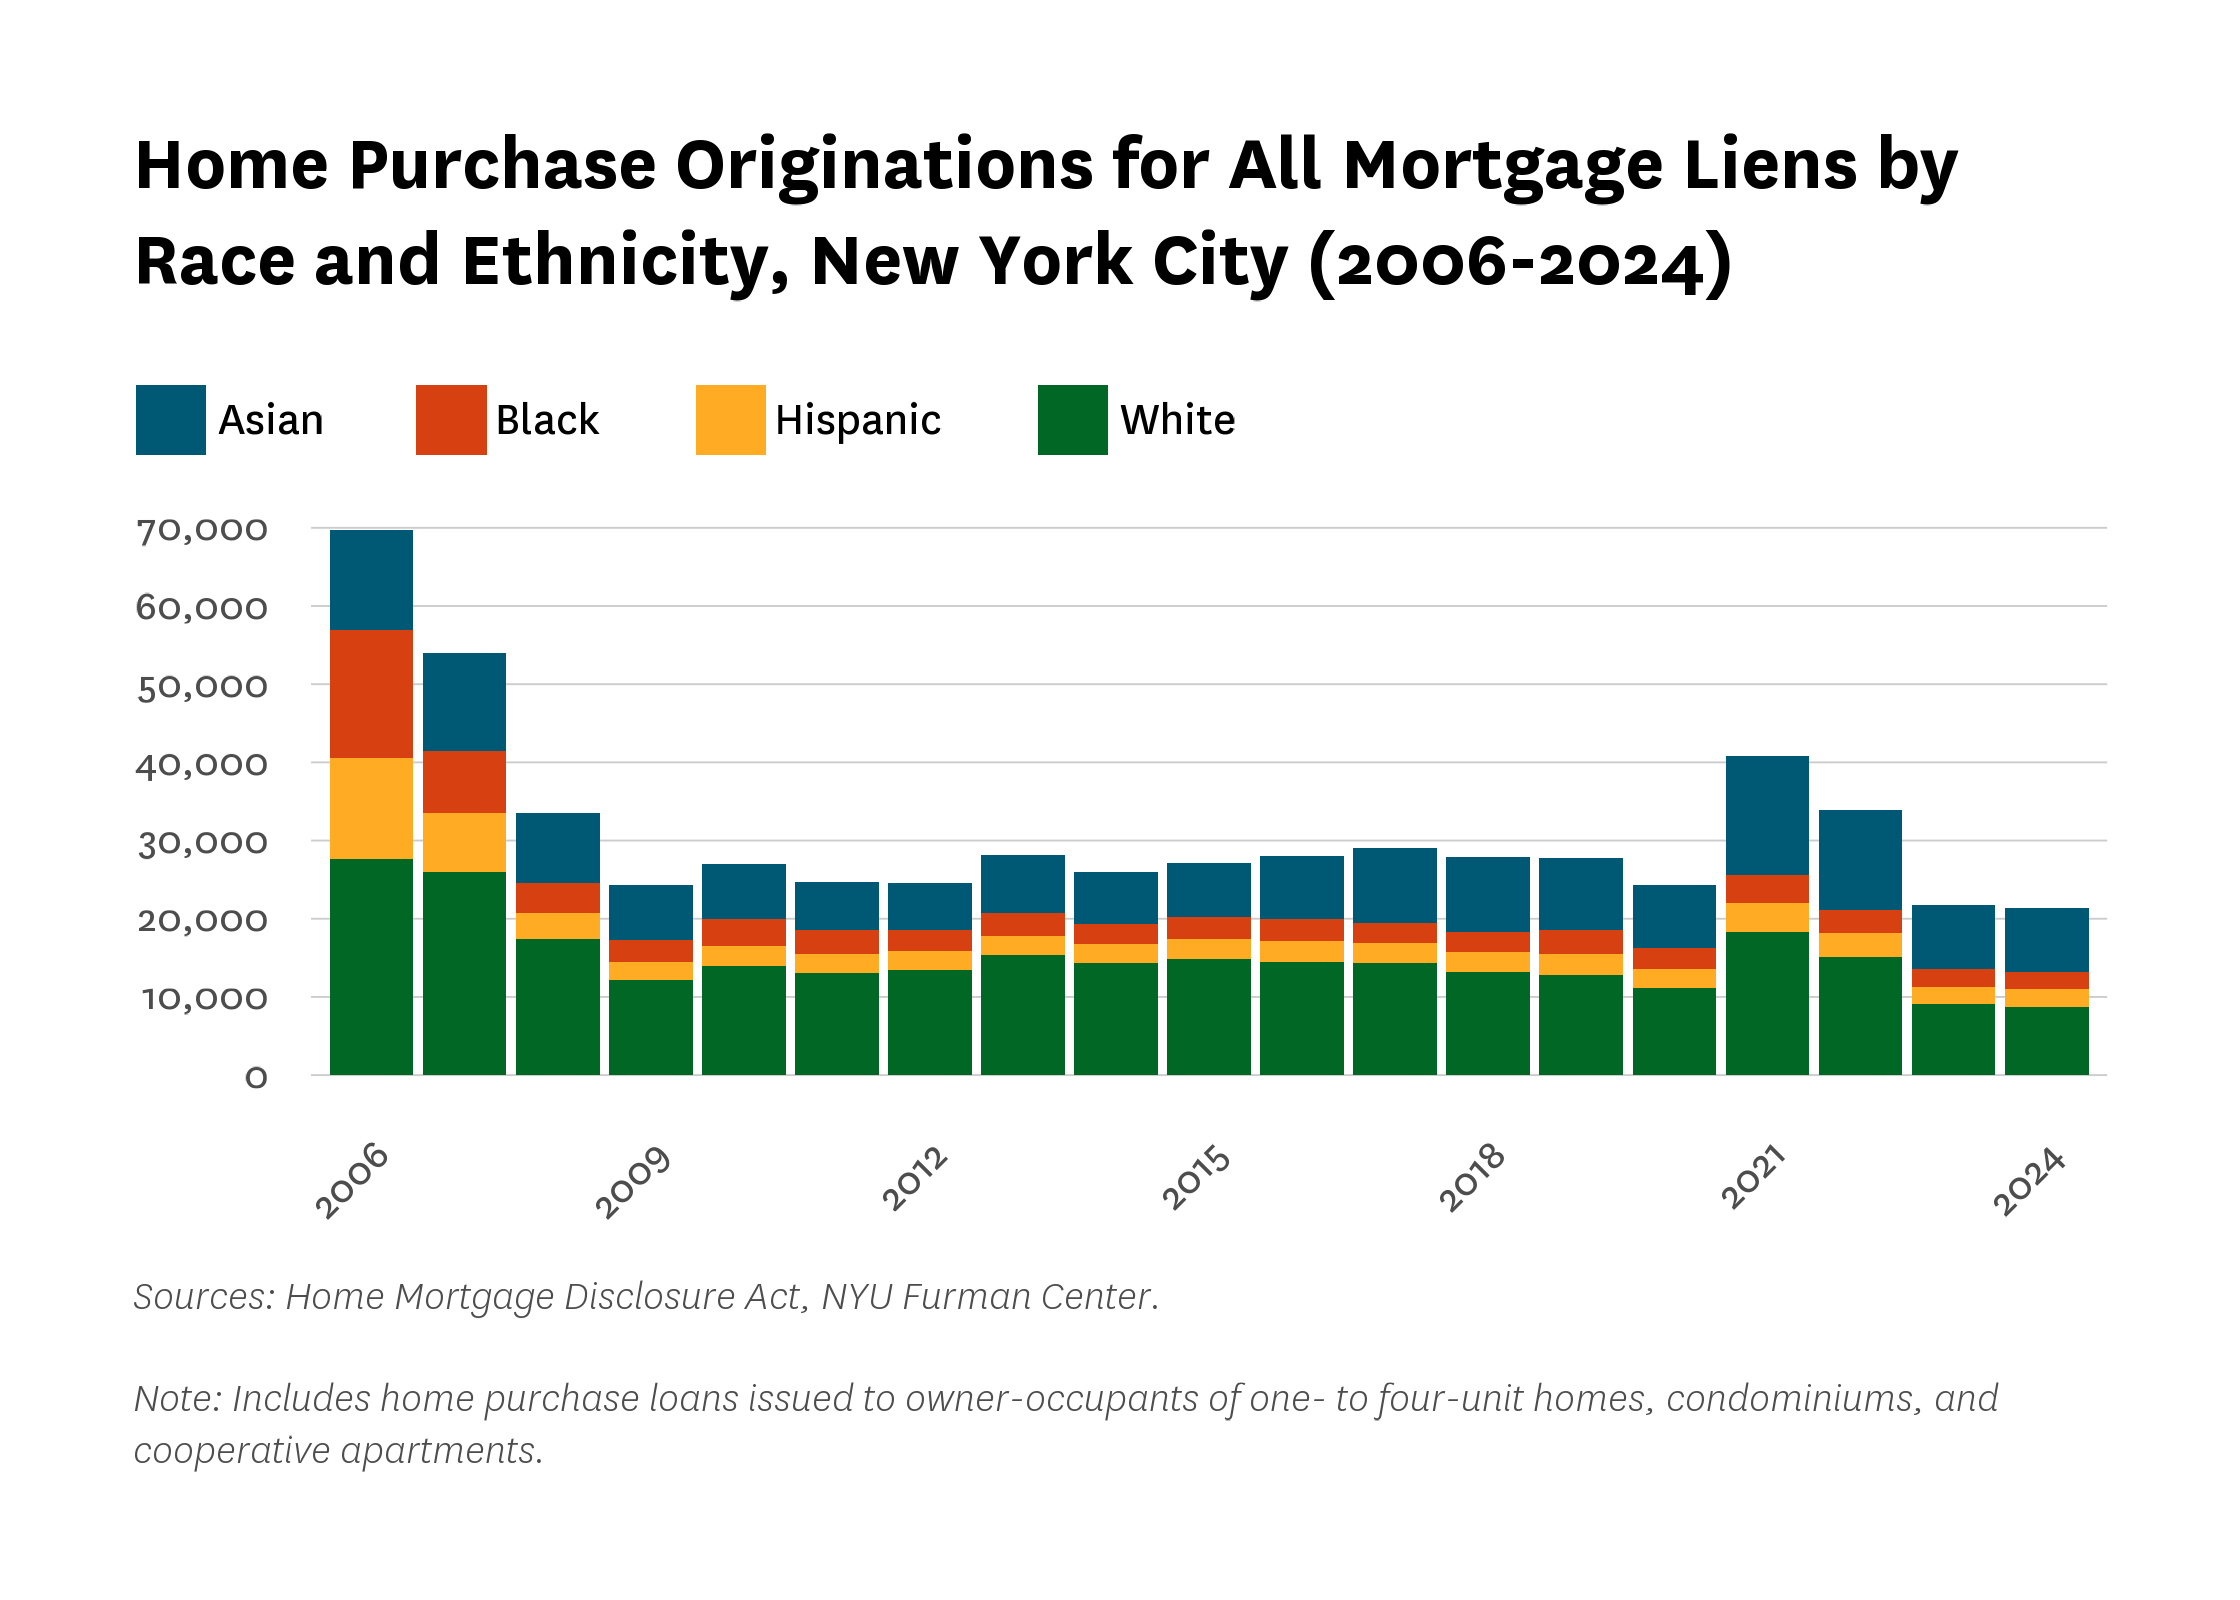
The slowdown in mortgage activity over the last two years has been broad-based across racial and ethnic groups. As shown in Figure 4, all racial and ethnic groups experienced similar levels of mortgage originations between 2023 and 2024, after the sharp drop from 2022. In 2024, while activity was largely flat compared to the prior year, White borrowers experienced the largest decline (4.4 percent) but continued to represent the largest share of originations (40.7 percent). Asian borrowers made up the second-largest share at 38.5 percent, seeing a marginal increase of 0.3 percent. Black and Hispanic borrowers each made up about 10 percent of total originations in 2024, experiencing changes of −3.4 percent and +3.6 percent, respectively.
Figure 4:
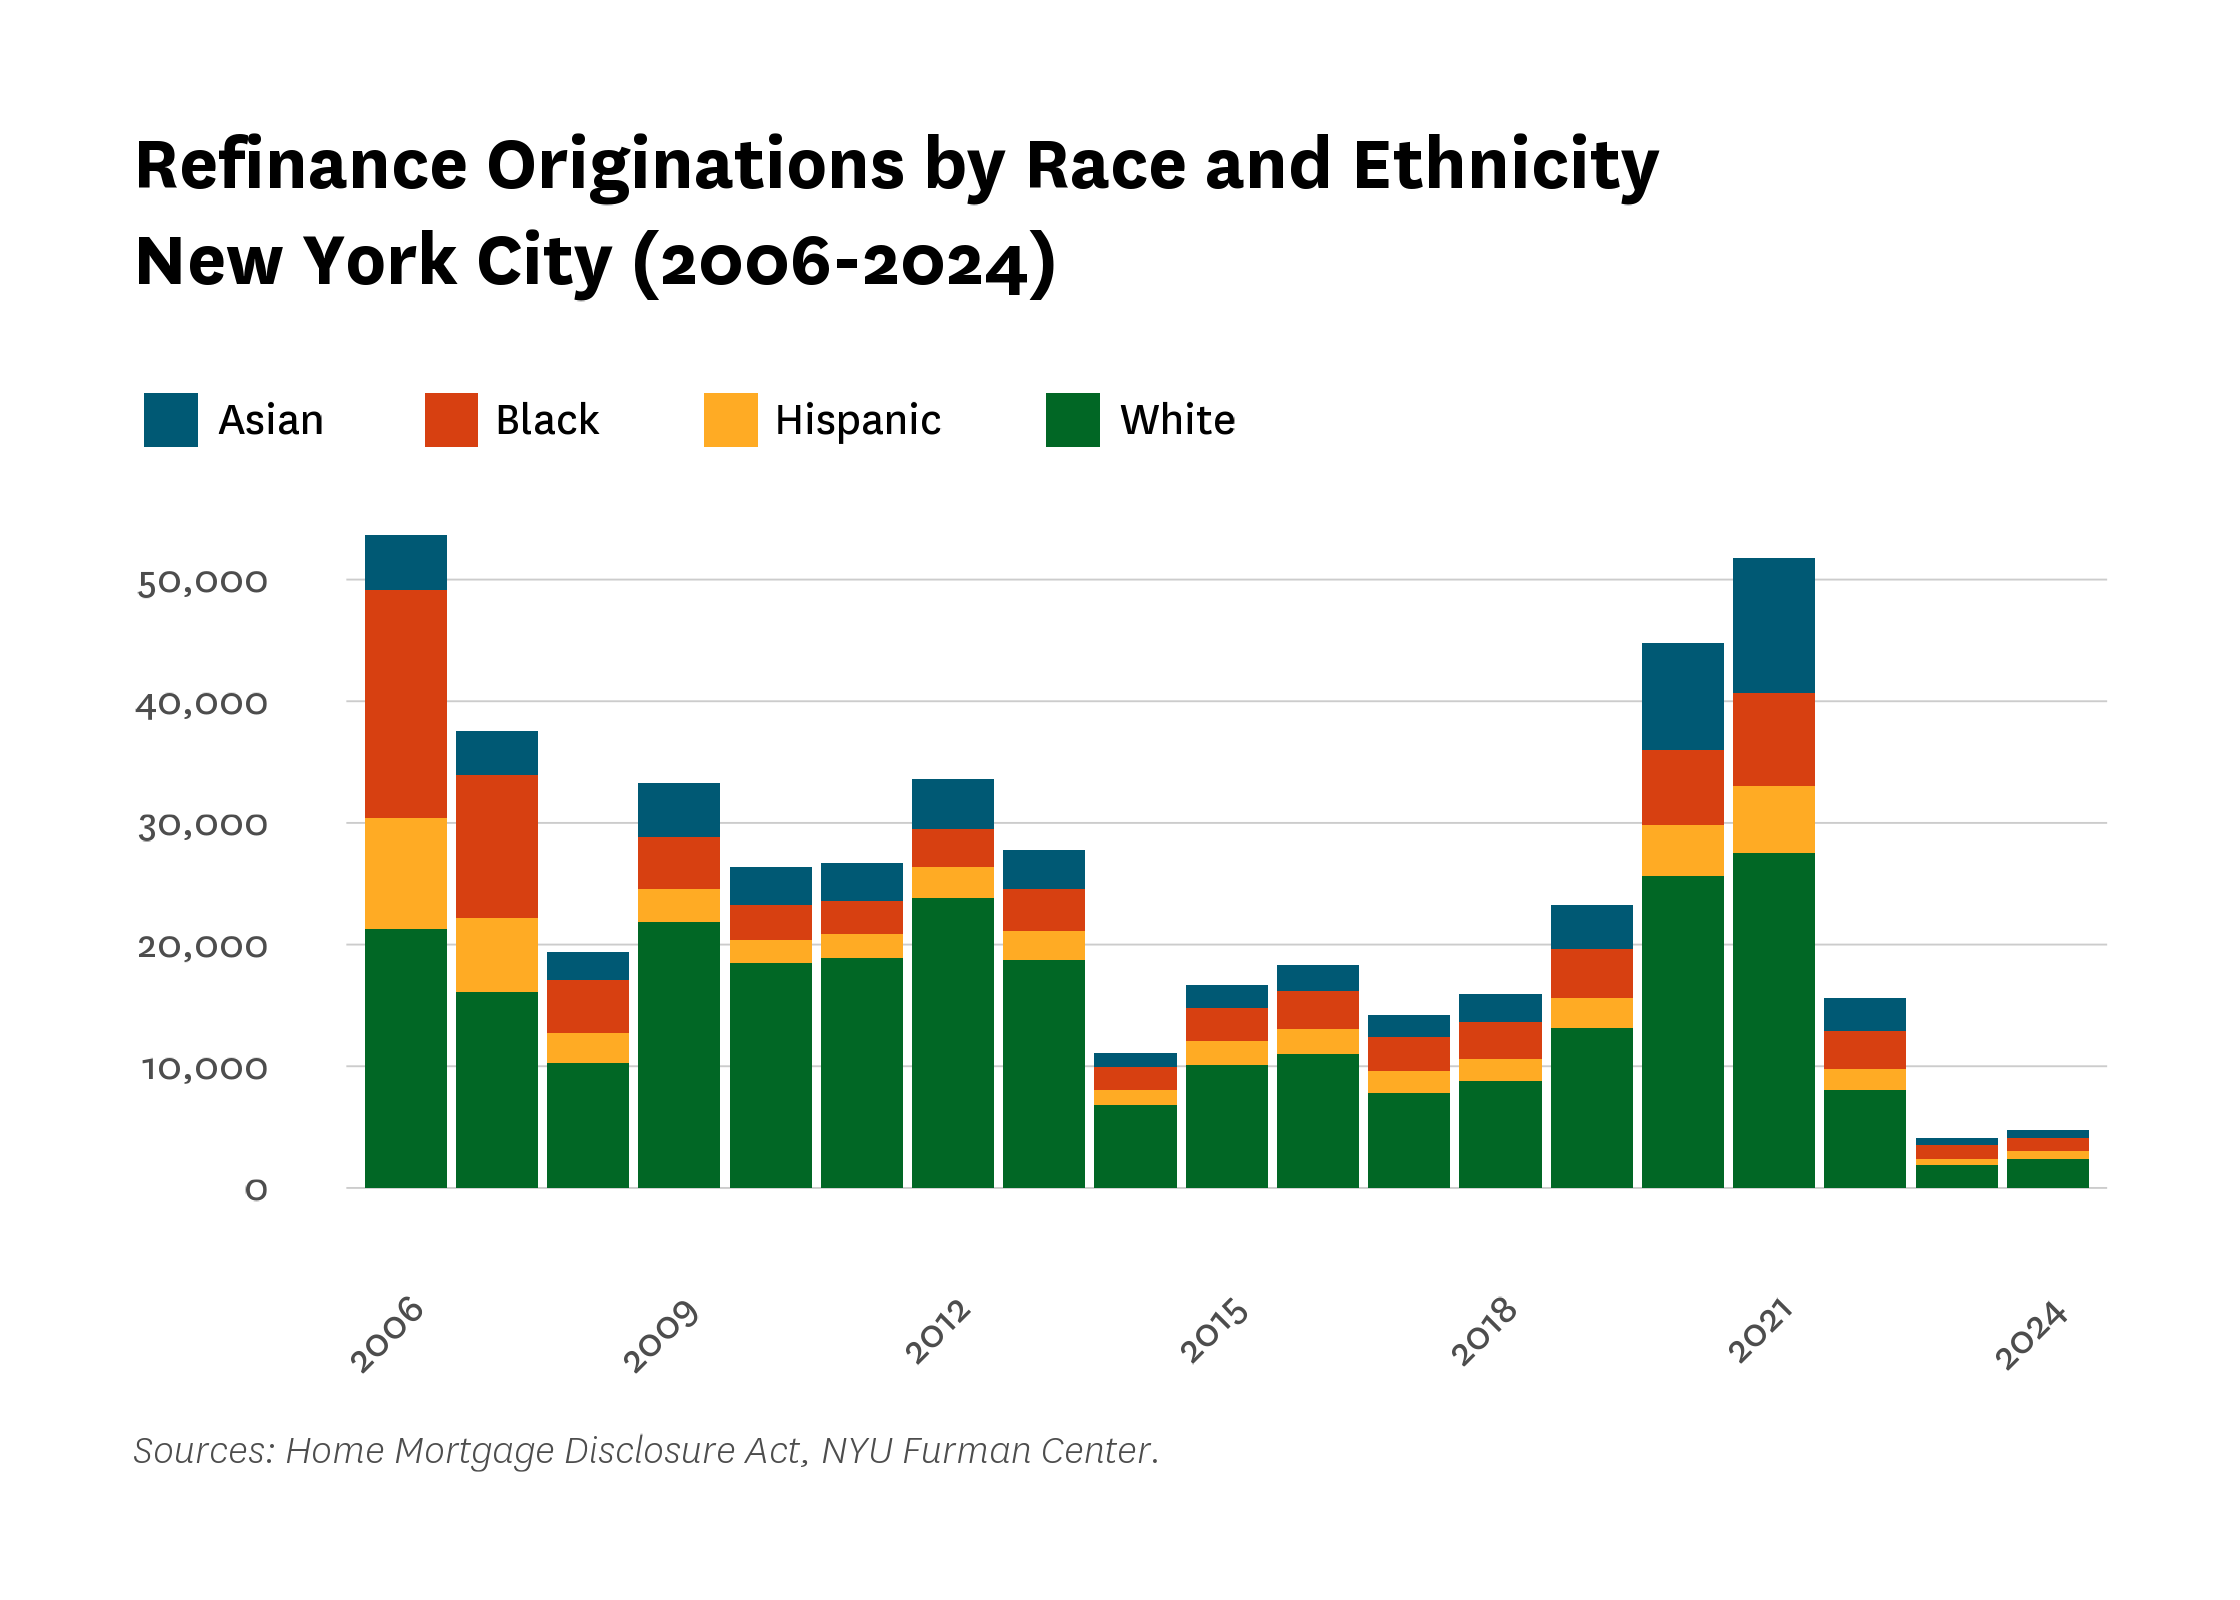
Refinancing activity followed similar patterns. Citywide, the number of refinance originations dropped from 15,794 in 2022 to 4,141 in 2023—a 73.8 percent decrease. In 2024, refinance originations rose to 4,806, with slight gains across all boroughs; Staten Island saw the largest increase (27.4 percent), while the Bronx had the smallest (8.4 percent) (Figure 5). As shown in Figure 6, the declines between 2022 and 2023 were broad-based across racial and ethnic groups, with Asian and white borrowers experiencing the largest percentage drops (80.2 and 76.4 percent, respectively), while Hispanic and Black borrowers saw somewhat smaller but still substantial decreases (72.3 and 62.8 percent). In 2024, most groups saw partial rebounds, though Black borrowers were an exception, experiencing a further decline of 7.3 percent.
Figure 5:
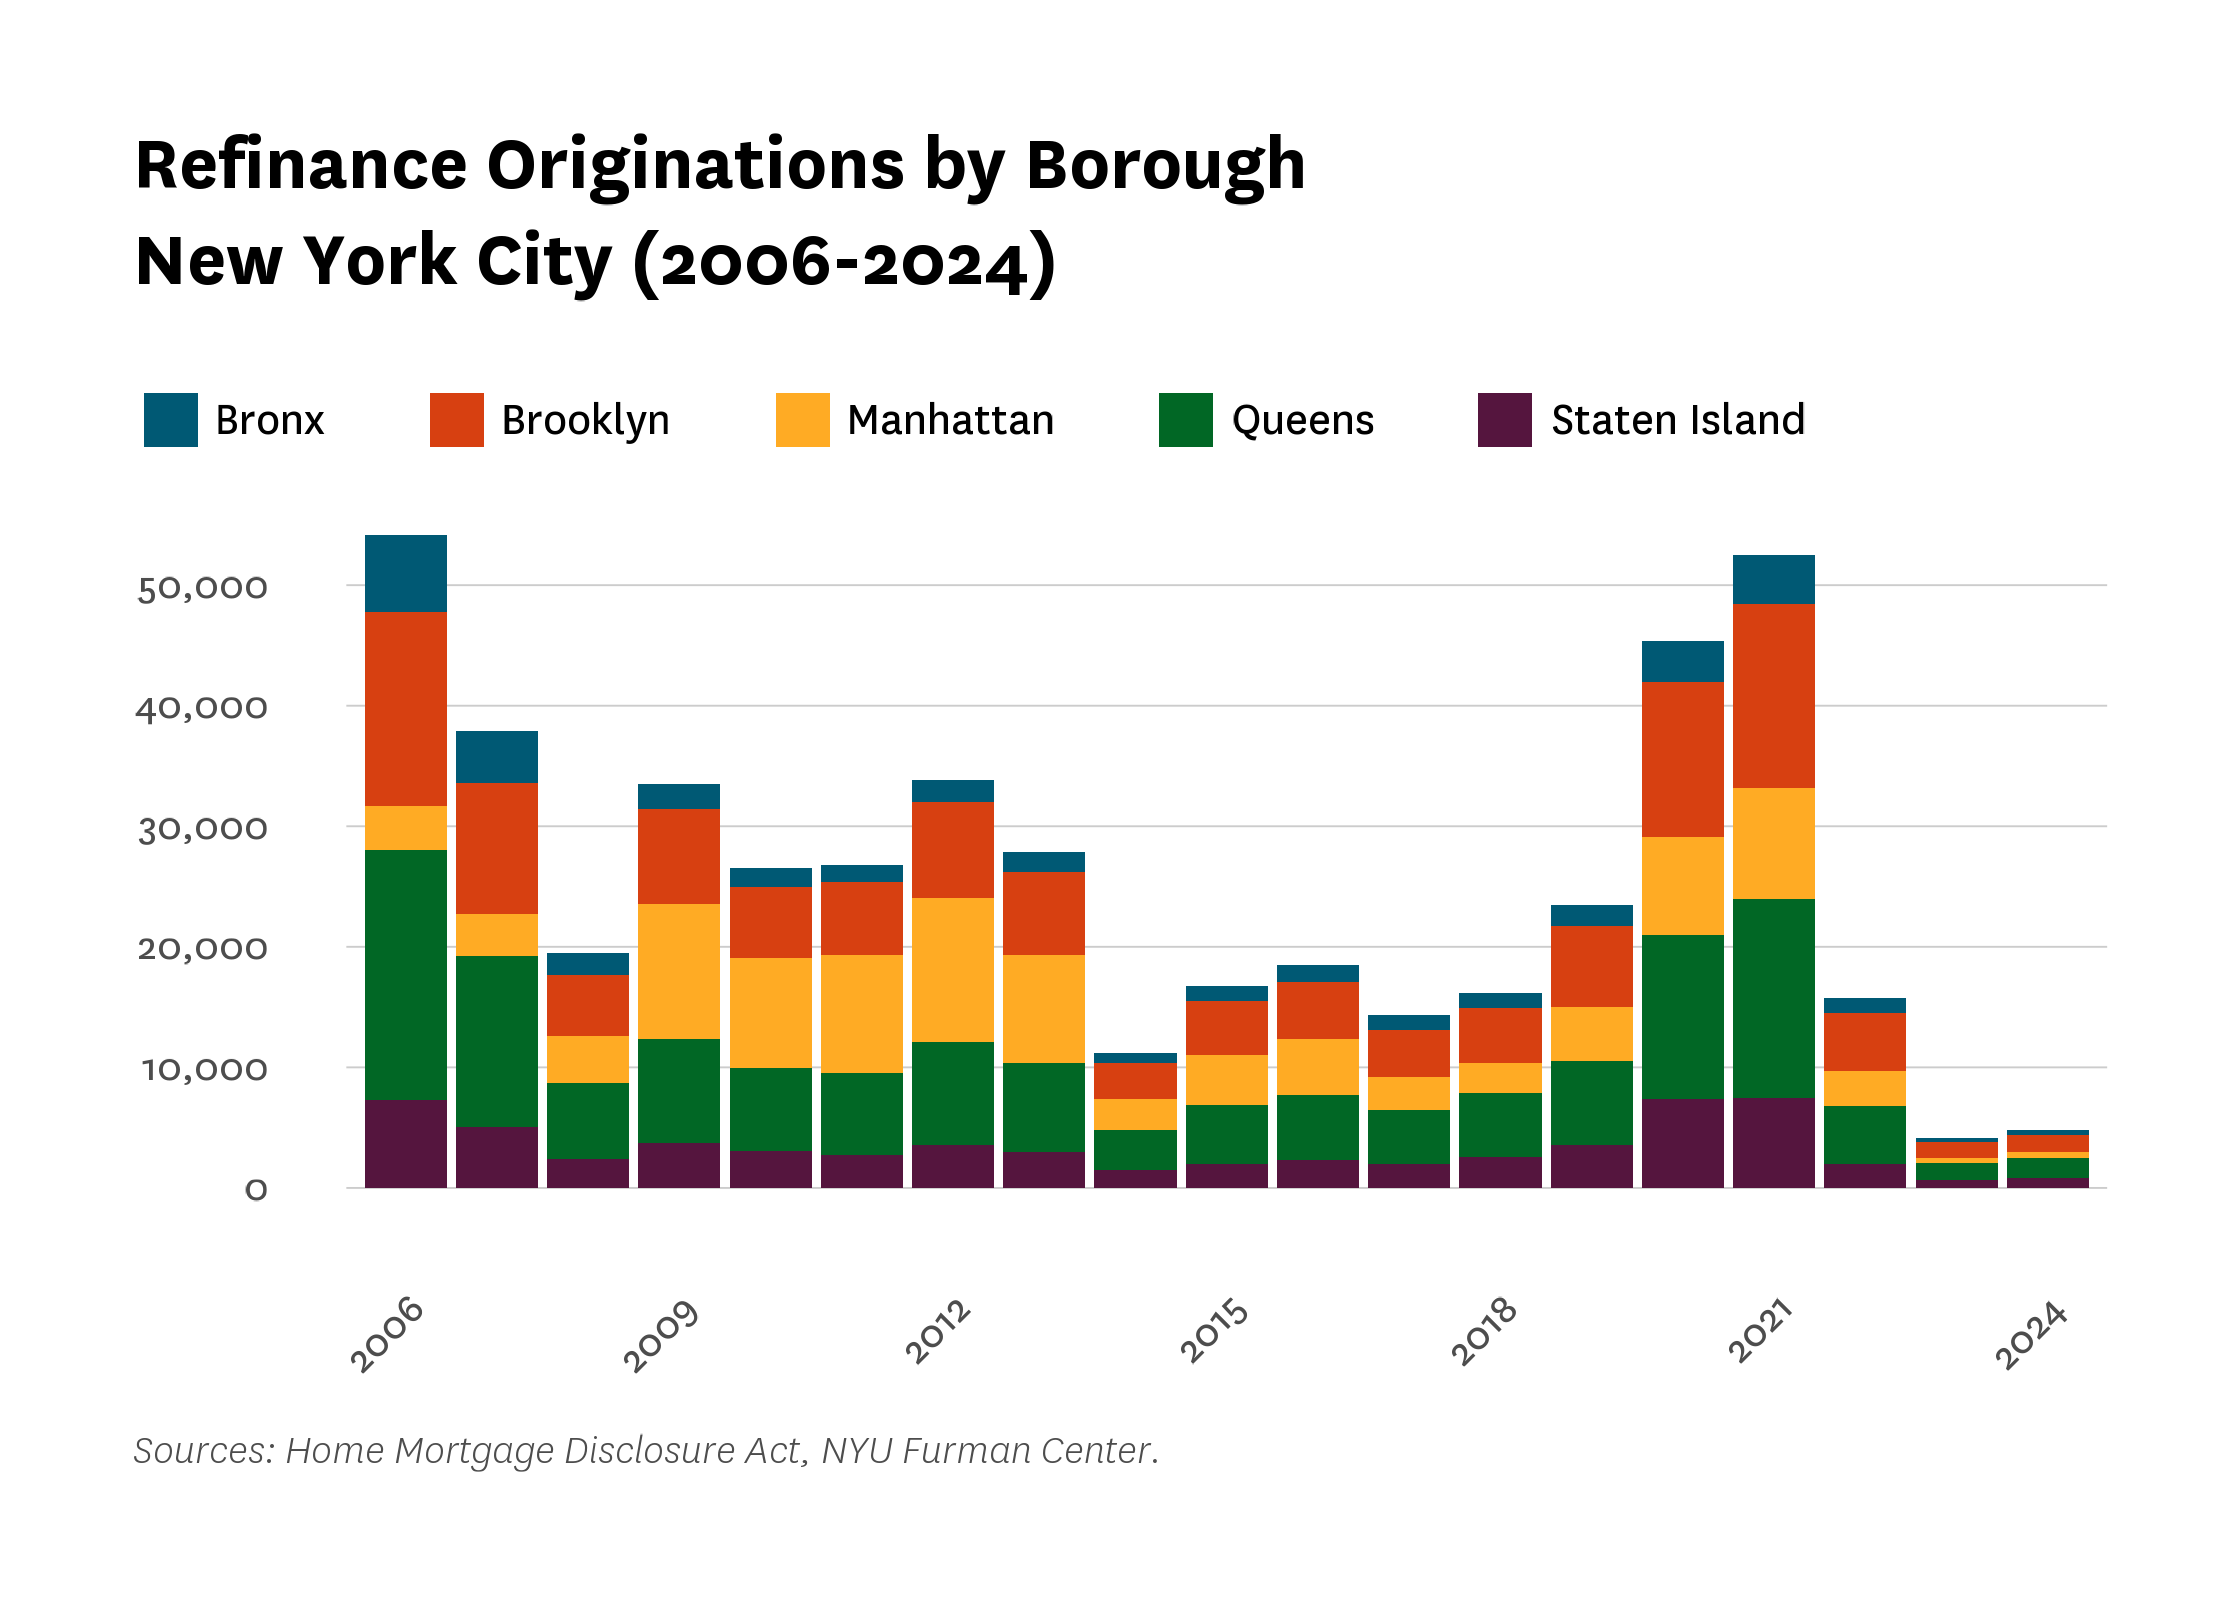
Figure 6:
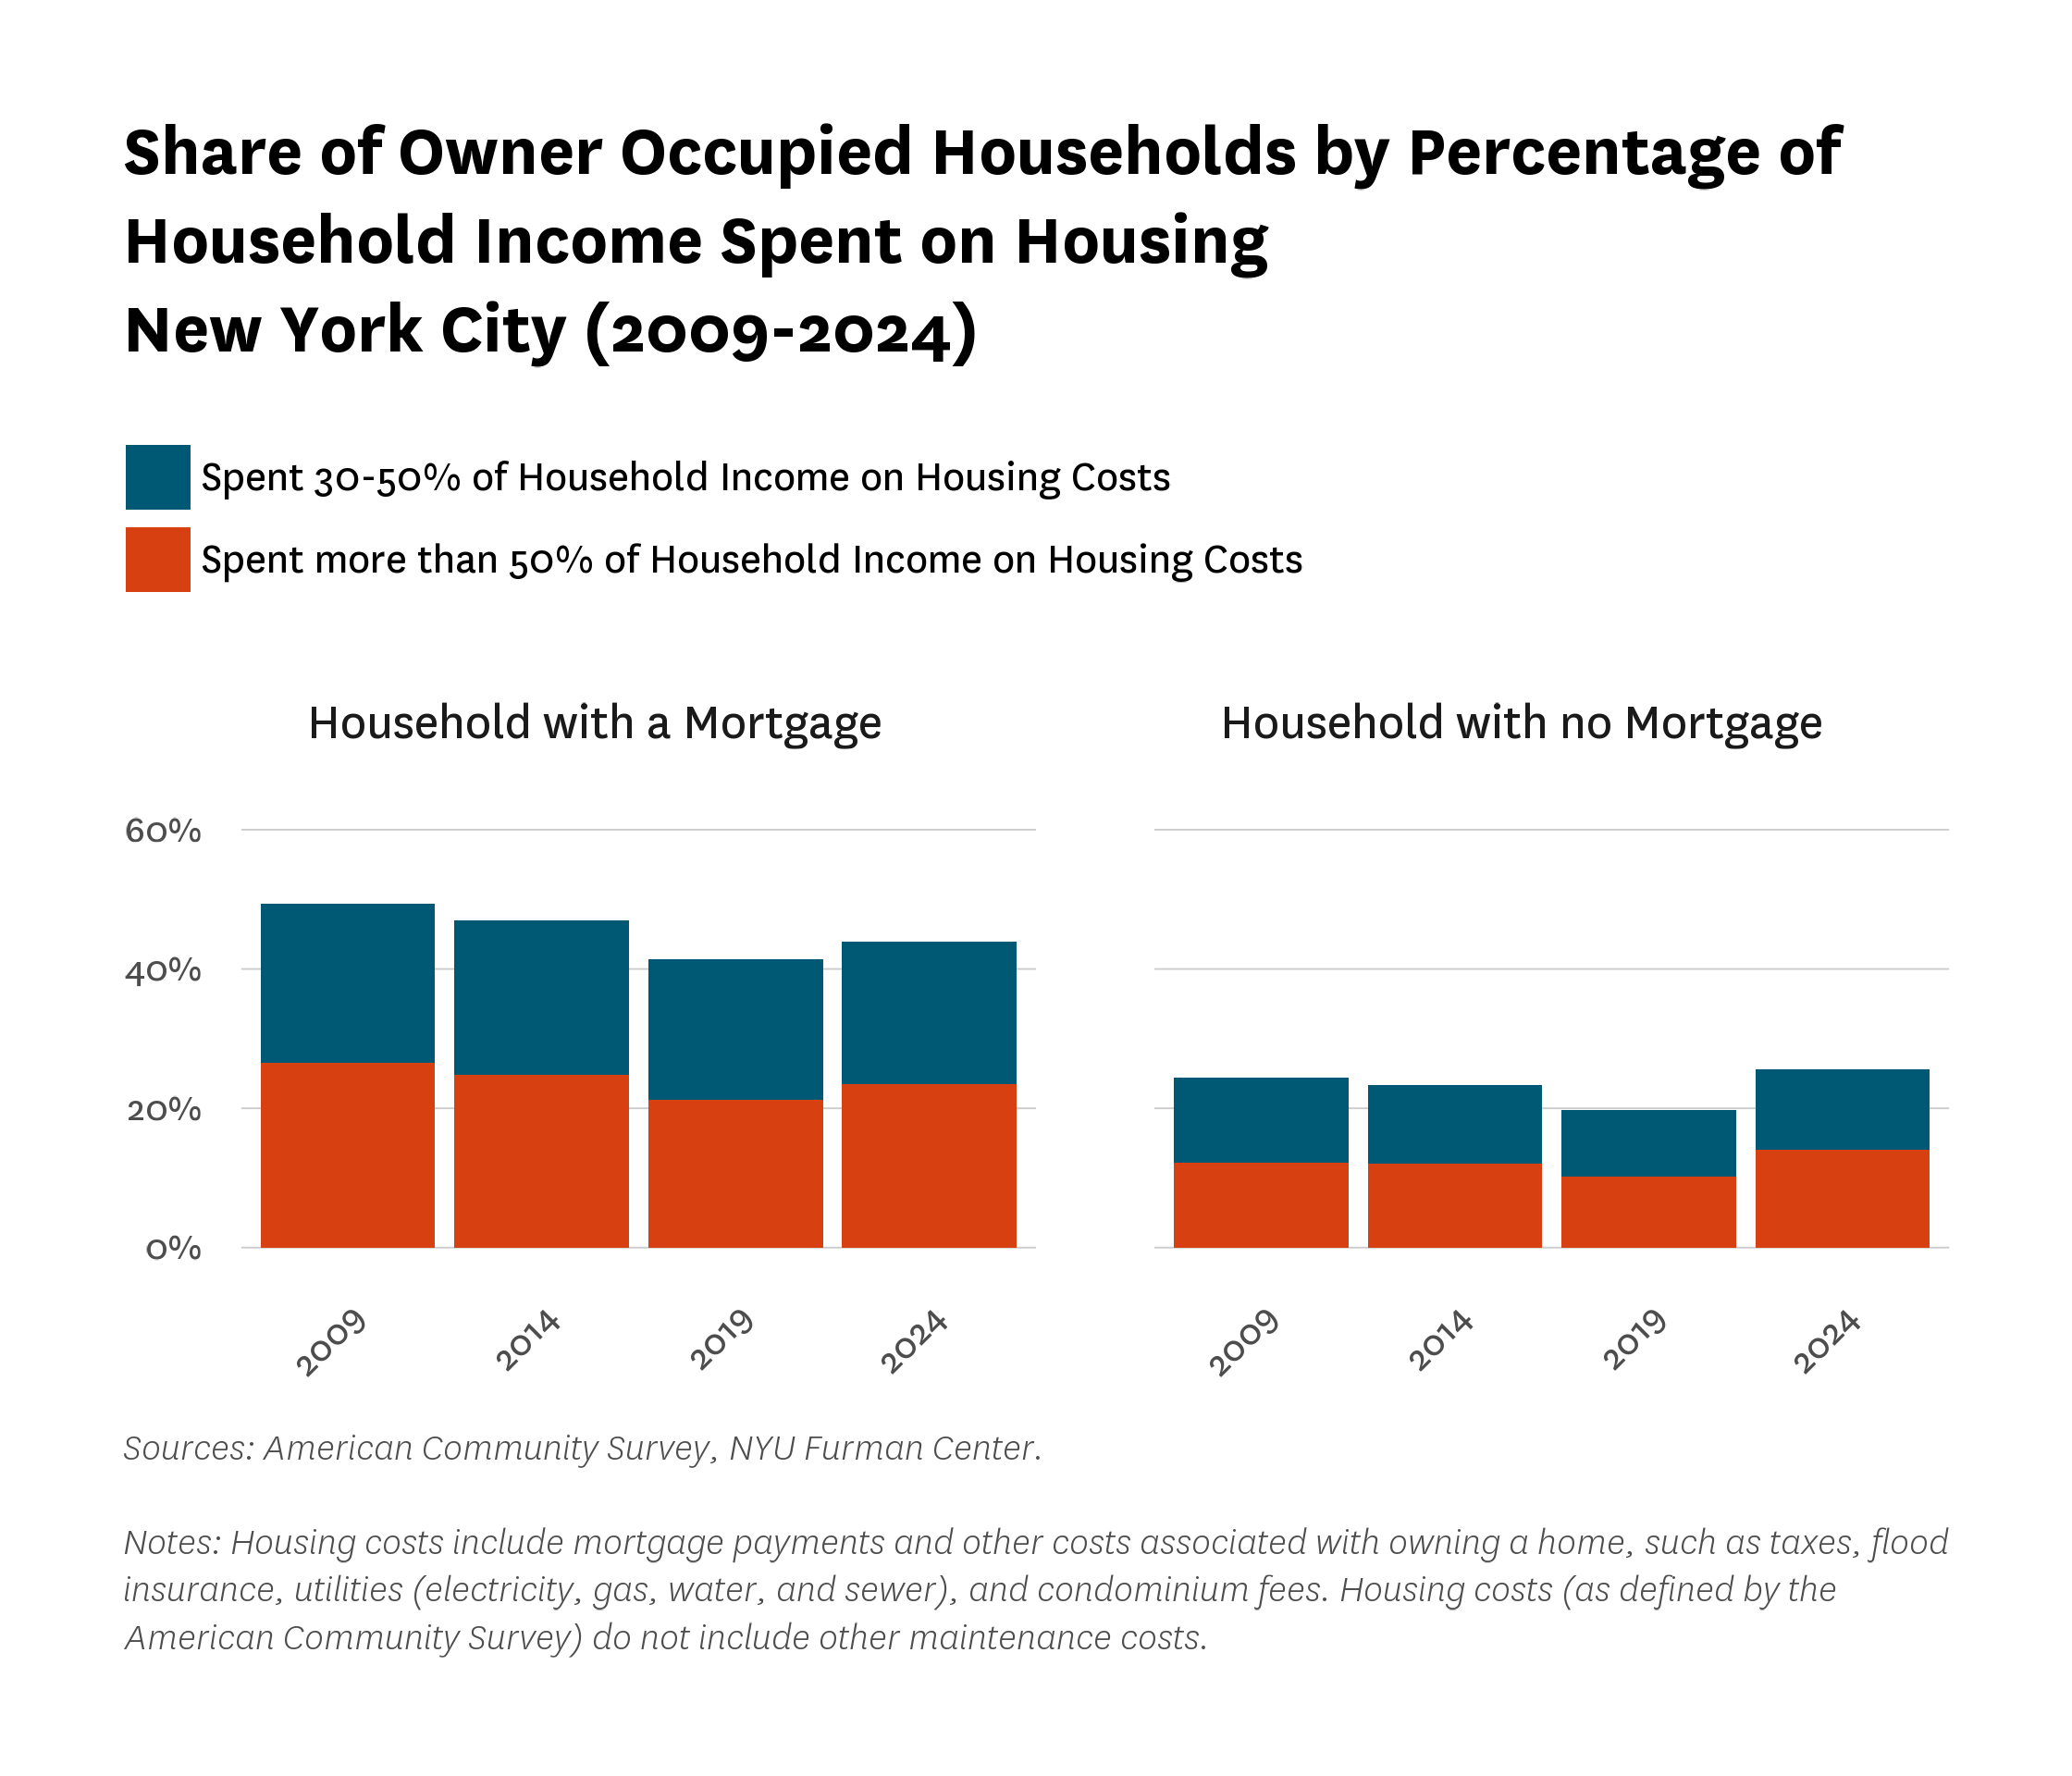
Recent data show that affordability challenges have persisted for many owners, particularly those with outstanding mortgages. As illustrated in Figure 7, the share of mortgage-holders spending more than half of their income on housing declined from 26.5 percent in 2009 to 21.2 percent in 2019, then rose to 23.4 percent by 2024. Owners without a mortgage continued to face lower rates of severe cost burden, though their rates also rose—from 10.2 percent in 2019 to 14.0 percent in 2024, the highest level in the period tracked. The severe burden rate for owners without a mortgage remained 9.4 percentage points lower than for those with a mortgage.
Figure 7:
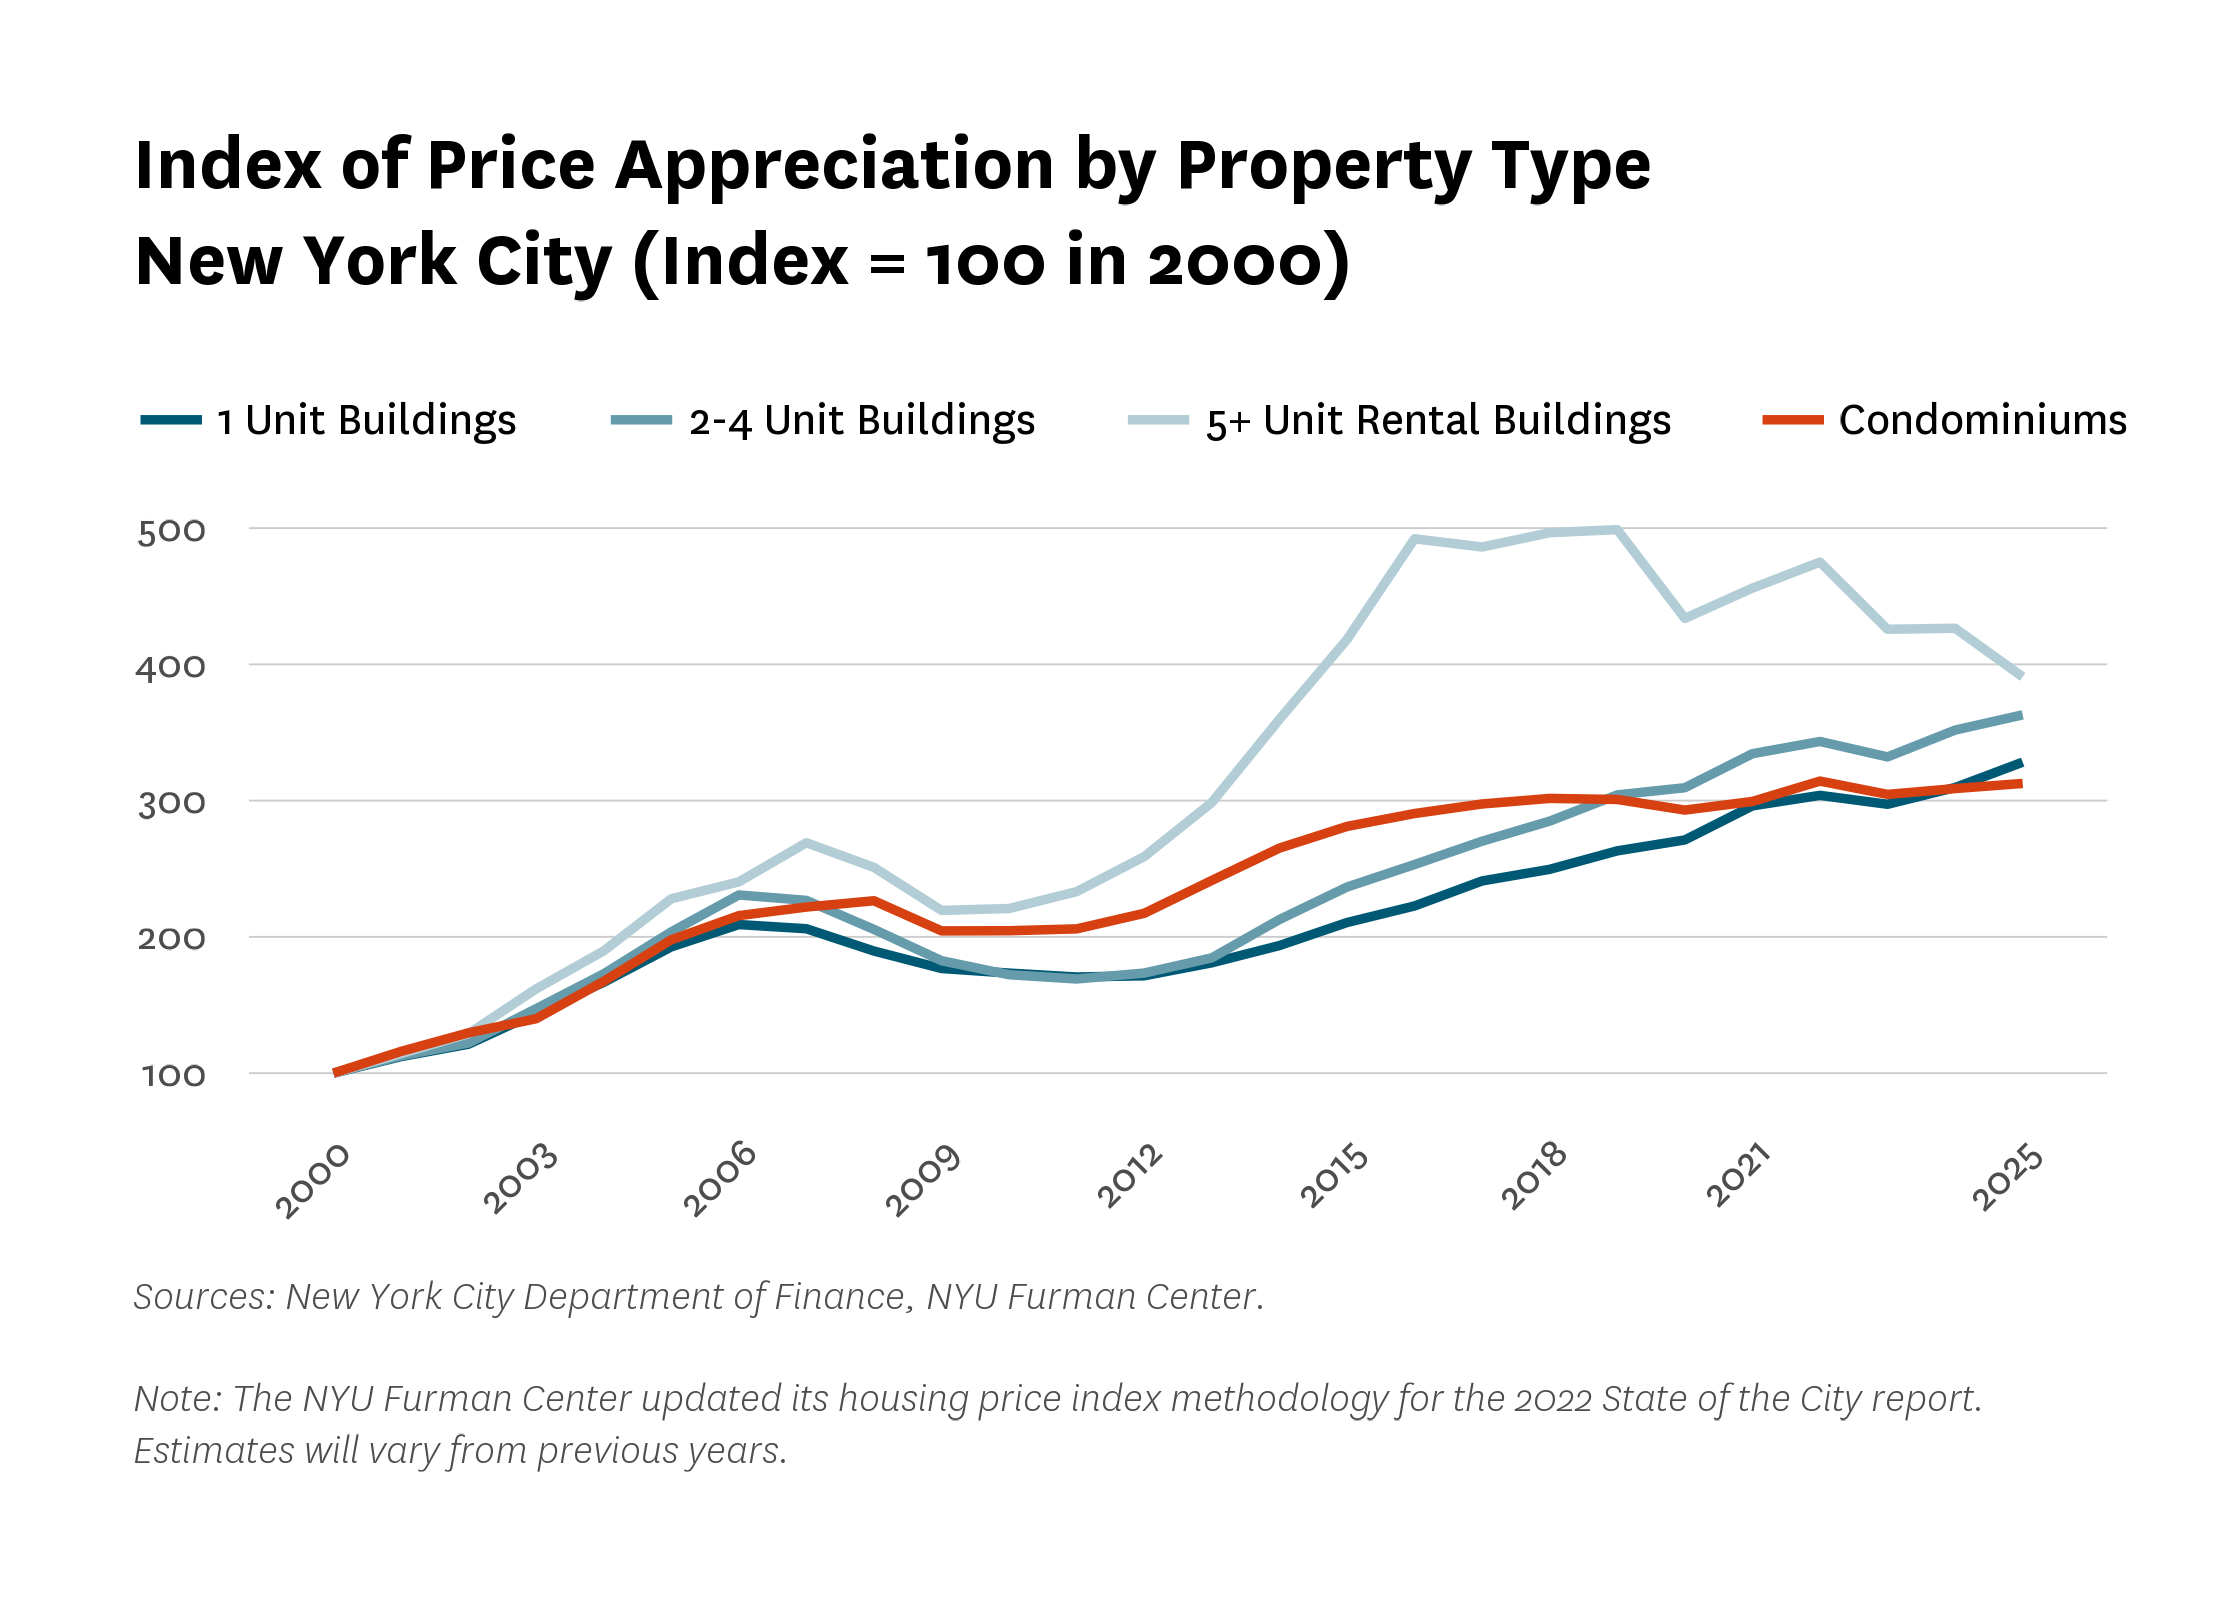
Residential property values continued to rise in most parts of the city. As shown in Figure 8, values increased across most boroughs in 2025, though Manhattan saw a marginal decline, with the largest percentage point gains recorded in Brooklyn (15.7 points), Staten Island (13.3 points), and Queens (13.0 points). Figure 9 highlights differences by property type: single-family homes and 2-to-four unit properties saw strong price appreciation (18.6 and 11.2 percentage points, respectively), condominiums edged up in value (3.8 points). Larger rental buildings declined sharply—down 35.7 points and sales prices for that property type were at their lowest value since 2014. The prevalence of large rental buildings in Manhattan may be contributing to the borough’s decline in overall price appreciation. Since 2000, values for single family homes, two-to-four-unit buildings, and condominiums have more than tripled, while buildings with five or more units have almost quadrupled.
Figure 8:
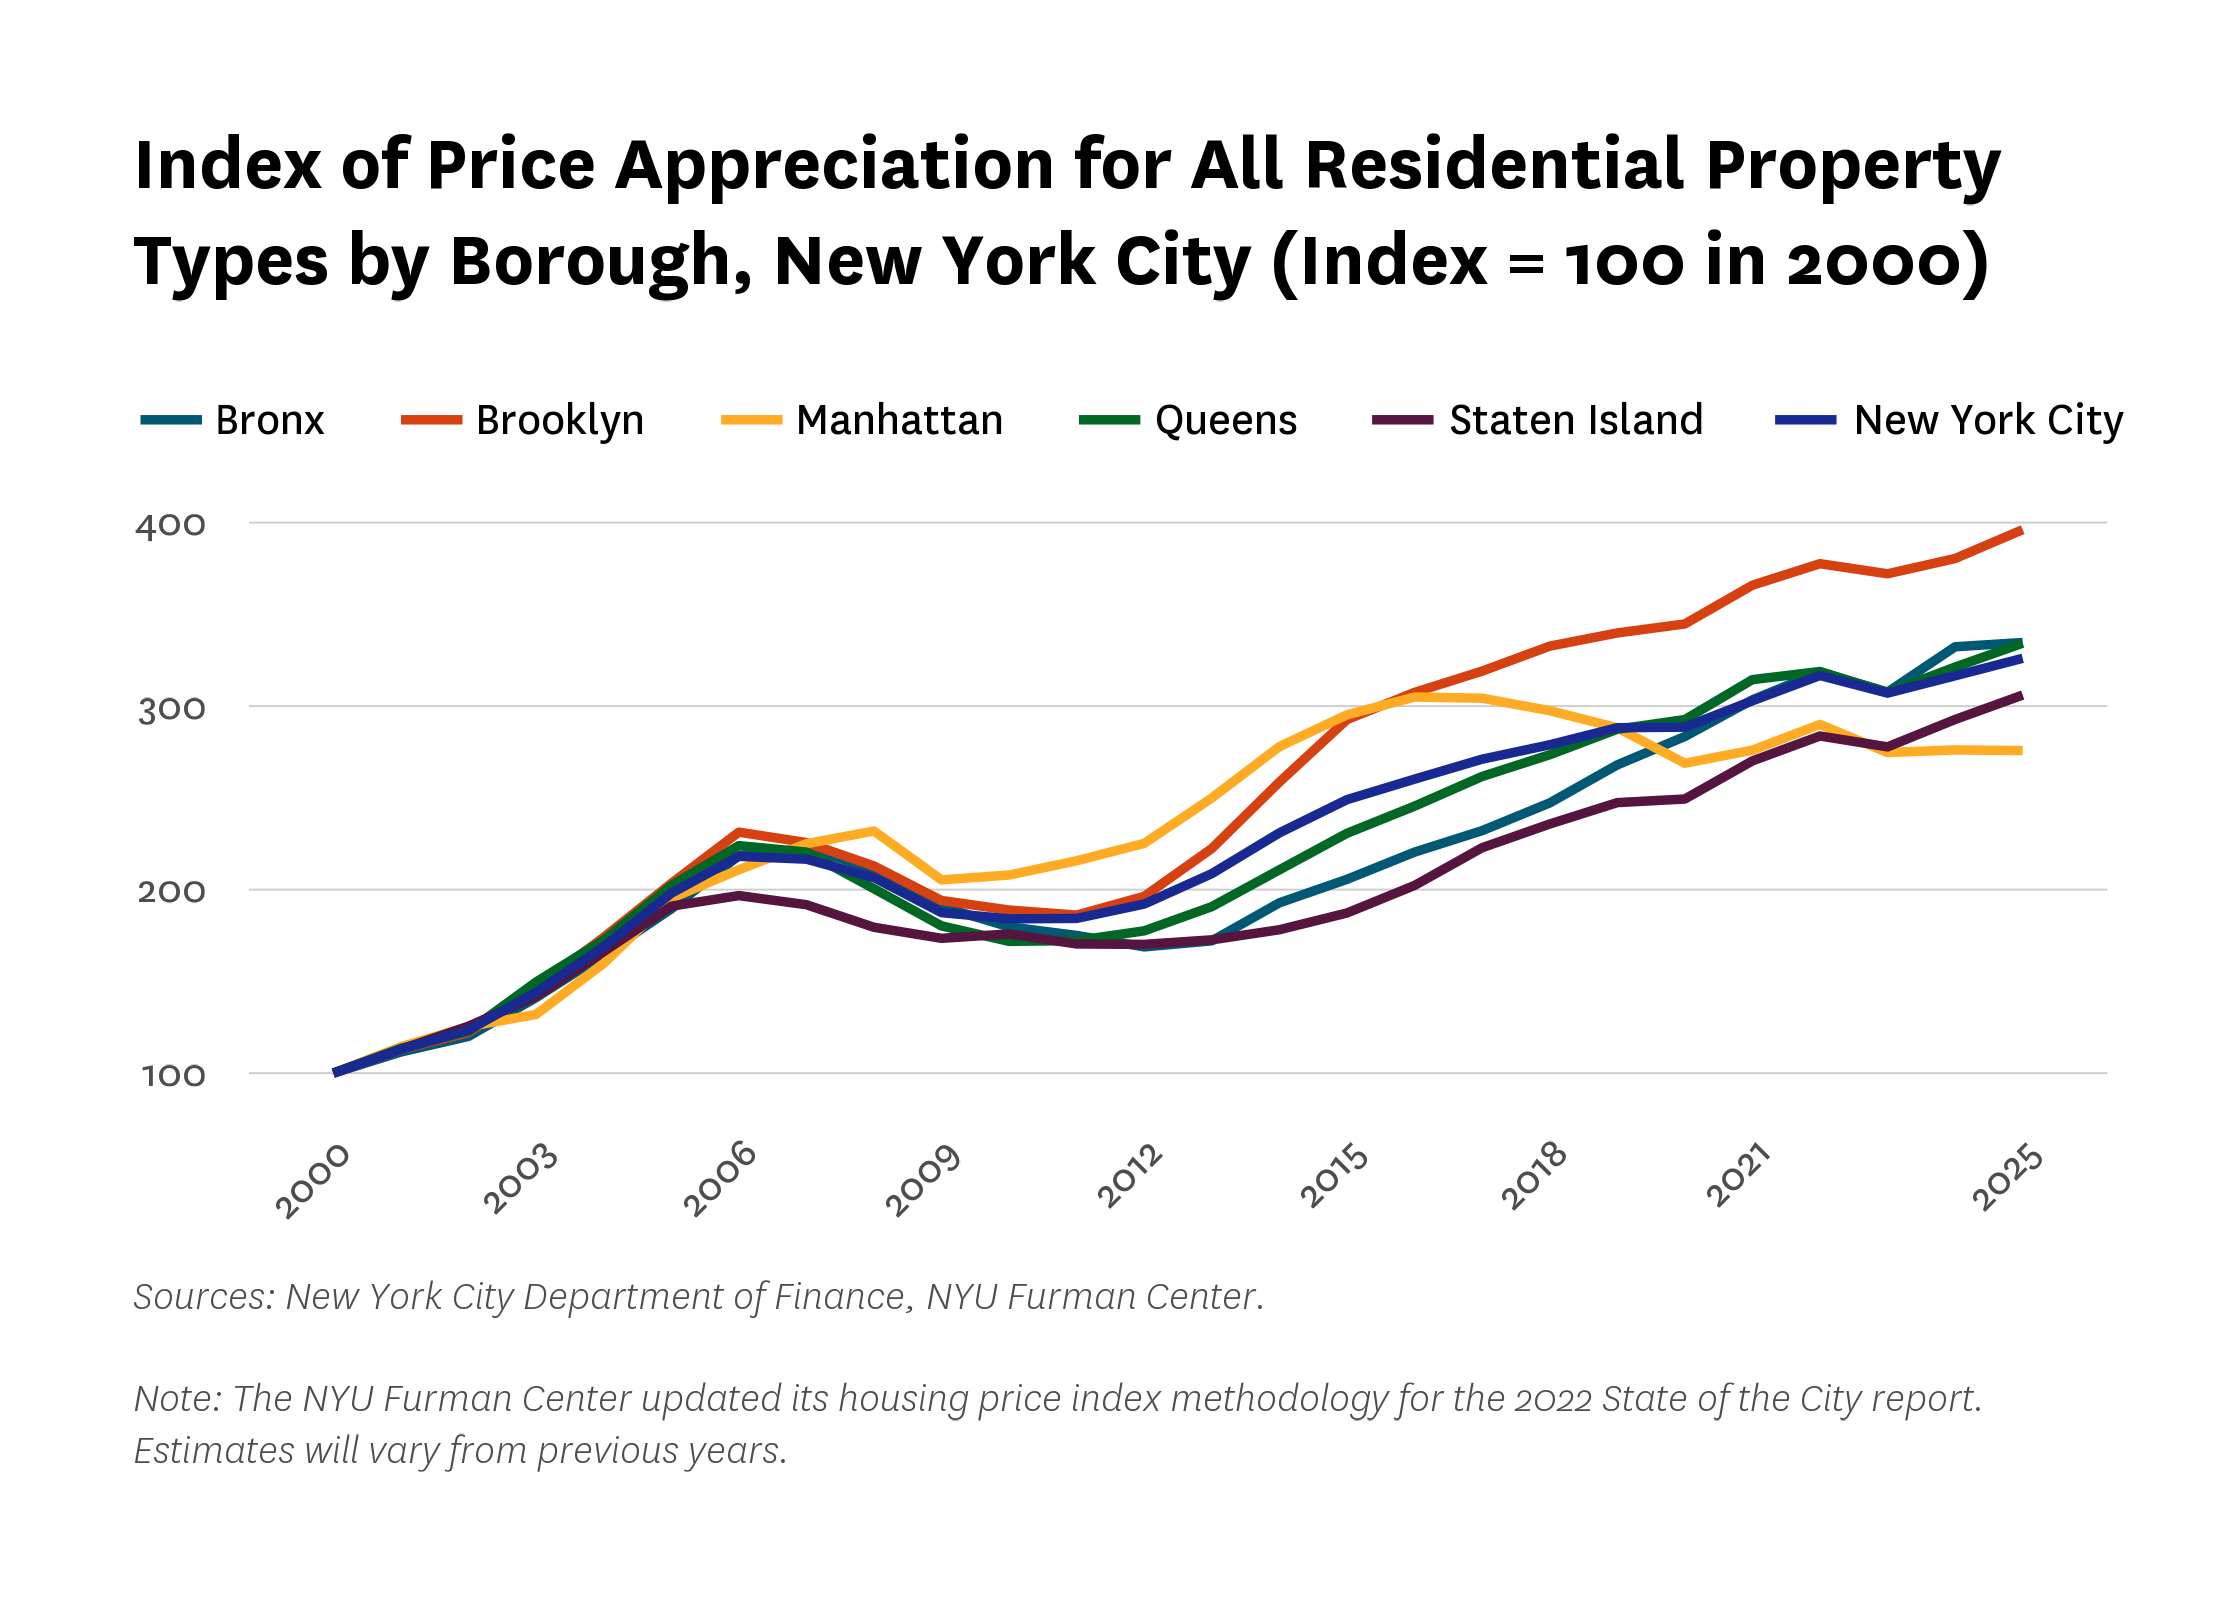
Figure 9:
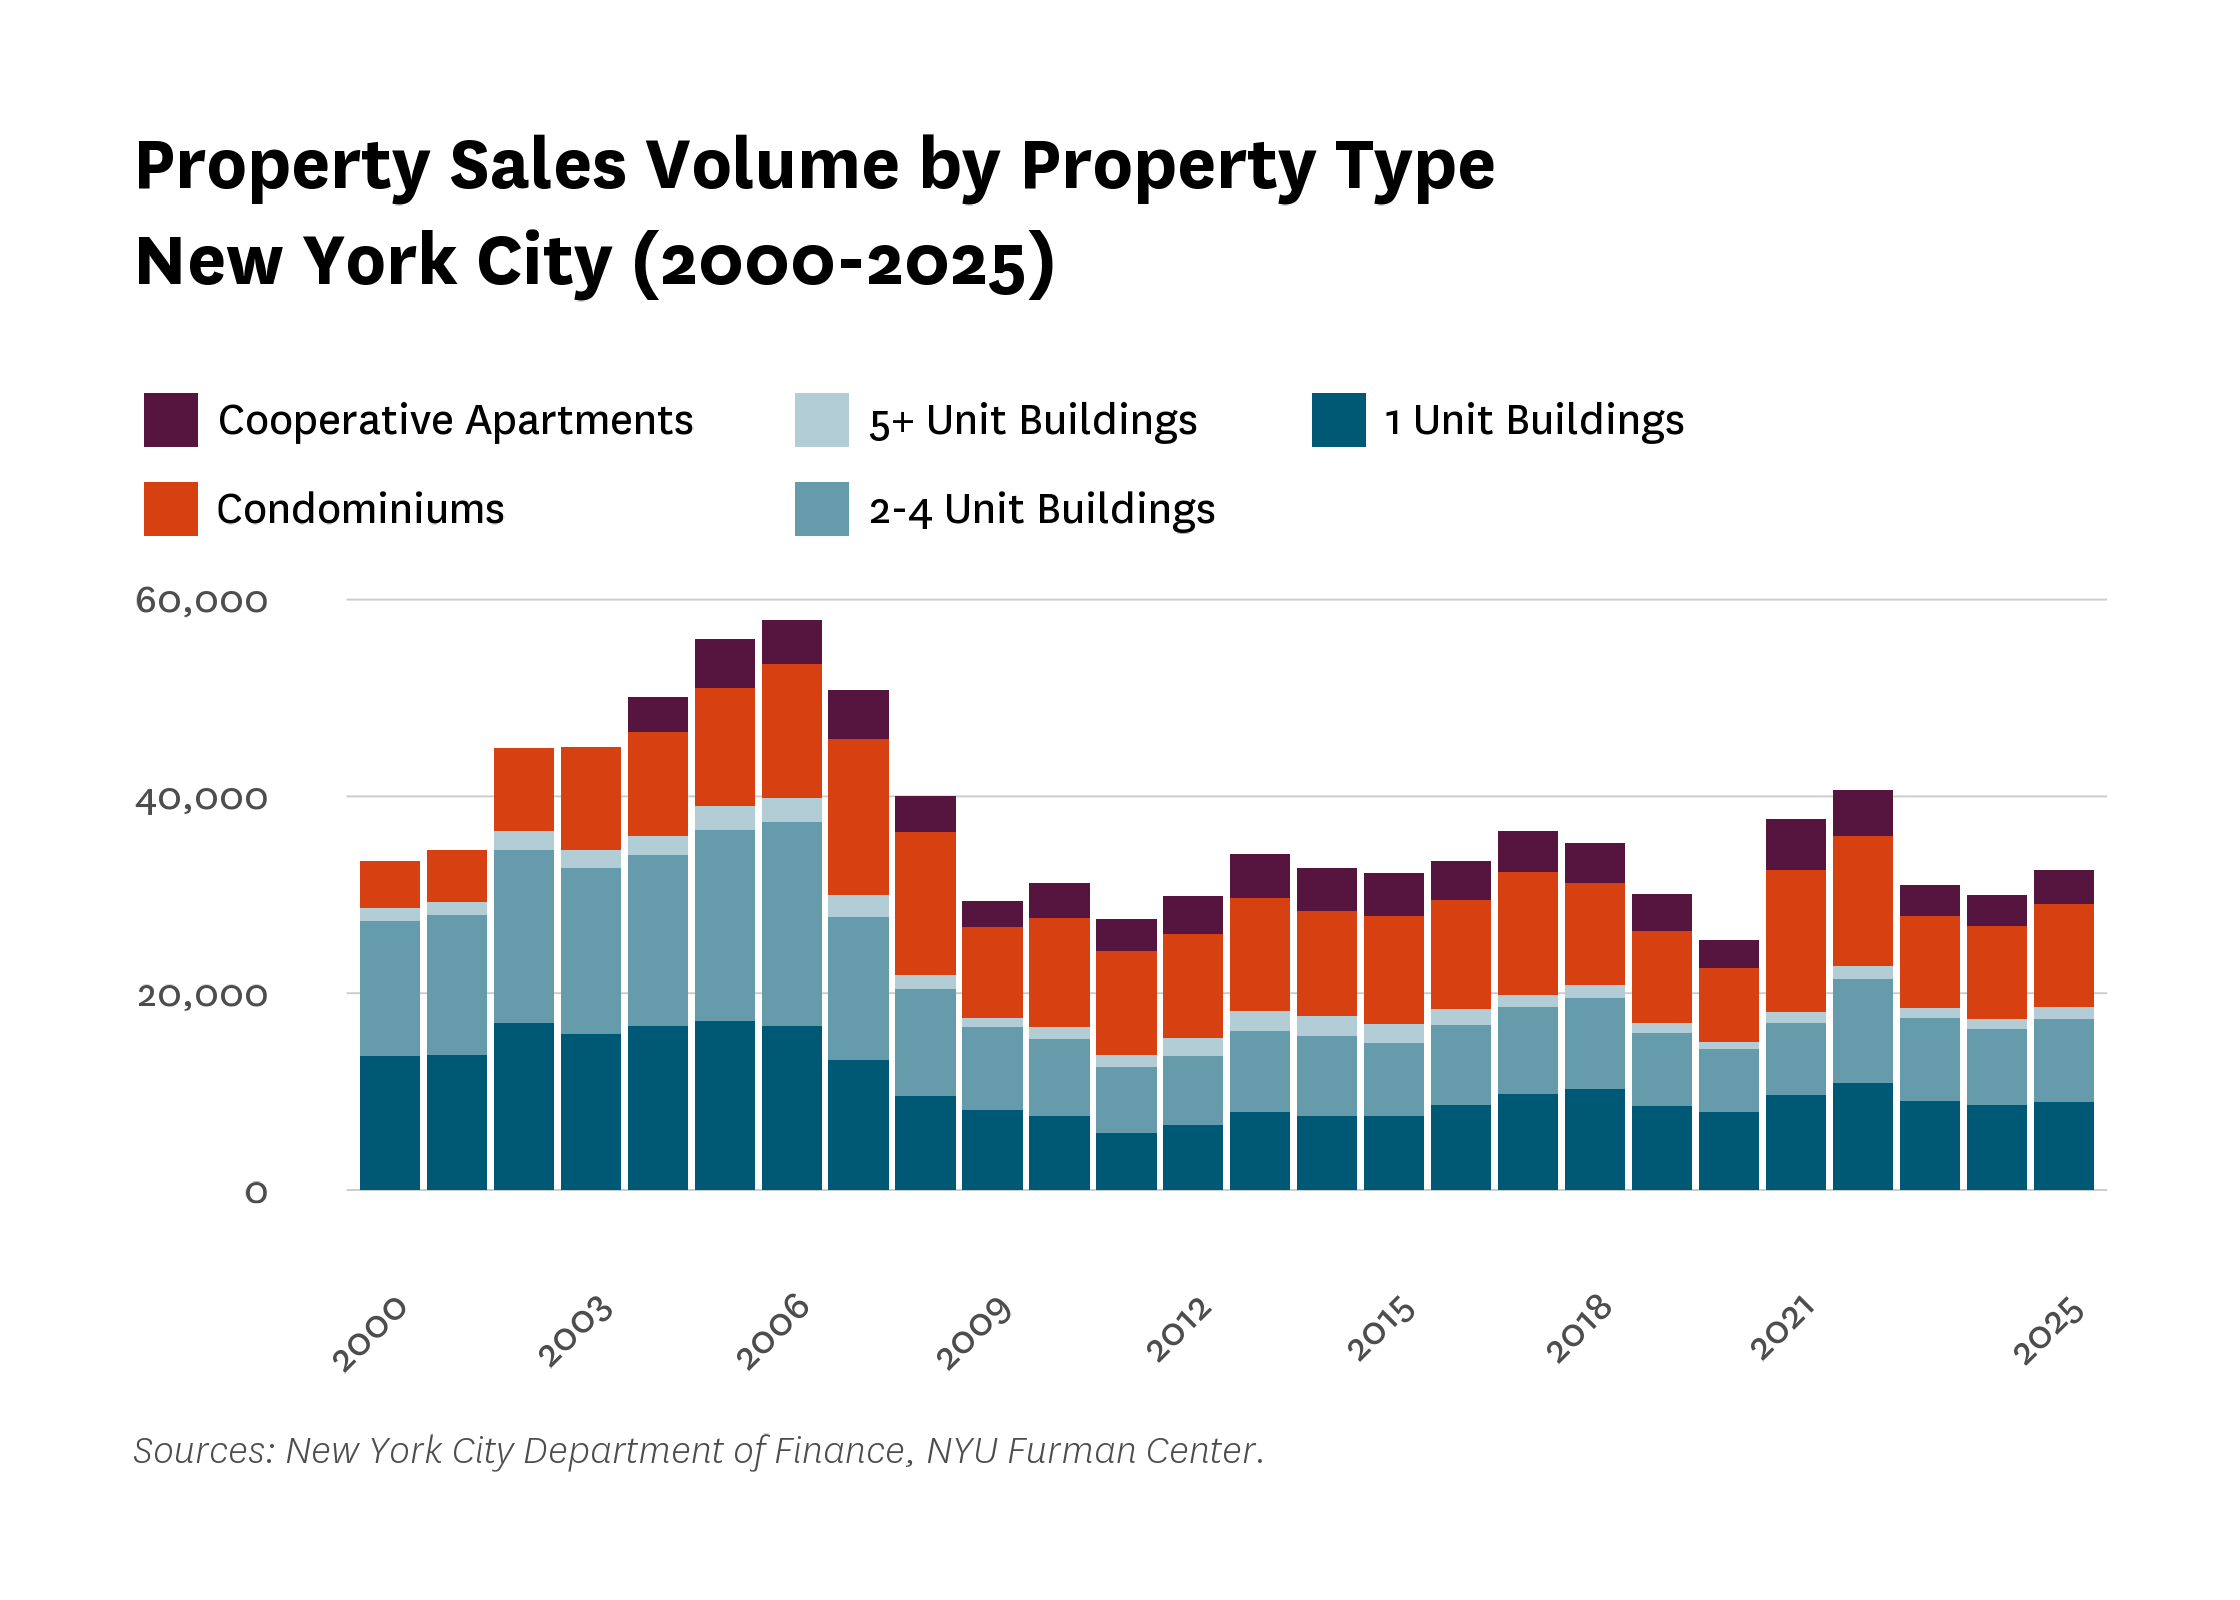
Property sales volume rebounded in 2025, rising 8.3 percent citywide to 29,100 transactions (Figure 10). Gains were spread across boroughs, with Manhattan (14.5 percent increase) and Queens (12.0 percent increase) leading the recovery, though Staten Island defied the trend with a 6.2 percent decline. Across property types, all categories posted gains in 2025, with five-or-more-unit buildings seeing the largest increase (19.6 percent), followed by condominiums (10.3 percent) and two-to-four-unit buildings (9.9 percent) (Figure 11).
Figure 10:
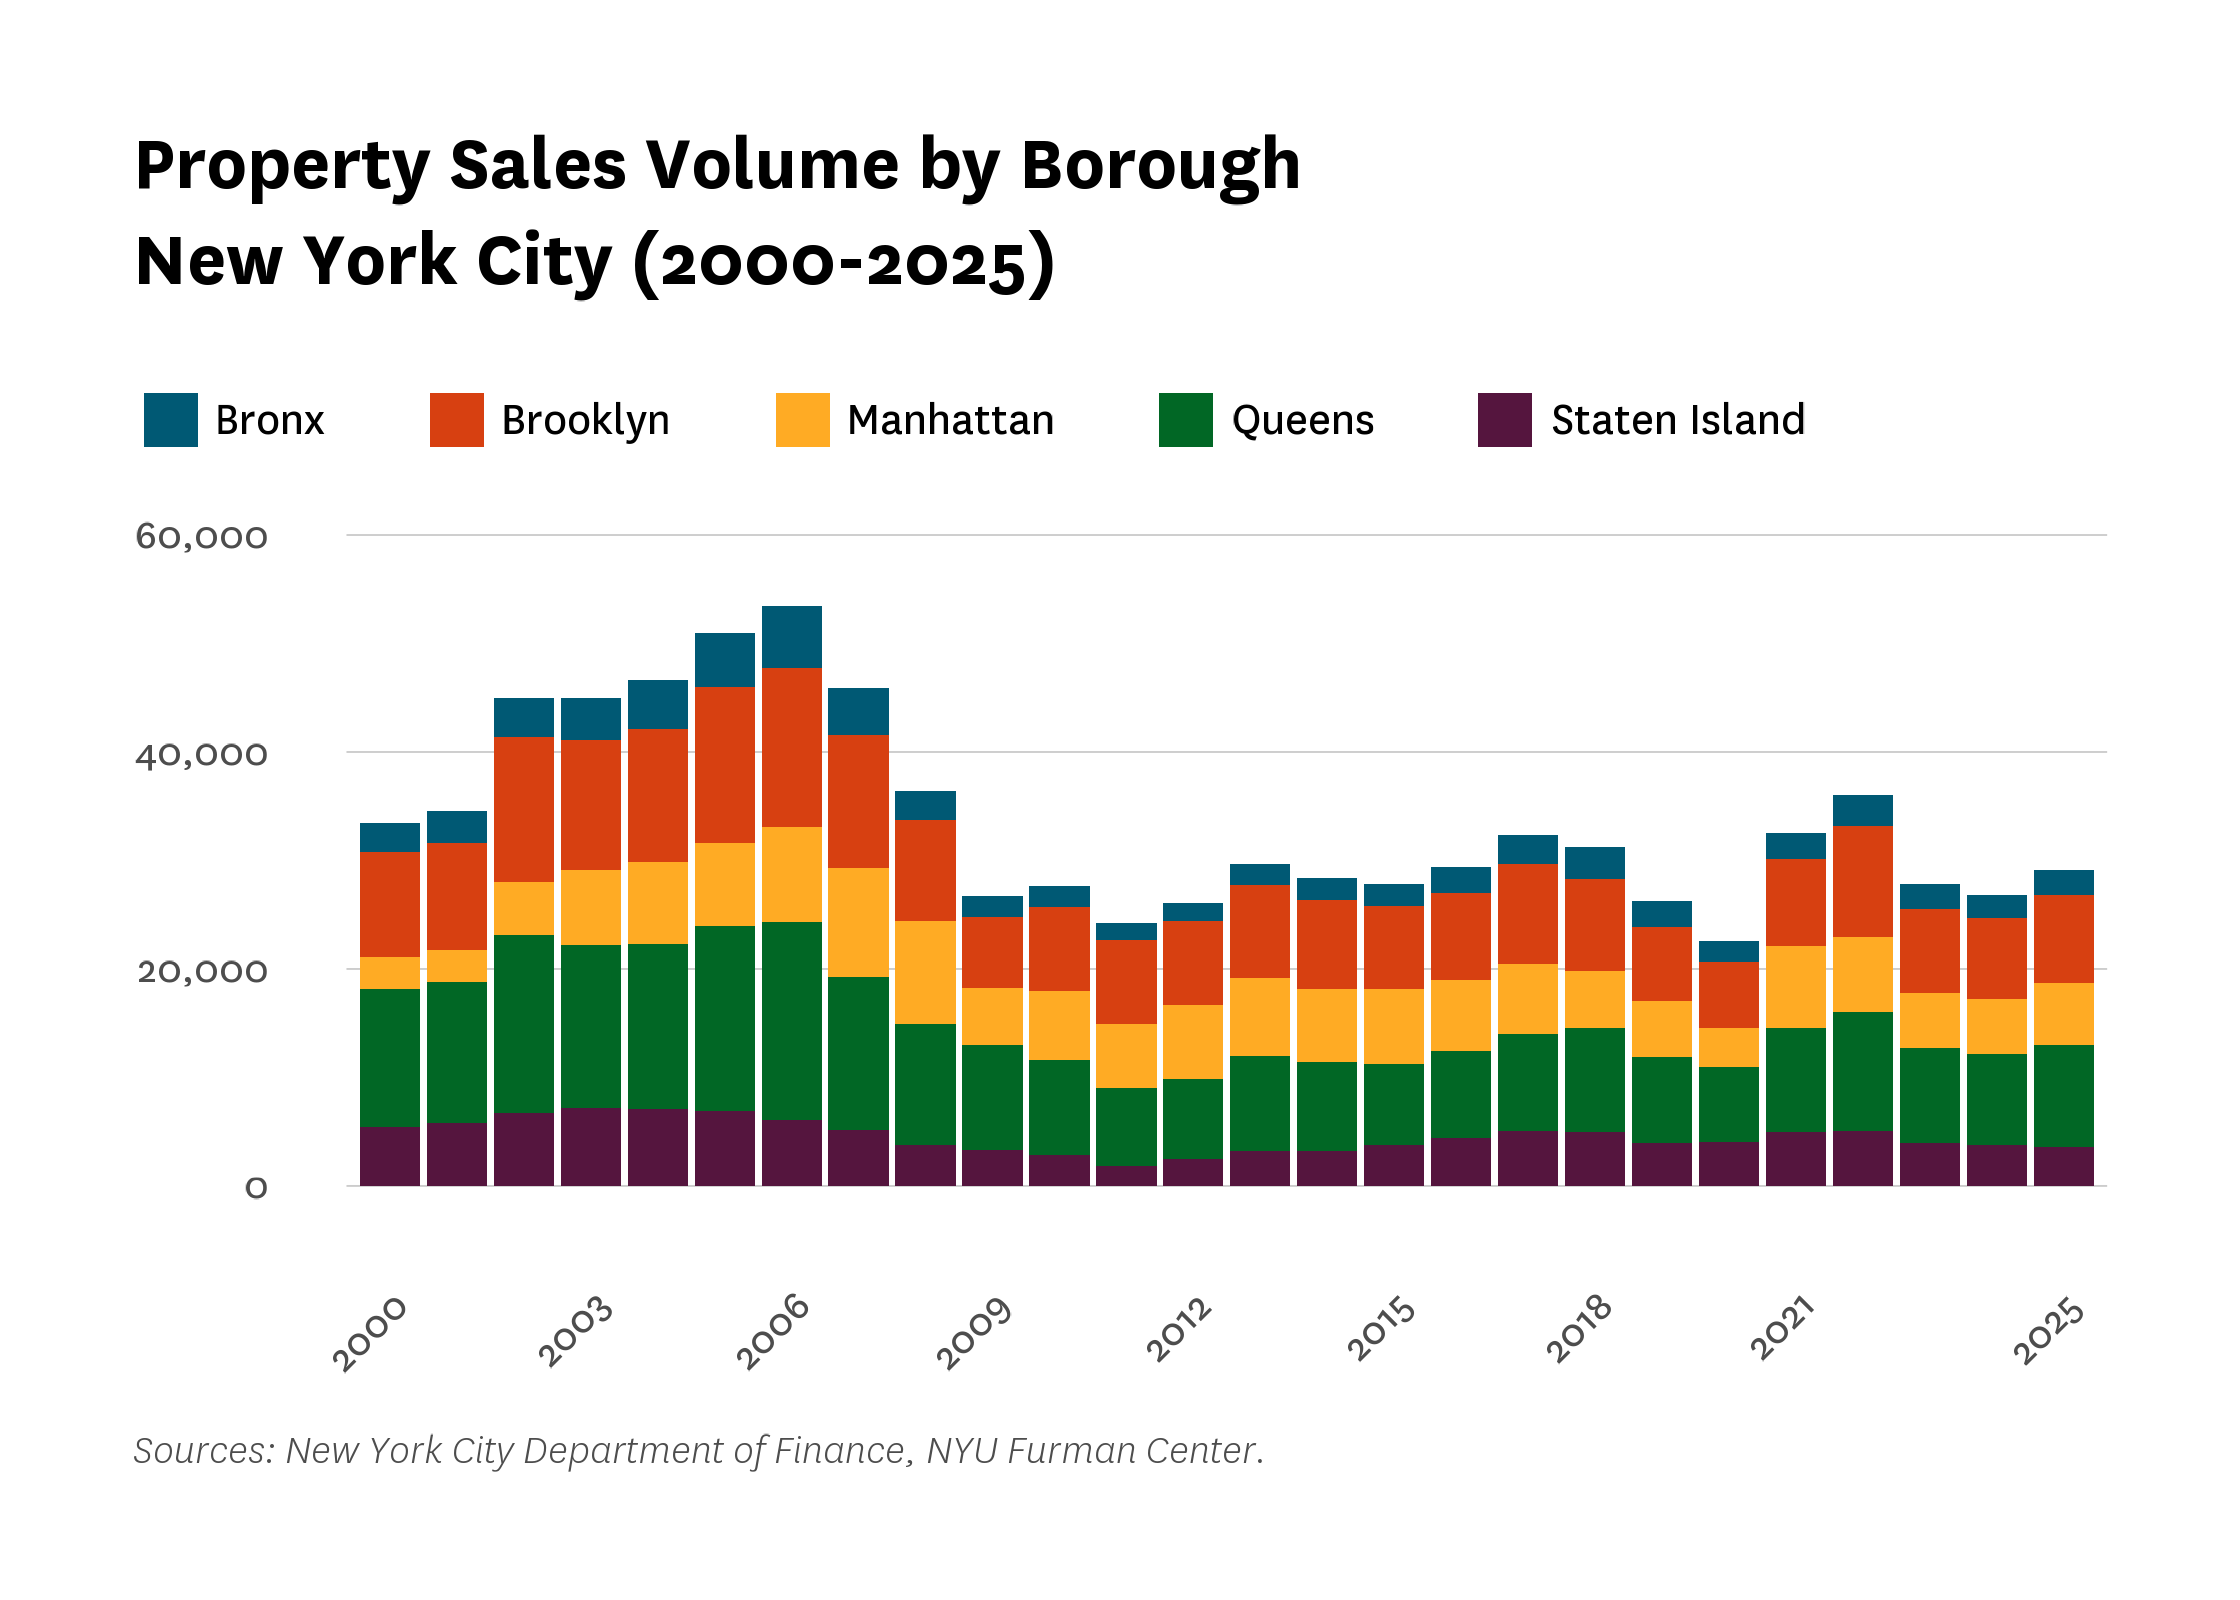
Figure 11:
Conclusion
NYC homeownership in 2025 was marked by an 8.3 percent rebound in the volume of property sales. However, any recovery was uneven: gains were concentrated in Manhattan and Queens, while Staten Island continued to decline and mortgage activity remained flat. In addition, almost a quarter of mortgage-holders remained severely cost-burdened. Although property values rose generally, Manhattan lagged and large rental buildings saw sharp declines in price. Furthermore, racial disparities persisted, with Black and Hispanic households remaining underrepresented among owners and borrowers. While rising sales and values may inspire cautious optimism about the state of the market, tight inventory and elevated interest rates continue to limit access for many New Yorkers.