
NYC's Property Tax System
I. Introduction
Property taxes are New York City’s largest source of local revenue and an important policy tool. However, many complain that the city’s property tax system is unnecessarily complex and inequitable in how it treats different types of property. A core issue is the system’s class share structure, which has allocated tax increases attributable to the increased value of one to three unit buildings to other types of properties, including utilities, commercial, and large multifamily rental properties. Additional features of the system, such as caps within the classes and differences in the methodology used to assess the value of different types of property, further weaken the connection between actual market value and tax liability and contribute to notable disparities in effective tax rates (ETR, or the tax levy divided by market value) across property types. These features produce comparatively high burdens on larger rental properties (with 11 or more units). Within that subcategory, the mass appraisal system also does not properly value properties where 90 percent or more of the units are rent-stabilized.
For rental buildings, property taxes are an important operating expense, paid out of rental income alongside other operating expenses like labor, maintenance, insurance, utilities and debt service. In a market with limited rental supply and high demand, owners may pass at least some of the cost of taxes through to their tenants, potentially increasing housing costs for renters.
Targeted changes to tax burdens could help ease the financial pressures many buildings face each month by helping owners preserve older rental buildings with rising operating costs and static or declining rental income. Further, such changes could result in additional rental supply, because a system that imposes higher effective tax rates on larger rental properties may discourage the development of new rental properties by reducing expected returns compared to other types of development.
Larger rentals are often overlooked in conversations about reforming the city’s property tax system. Our focus report provides detailed data analysis, historical context, and policy considerations regarding two key questions:
- Do large rental properties face higher effective tax rates than similarly valued, owner-occupied homes, and if so, what could be done to make the effective tax rates the owners of these different property types pay more equal?
- How could the current mass appraisal system deal with specific challenges associated with valuing 90%+ rent-stabilized buildings for property tax purposes in an environment where incomes are constrained and expenses are growing?
To help answer these questions, Section 1 of this report explains how New York City’s property tax system operates today, and explains how tax burdens are distributed across and within each of the classes of the property tax system.
Section 2 focuses on Class 2 properties: multifamily rental properties, condominiums, and coops. We document the extent to which larger rental properties with 11 or more units face a higher effective tax rate than other Class 2 properties (including smaller rental properties). We also examine potential consequences of moving to a sales-based valuation methodology for condominium and cooperative units.
Section 3 of the report focuses on the first question, and walks through potential reforms to the property tax system that would make the effective tax rate of larger rentals closer to the tax rate paid by owners of similarly valued cooperatives, condominiums, and one to three unit buildings. We also analyze how such a change could impact the tax burden placed on larger rental housing.
Section 4 of the report explores how the property tax system could be changed to better reflect the market values of buildings that are 90 percent or more rent-stabilized. Here we evaluate changes the City could make to its assessment guidelines for larger rental buildings to ensure that the assessed values for this critical stock of affordable housing appropriately take into account recent changes in the economics of these properties.
II. Why do large multifamily rental properties in Class 2 have some of the highest effective tax rates in the City?
a. Disparities Within New York City’s Property Tax System
Compared to other large U.S. cities, New York City is notable for the disparity in the tax burdens imposed upon rental versus homeowner buildings.
Each year, the Lincoln Institute of Land Policy publishes a study comparing property taxes across the largest cities in each state. The most recent study reveals that New York City has the highest disparity between the tax burdens faced by owners of apartment buildings and those faced by owners of “homestead” properties (owner-occupied primary residences). In 2025, Lincoln’s methodology found that the city’s apartment properties were taxed at 5.67 times the rate of those homes.1
The cities that rank second and third on this metric—Providence, Rhode Island and Charleston, South Carolina—tax apartment buildings at 3.39 times and 3.16 times the rate of owner-occupied primary residences, respectively. New York City’s peer cities have little disparity between apartment buildings and owner-occupied residencies. For example, Chicago’s ratio is 0.98 and Los Angeles’ is 1.01. Nationally, New York City is an outlier in the extent to which it imposes a disproportionate share of its tax burden on apartment buildings relative to other residential properties.
New York City’s disparity is not accidental; several design features, starting with the class system, have both produced and preserved these pronounced disparities between rental and homeowner units.
New York City’s property tax system is structured using four tax classes:
Class 1 consists essentially of properties with three or fewer residential units, whether those units are owner-occupied or rented.2
Class 2 includes the rest of the residential properties, whether rental, coops, or condos, and whether or not they include commercial space. Class 2 is broken out into four subclasses:
- 2a: 4- to 6-unit rental buildings;
- 2b: 7- to 10-unit rental buildings;
- 2c: 2- to 10-unit coops and condos; and
- The rest of class 2: residential properties with 11 units or more (sometimes referred to as “large” multifamily buildings in contrast to 2a and 2b being collectively referred to as “small” multifamily buildings).
Finally, Class 3 encompasses utility property (such as cell towers, railroad tracks, and power plants), and Class 4 consists of all other property not covered by Classes 1-3, including commercial and industrial properties.3
To achieve a property tax system with fewer variations in the relative tax burden across property types, the City would need to do two things:
- Use methods to value properties that accurately reflects each property’s market value;
- Apply a tax rate to that market value that ensures the effective tax rate—the amount of tax each owner pays, as a percentage of the market value—is consistent across properties (regardless of the nature of their use).
New York City’s system does not work this way across or within classes.4 First, the City’s methods for valuing properties produce values that do not align with the property’s actual market values of many types of properties – especially the coop and condo units that sell at the highest prices. Second, the City applies rules and tax rates inconsistently across property types, in part because of the design of the class share system.
Tax Rates and Class Shares
Each year, property tax rates in New York City are set through a multi-step process that begins with the City Council determining the overall levy, or the amount of property tax revenue the City needs. The total levy is then distributed across the four property tax classes based on class shares.
The portion of the levy that each class must pay—its “class share”—is based on the share each class shouldered in 1989, adjusted in two ways:
- The City Council annually updates each 1989 class share in proportion to the appreciation (i.e., the growth in value not resulting from additions, demolitions, and class transitions) in the class’s total full (taxable) market value relative to other classes since 1989. However, if a class’s share would grow by more than five percent relative to the previous year, the statute authorizes the City Council to allocate the growth above that limit among the remaining classes.
- The City also frequently lobbies the state to lower that five percent growth limit in a class’s share further. In practice, growth in Class 1’s share most typically exceeds the five percent limit. The reallocation among the other classes of the additional tax burden above the limit is at the discretion of the City Council, which has tended to disfavor classes 3 and 4.
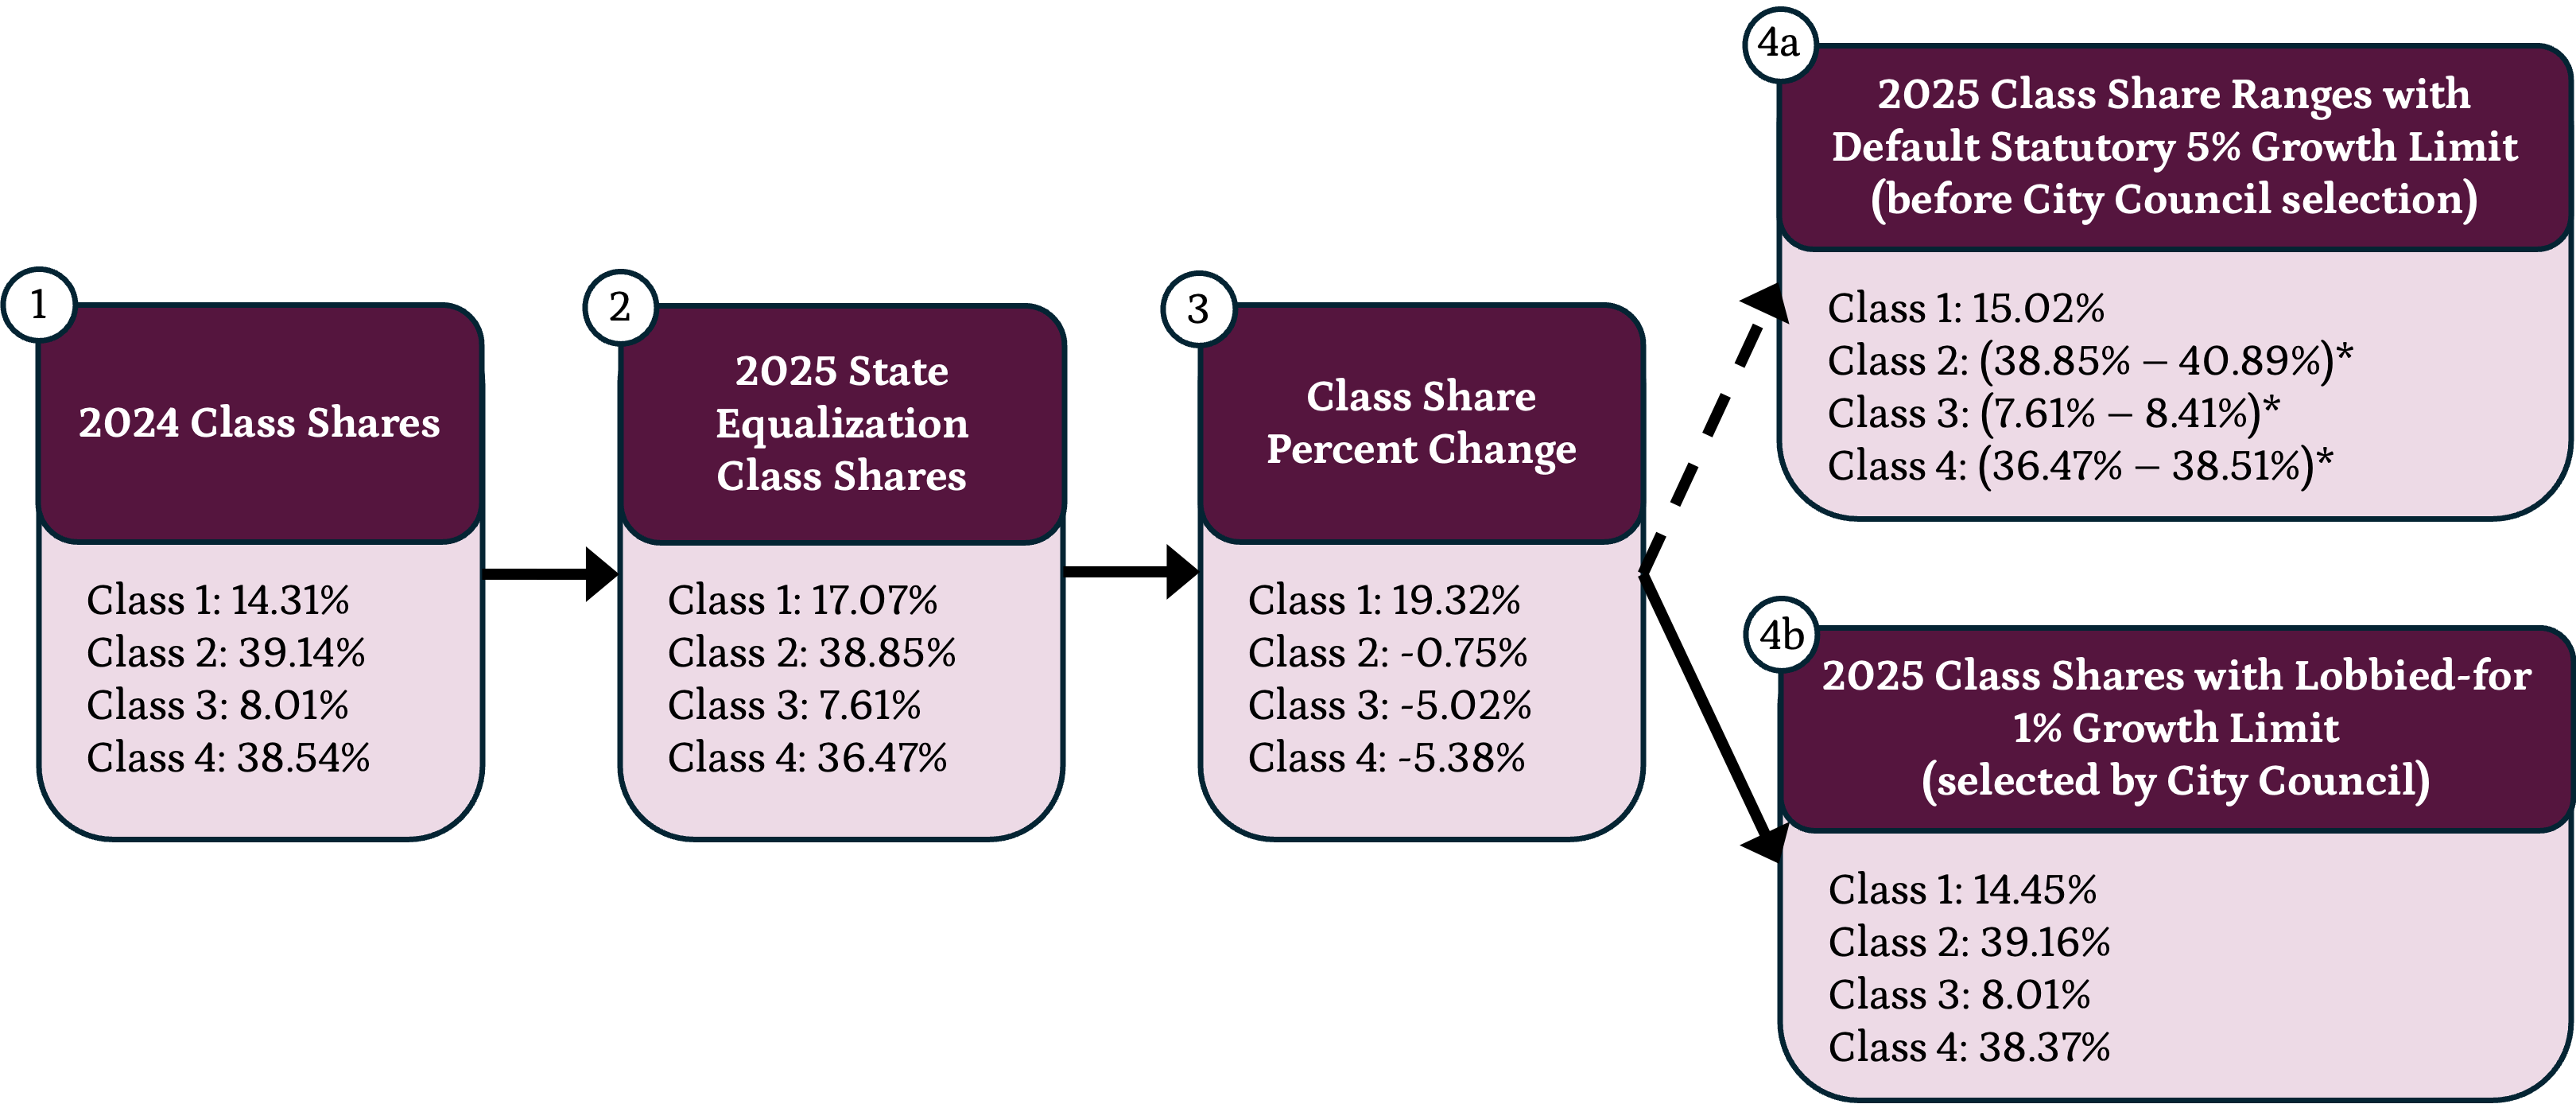
Figure 1 illustrates how these growth limits can work to shift the tax burden between classes, using the 2025 resolution certifying class shares.5 The first box shows the final class shares for 2024. The second box shows each class’s share after the state adjusts for appreciation but before applying the growth limits. The third box shows the growth in Class 1 between box 1 and box 2, which exceeded the five percent limit. The 19.32% percent change reflects how application of growth limits has compounded over time.
Then box 4-a shows the permissible ranges for 2025 class shares under the default five percent statutory growth limit. Class 1’s share would have been set at a five percent increase from 14.31 percent, which is 15.02 percent (rather than the 17.07 percent its share would be without the limit). In this scenario, the City Council would then have allocated the incremental 2.05 percentage points of difference between Class 1’s pre- and post-limit share among the other classes, while still respecting the five percent limit on growth of other class’s shares.6 This results in the asterisked ranges shown in parentheses in box 4-a.
However, box 4-b shows the actual 2025 class shares, which were subject to a one percent growth rate limit after the City successfully lobbied the state to override the standard five percent limit. Under a one percent limit, Class 1’s share could only grow to 14.45 percent, leaving 2.62 percentage points for the Council to allocate. Ultimately, the Council chose to allocate a small amount to each of Classes 2 and 3 (0.31 and 0.4 percentage points respectively), and most of the increment to Class 4 (1.9 percentage points).
Figure 1:
Once each class’s share of the levy is determined, class-specific tax rates are calculated by dividing the class’s share by the class’s taxable billable assessed value. As a result, tax rates vary across classes depending on both their assigned share of the levy and the size of their tax base.
Valuation Methods
This report focuses on two methods used by DOF for annually assessing a residential property’s value:
- Income Capitalization-Based Approach: The tax assessor uses an adjusted version of the property’s reported income and expenses (or a comparable property’s income and expenses), then DOF models a capitalization rate to translate the property’s adjusted net operating income into a market value.
- Sales-Based Approach: The tax assessor uses an actual sale, or a sales price from comparable properties, within a model that then generates a market value.
This section of the report has two subsections. Subsection 1 lays out the disparities across the four classes. Subsection 2 demonstrates how property taxes are calculated across the different classes. To understand the current complexities and inequities of New York City’s property tax system, it may also be helpful to trace its historical development. A summary of that history can be found in the Appendix.
1. Disparities Across the Four Classes
Because of the structure of the property tax system and the distinct rules applied to each class, Class 2 multifamily properties face higher effective tax rates. That statement is true whether the comparison is based on current assessment methods or on the application of a uniform sales-based valuation method across the residential classes properties. Within Class 2, larger rental buildings also pay higher effective tax rates than all other Class 2 properties, including cooperatives, condominiums, and smaller rental properties, when the comparison is based on sales-based methods for valuing properties.
As Table 1 shows, Class 1 properties account for a majority of the city’s market value (49.5%), as measured by the Department of Finance (DOF), but contribute a much smaller share of the total tax levy (14.8%), resulting in a relatively low effective tax rate of 0.7% percent.
In contrast, Class 2 properties represent a smaller share of DOF’s measure of market value (24.7%) but bear a disproportionately large share of the levy (39.3%), leading to a notably higher effective tax rate of 3.7 percent.7
Table 1:
| Real Property Taxes – FY2025 | ||||||||
| Tax Class | Property Type |
Parcels
|
Units
|
Market Value
|
Tax Levy
|
ETR | ||
|---|---|---|---|---|---|---|---|---|
| # | # | $ Billions | % | $ Billions1 | % | |||
| Class 1 | 1-3 Family Homes | 698,272 | 1,097,237 | $738.3 | 49.5% | $5.2 | 14.8% | 0.7% |
| Class 2 | Rental Buildings, Condos, and Coops | 304,692 | 2,036,238 | $369.2 | 24.7% | $13.7 | 39.3% | 3.7% |
| Class 32 | Utilities | 354 | — | $59.0 | 4.0% | $3.0 | 8.5% | 5.0% |
| Class 4 | Commercial | 97,502 | — | $325.2 | 21.8% | $13.0 | 37.4% | 4.0% |
| Citywide | — | 1,100,820 | 3,133,475 | $1,491.6 | 100.0% | $34.8 | 100.0% | 2.3% |
| 1 Tax Levy is calculated after applying tax exemptions and abatements. | ||||||||
| 2 Tax Class 3 data was sourced from NYC Department of Finance Annual Report of the New York City Real Property Tax | ||||||||
| Sources: NYC Department of Finance, NYU Furman Center | ||||||||
In Table 1, DOF’s measures for market value, the denominator for these effective tax rates, are using two different valuation methods. Class 1 uses a sales-based valuation method and Class 2 used an income capitalization based valuation method which yields lower estimates of market value than a sales-based approach does. These comparisons between levy shares and “market value” should therefore be interpreted cautiously.
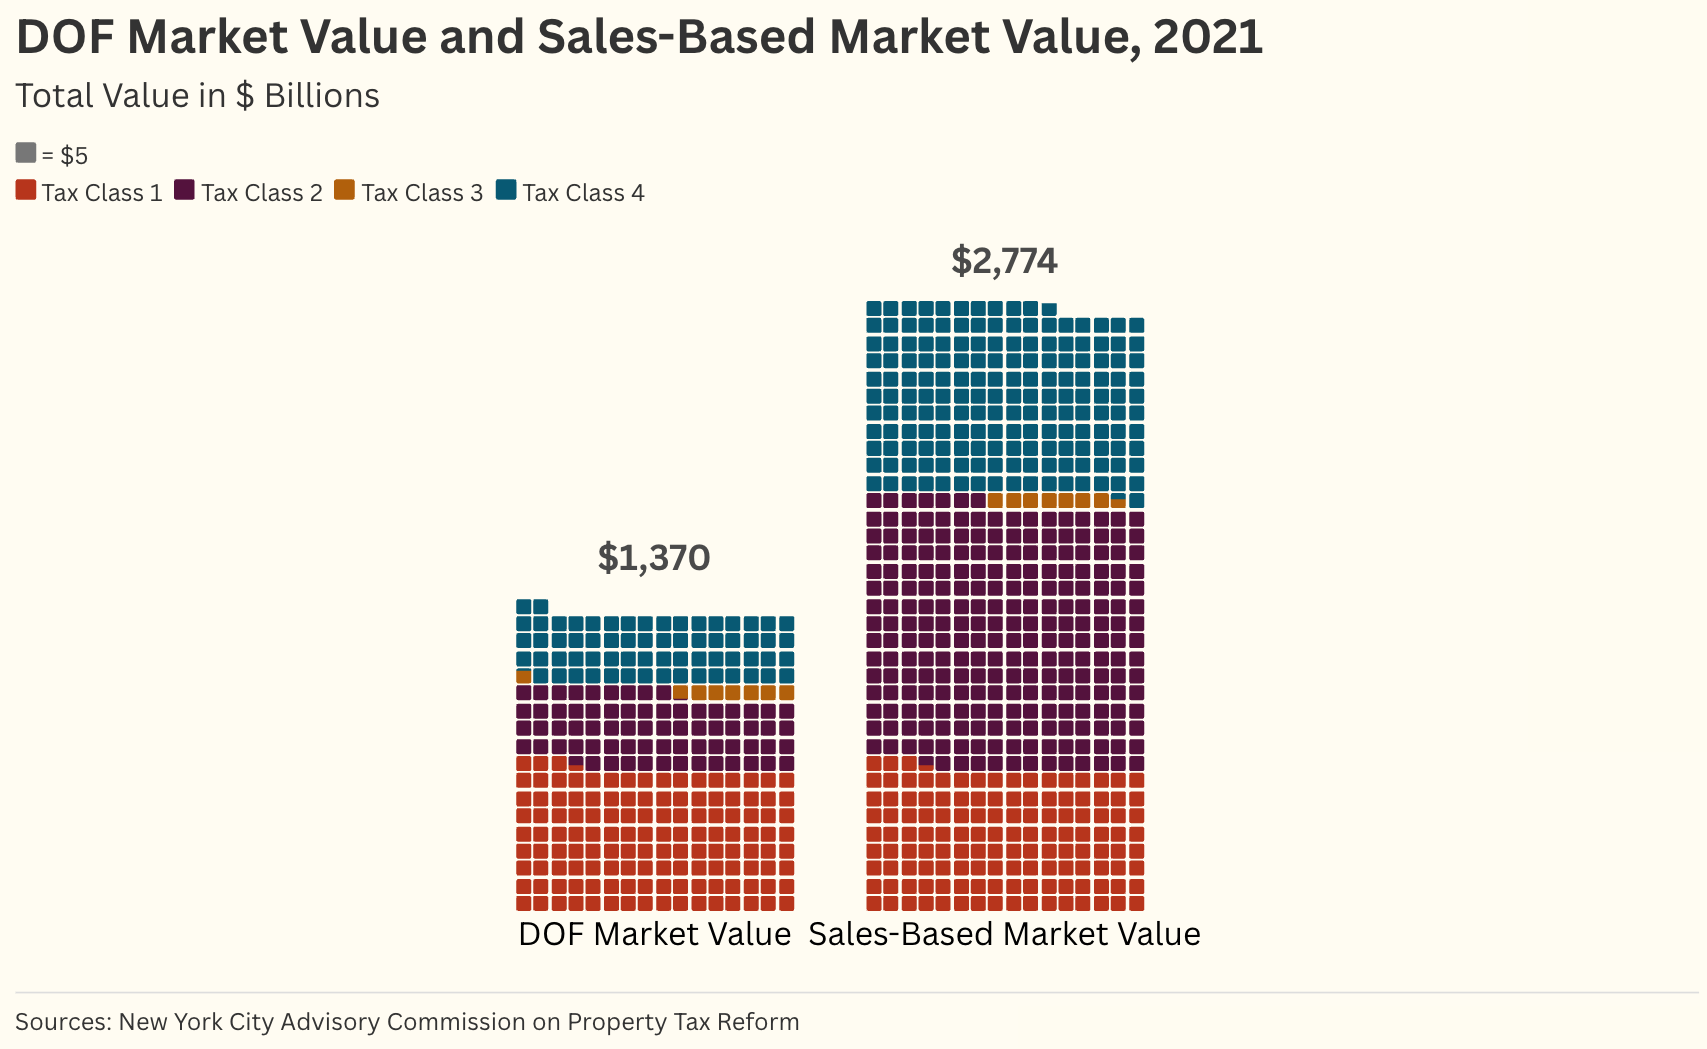
Figure 2 takes the overall tax levy, and two methods of assessment—the “sales-based market values” and the “DOF market values”—and plots them each into a separate chart. These values are all from 2021 and were estimated by DOF for the final report of the New York City Advisory Commission on Property Tax Reform.8 The “DOF market values” are the actual values DOF estimated in 2021 using a sales-based method for Class 1 properties and an income-capitalization approach for Class 2 properties. The “sales-based market values” are estimates using a sales-based method of valuation across all properties.
Notably, as shown in Figure 2, when DOF uses the sales-based method of valuation for all properties (including coops and condos as we discuss in Section 3), the overall value of Classes 2 and 4 grows substantially, as does that for New York City’s real estate as a whole.
Figure 2:
A system with no disparities would ensure each class’s share of the total DOF market value – our pie on the left in Figure 3 – would match that class’s share of the value of units when they are sold – our pie in the middle in Figure 3 – and that both would then match the class’s actual share of the total tax levy – our pie on the right. In other words, the slice of the pie each class consumes would be the same percentage across the three pies. However, because of both the class share system and the application of different approaches to valuation across classes, there are significant disparities across classes:
Figure 3:
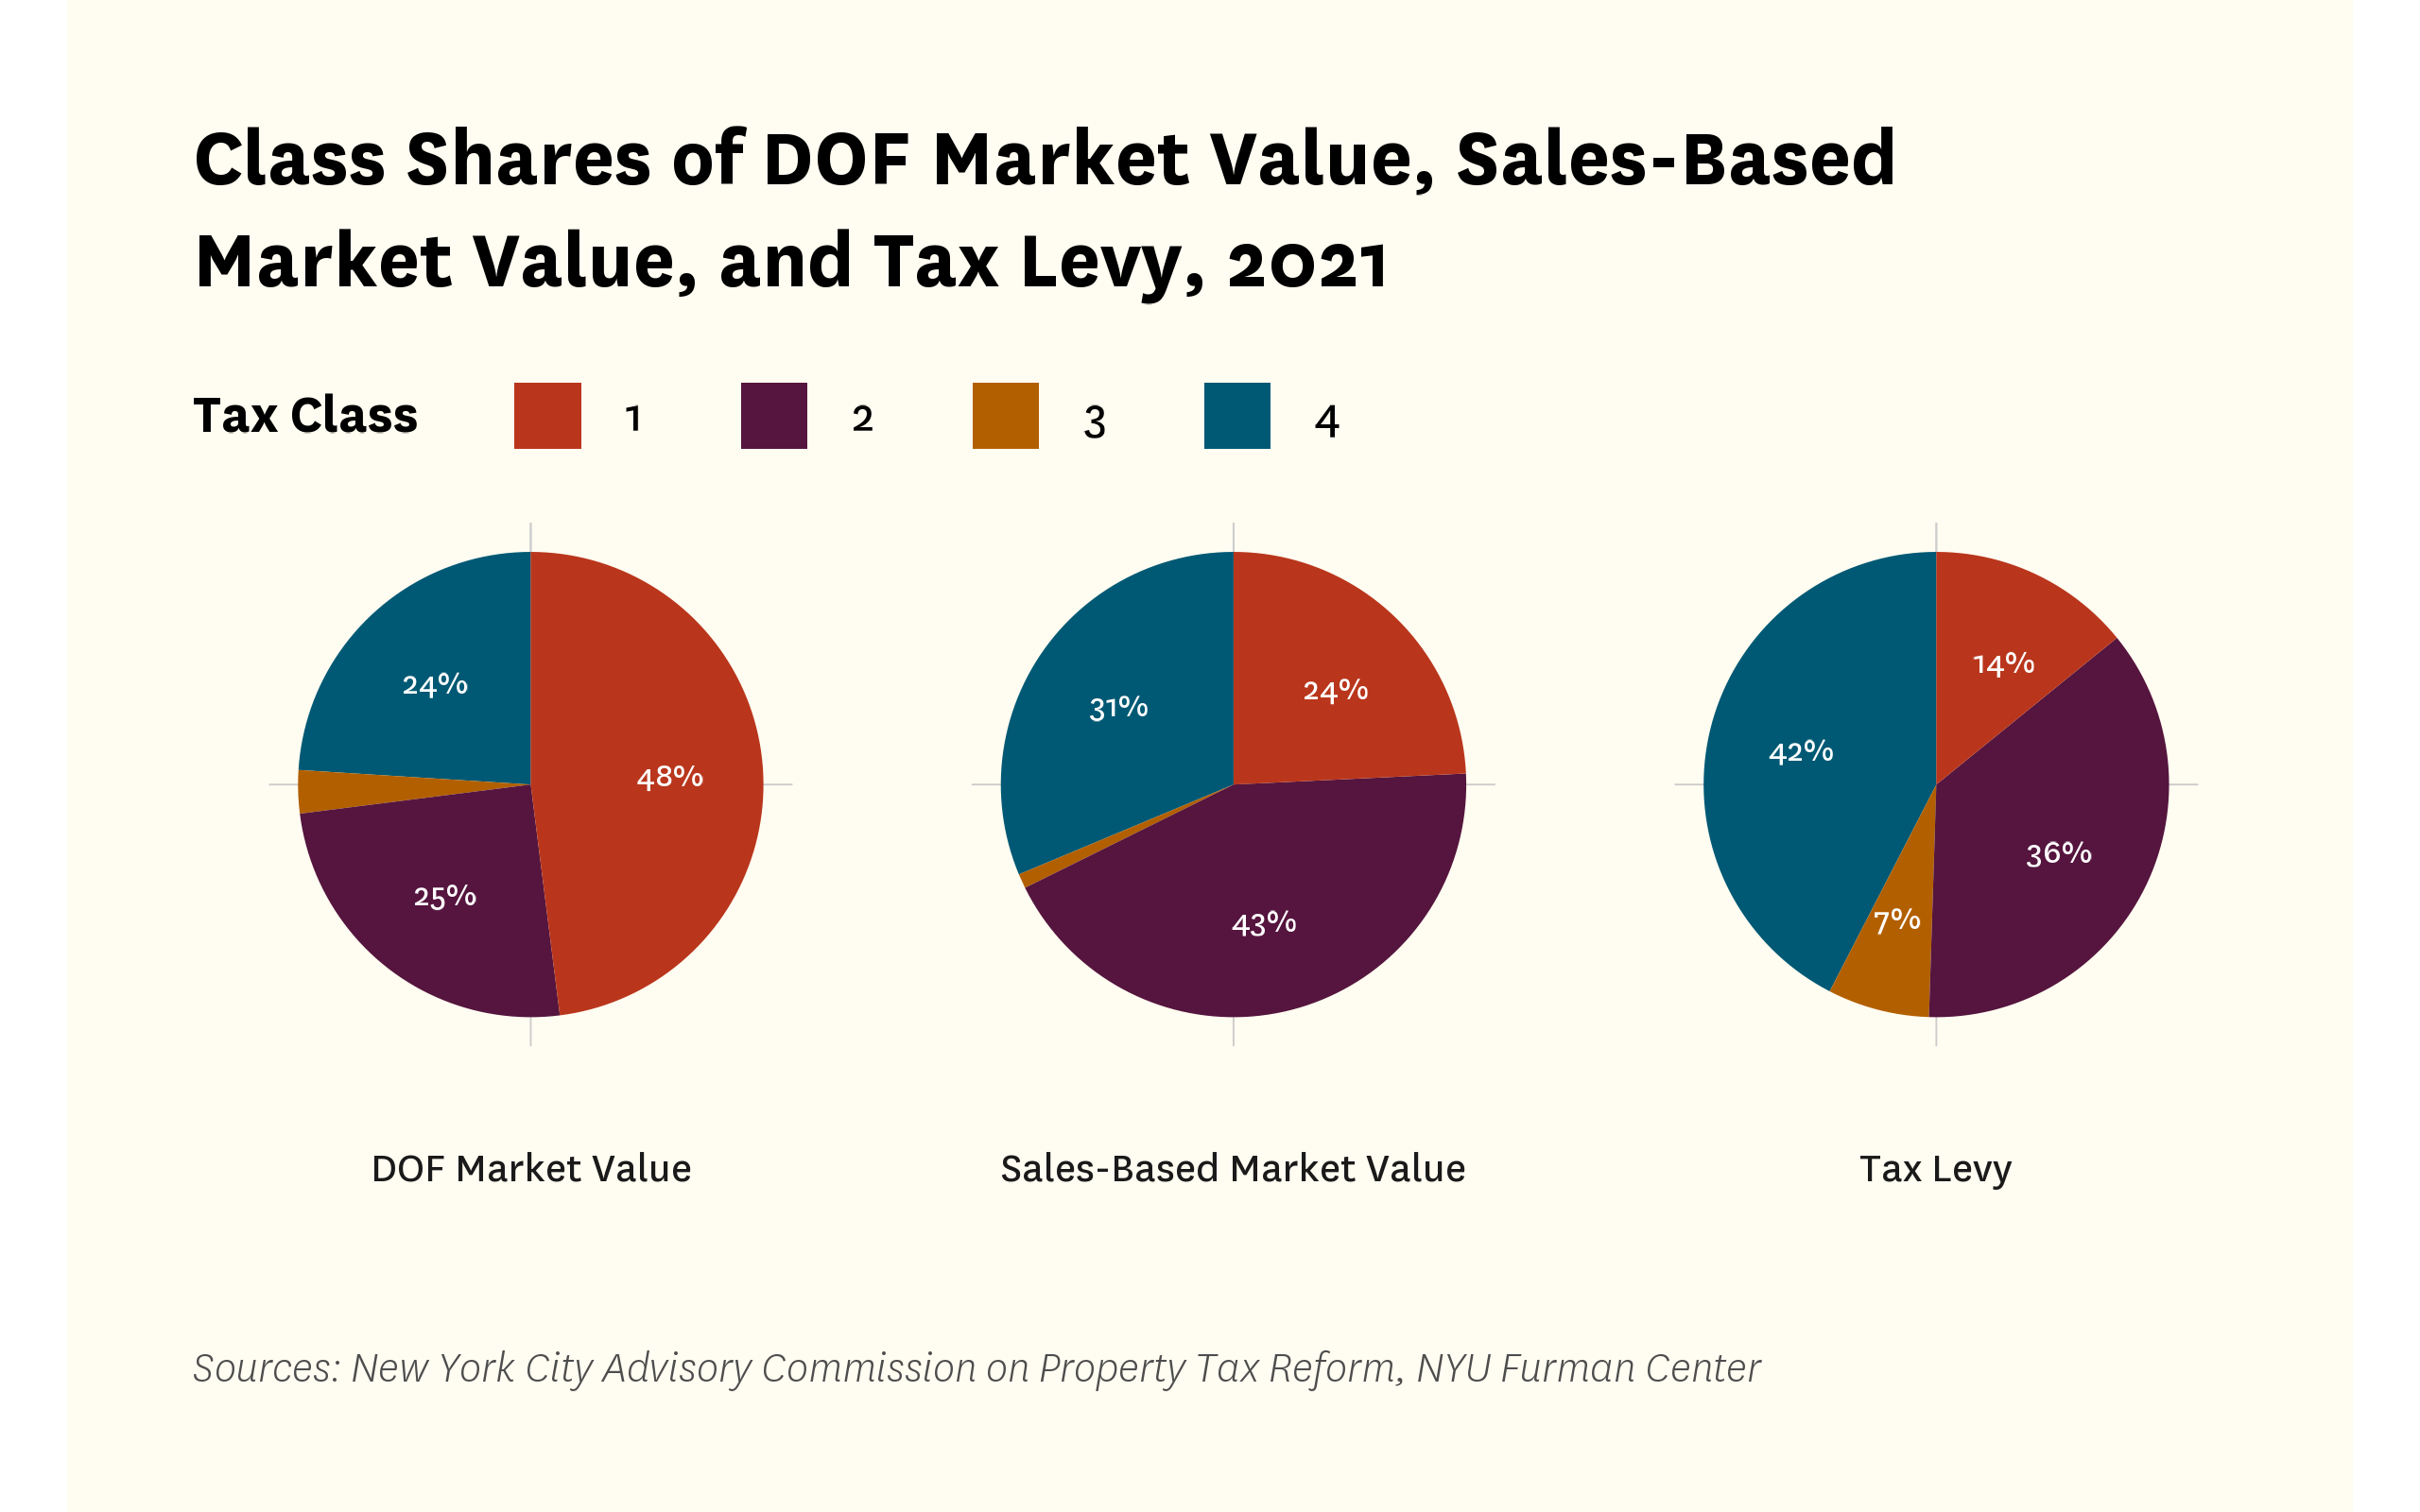
Figure 4 below shows disparities across the four classes remain even when we use a consistent sales-based method of valuation across both Class 1 and Class 2. The gap between Class 1 and Class 2’s share of total sales-based market value and its share of the total tax levy is due in part to the city’s class share system, which has kept Class 1’s (and to a lesser extent Class 2’s) share of the levy relatively constant since 1989, even as the underlying market value has grown. Each year, the resulting excess tax burden is shifted to other classes, so that Classes 3 (utilities), and 4 (all other property) pay a larger share of the levy than their share of the market value.
Figure 4:
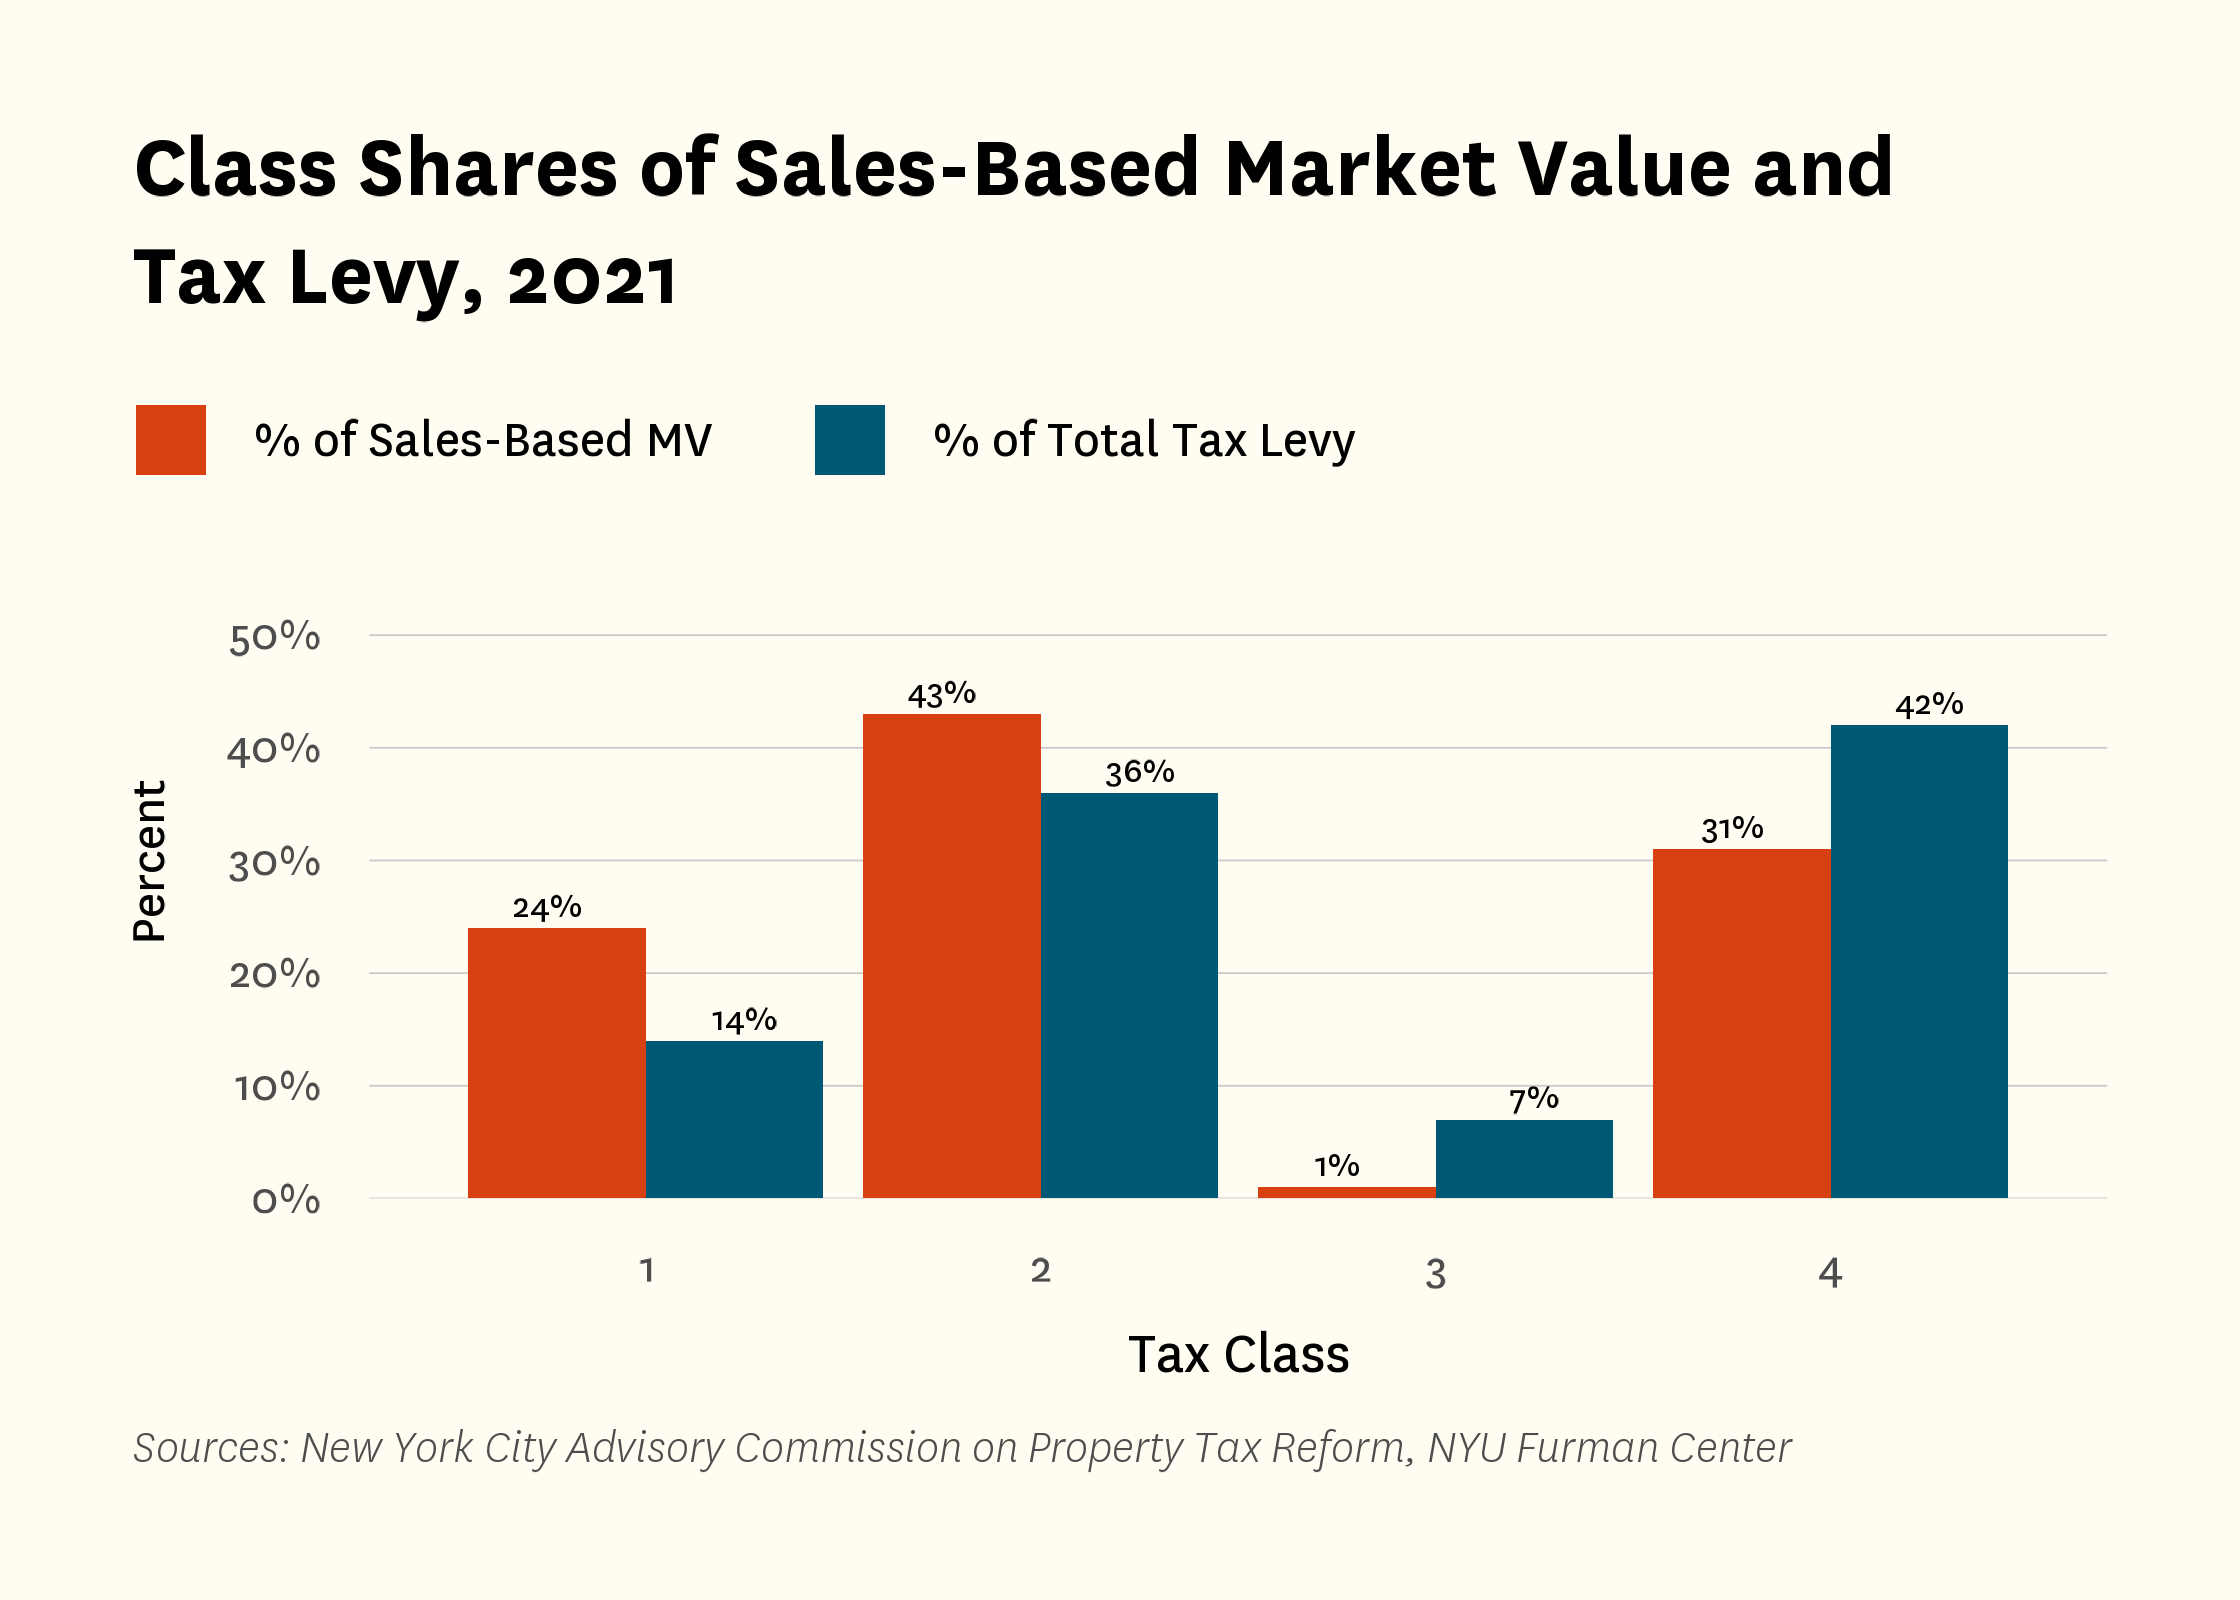
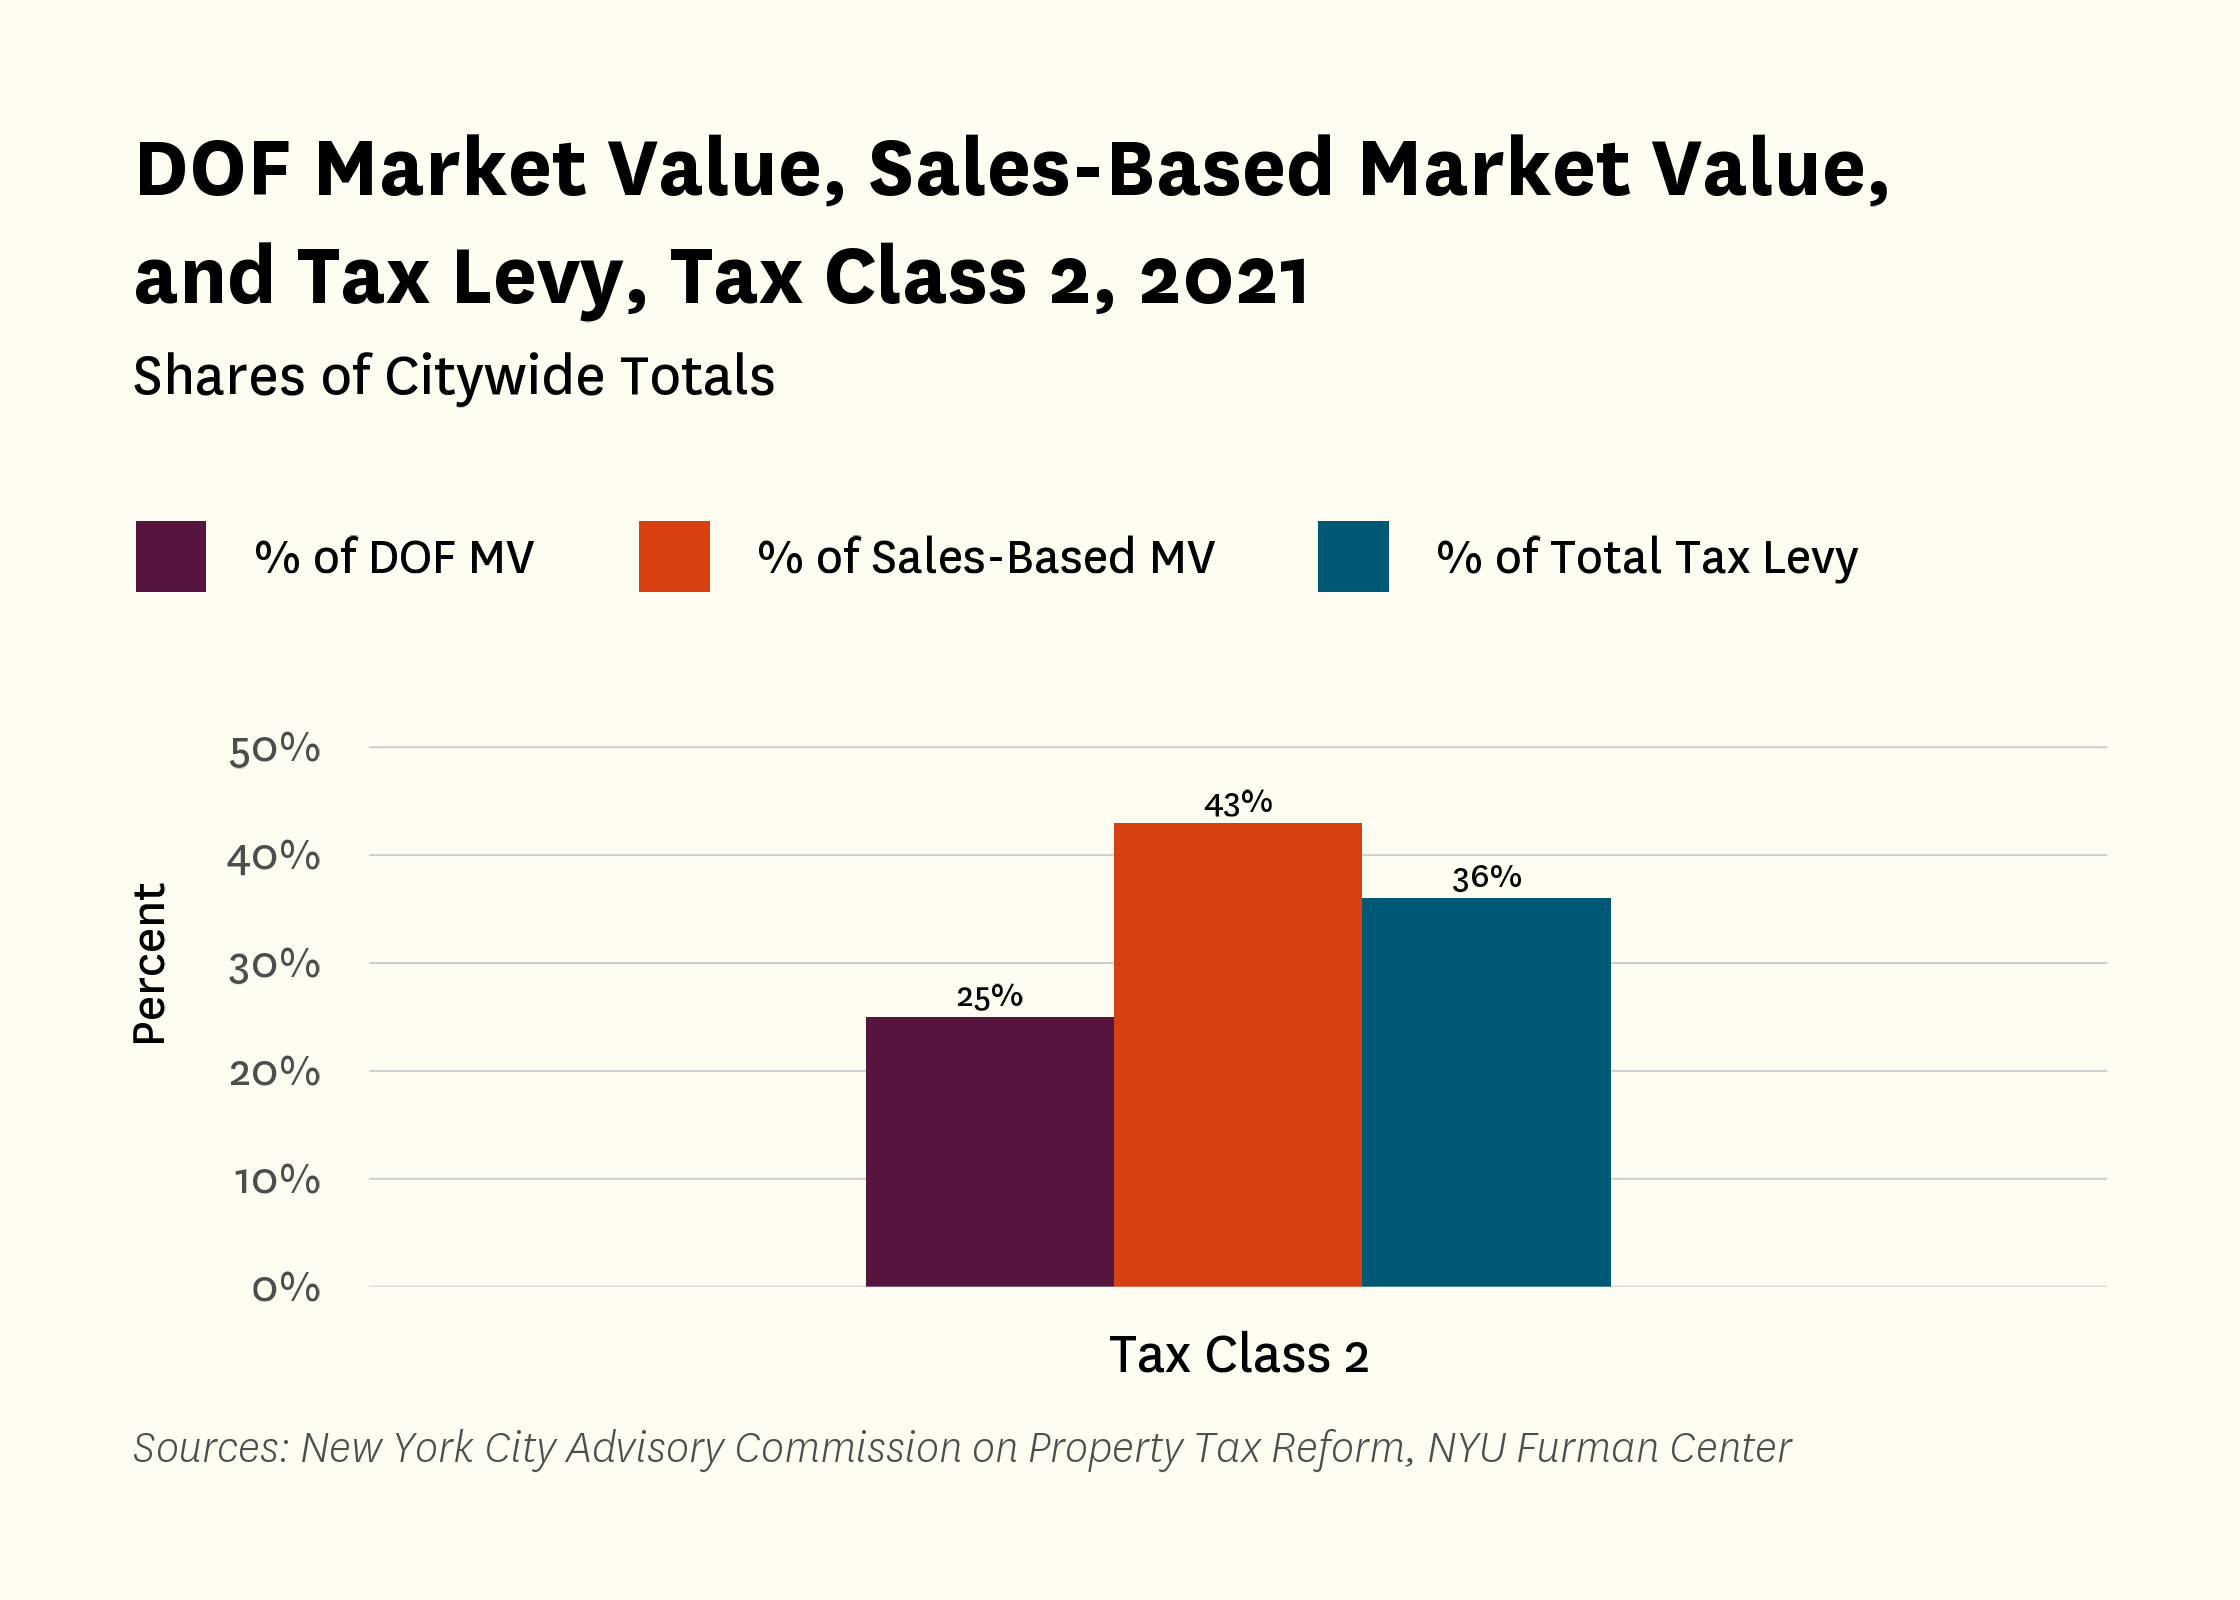
For Class 2’s multifamily properties, the picture is also more nuanced (Figure 5). Class 2 properties pay a greater share of the total tax levy (36%) than their share of DOF market value (25%). This suggests they are paying more tax than they would if their effective tax rate was similar to Class 1. However, Class 2’s share of the tax levy (36%) also falls below its share of sales-based market value (43%), though by a smaller margin than the gap observed for Class 1.
Figure 5:
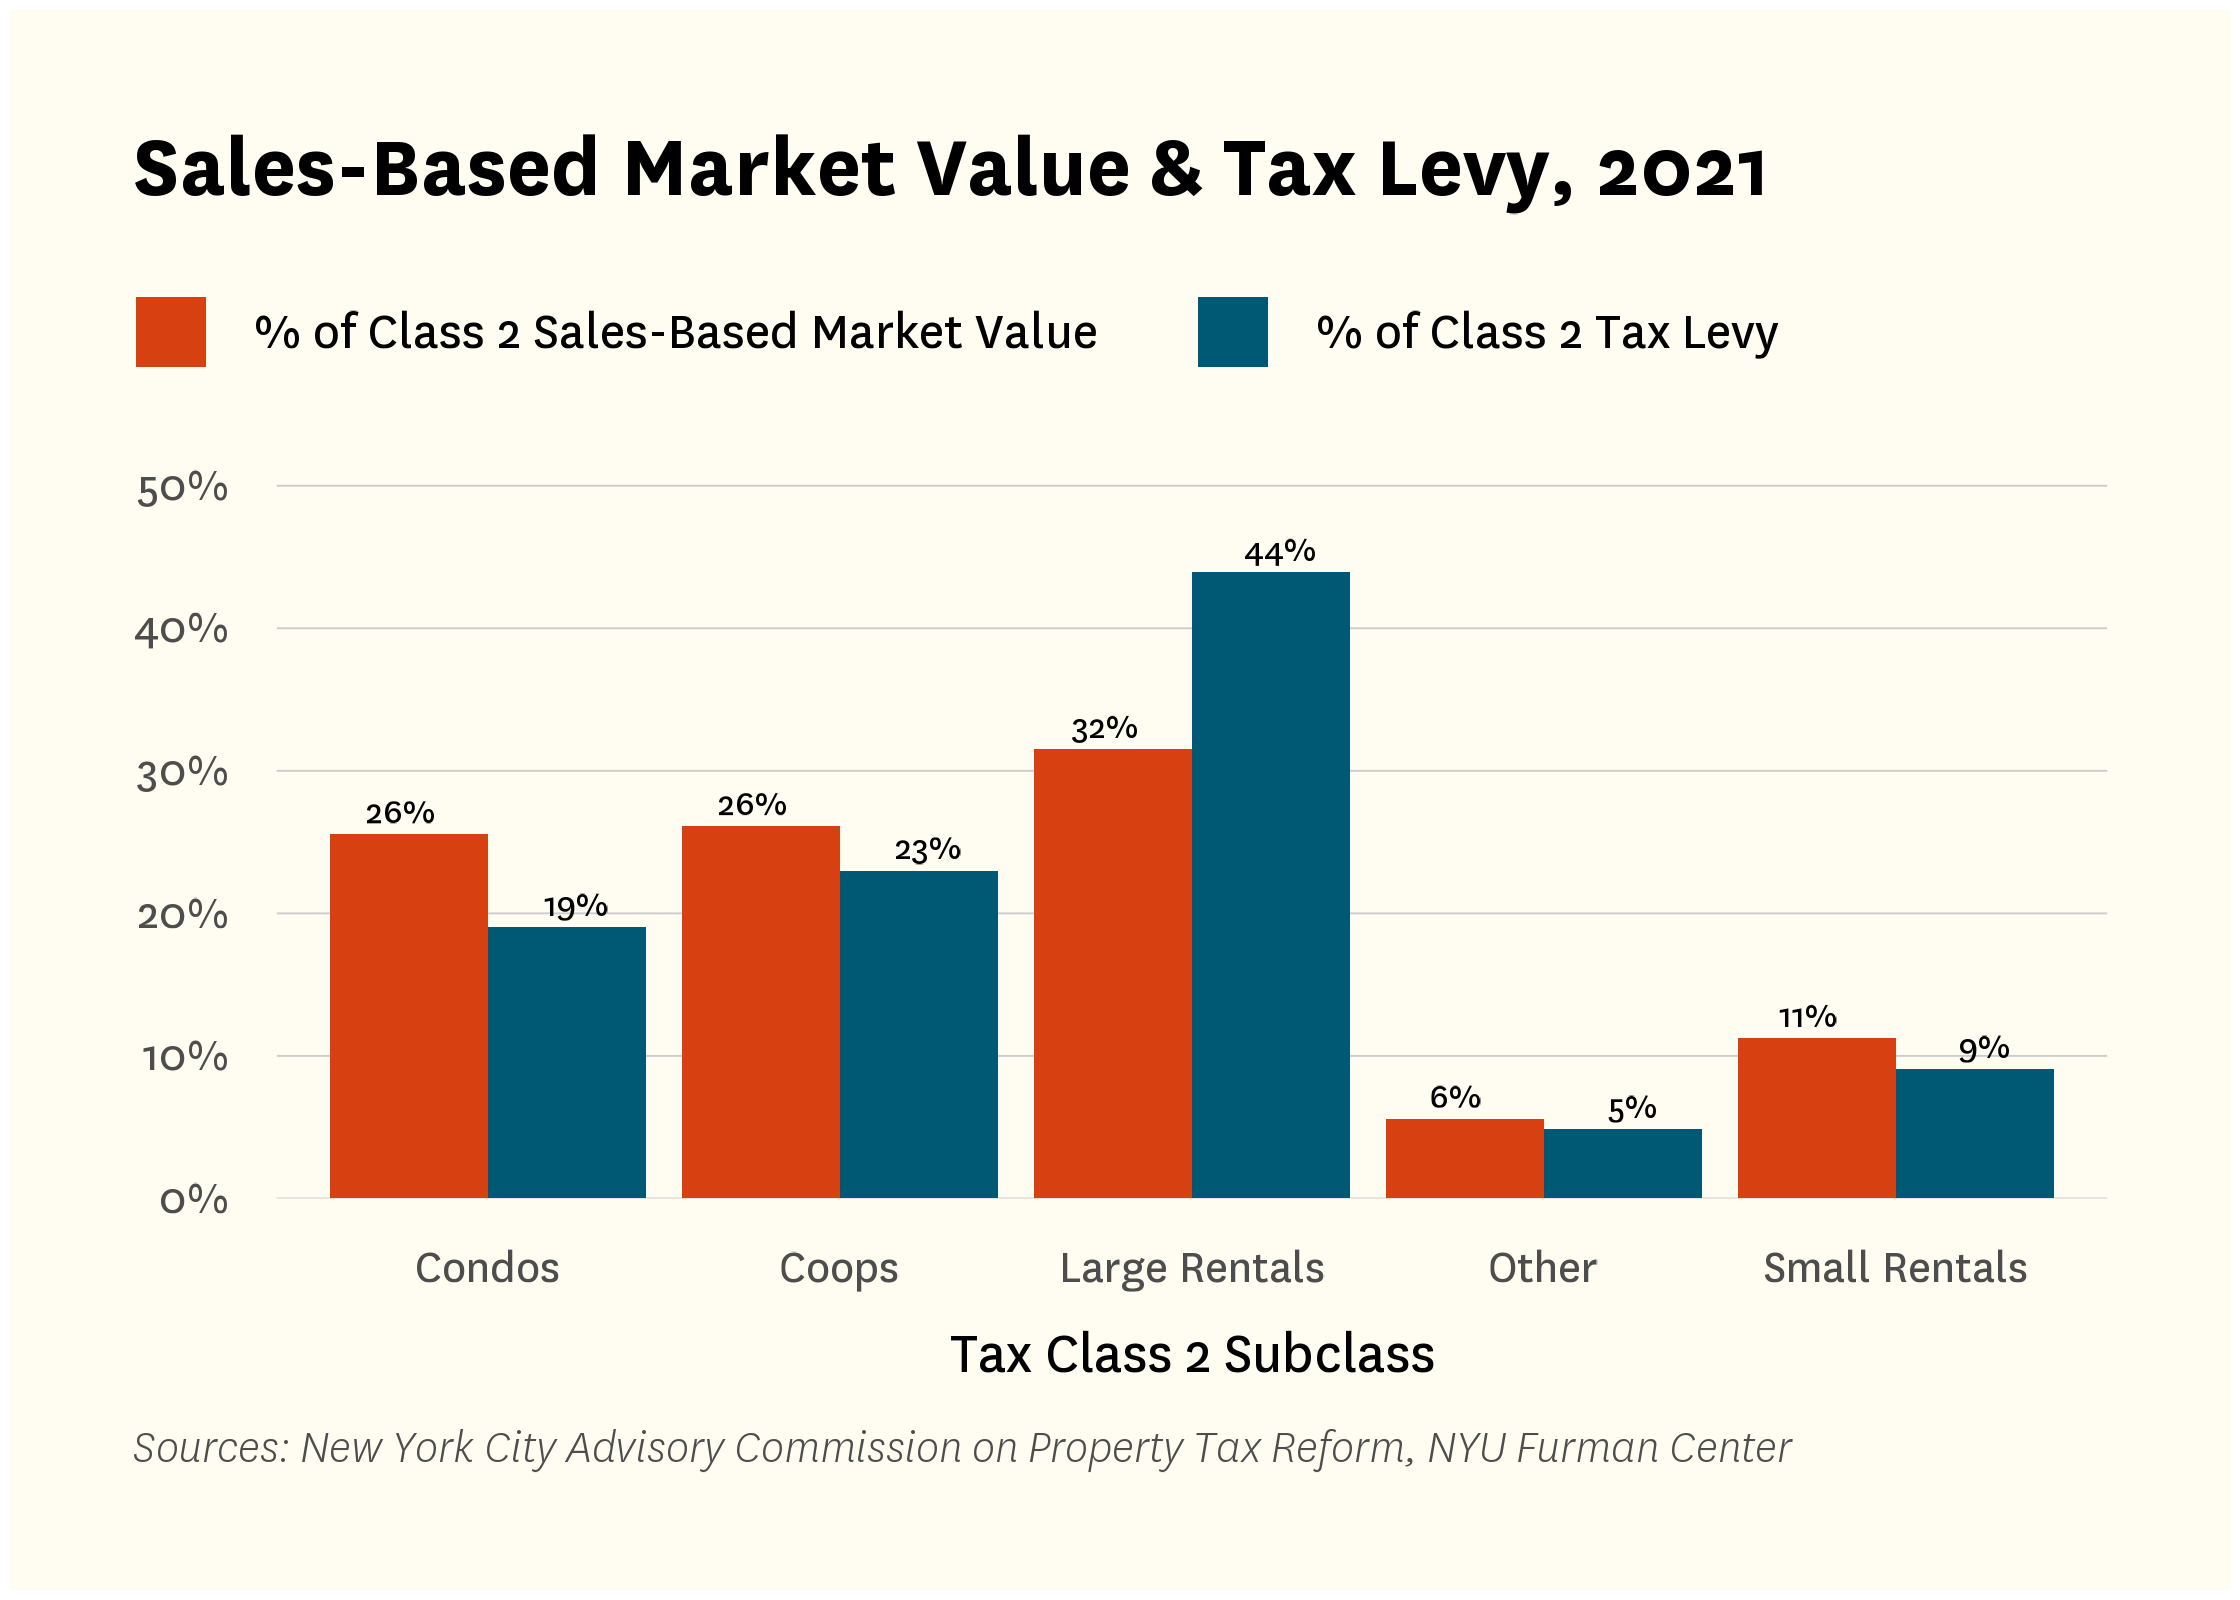
As we explore in Section 3 and as shown in Figure 6, this difference is driven by variation within the class: condos, coops, and small rental properties in Class 2 are undertaxed relative to their sales-based value while large rentals are overtaxed relative to their sales-based value. In other words, if each subclass in Figure 6 paid a percentage of the levy that aligned with their percentage of the sales-based value, Class 2 as a whole would pay an amount of the levy that was closer to its share of the total sales-based market value:
Figure 6:
Within Class 2, there is a significant disparity between DOF values and sales based market values for the most expensive coop and condo units because of the special way they are treated under the law. The result is that their “market values” are much lower than the properties’ actual values when they are sold. These properties are typically owner-occupied but DOF is directed by state law to value them as if they were similarly situated rental buildings. As a result, DOF estimates their value based on the income of “comparable” rental properties.9 We find that DOF’s estimates of market values are significantly lower than actual sales prices, especially at the higher end of the condo and coop market where rental properties cannot serve as good comparables. These data from the New York City Advisory Commission on Property Tax Reform’s 2021 final report show that using sales-based estimates provides a more consistent basis for comparison across classes.10
2. Calculating Property Taxes
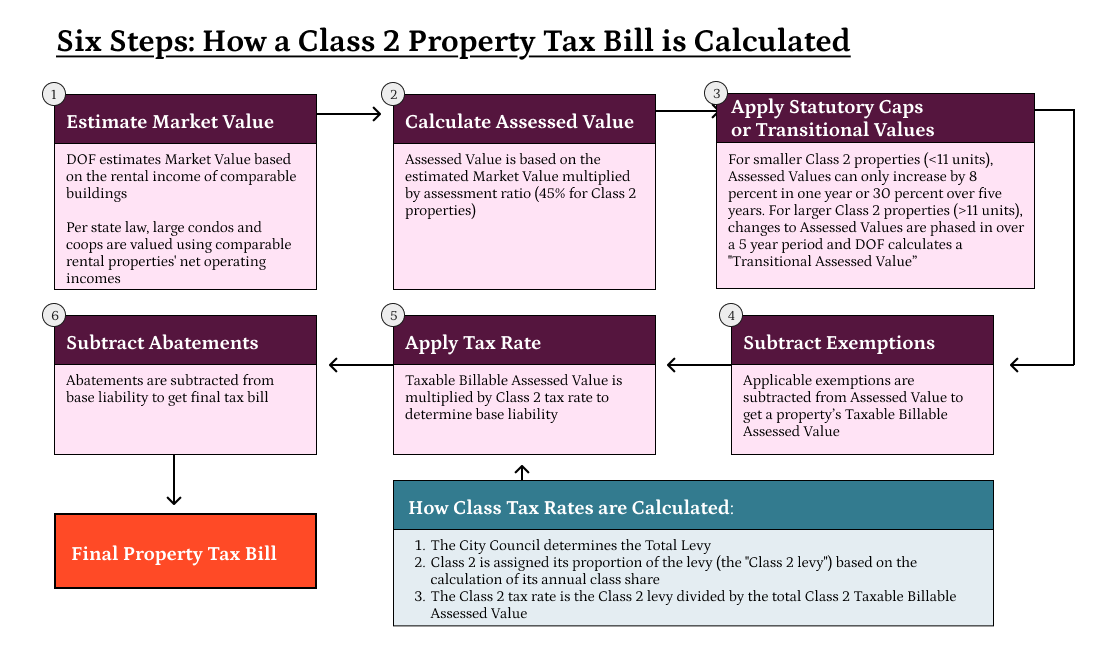
The New York City Department of Finance (DOF) follows six steps to calculate property taxes for residential properties (Figure 7).
Figure 7:
- Step 1: Determine Market Value
First, DOF estimates the full market value of the property, using methodologies that vary depending on the property type (Table 2).11 While state statute limits DOF’s discretion over the valuation of certain kinds of properties (coops, condos, and rentals in particular),12 and caselaw has narrowed its discretion with respect to the valuation approach,13 it retains some discretion, including over the particular valuation methods and models used.14 DOF generally uses the ‘market price’ (sometimes also called ‘sales’ or ‘comparables’) approach for valuing Class 1 properties, basing the valuation on sales of comparable properties in recent years. DOF broadly uses the ‘income capitalization’ approach for valuing Class 2 and 4 properties, and the ‘cost’ approach for valuing Class 3 properties.15
Table 2:
| Property Tax Classes, Market Value Estimation, Assessment Ratio, and Assessment Rules | ||||||
| Tax Class | Property Type | Methodology for Computing Market Value | Assessment Ratio |
Assessed Value Caps
|
Transitional Assessed Value | |
|---|---|---|---|---|---|---|
| 1 Year | 5 Years | |||||
| 1 | 1, 2, 3-Family | Comparable Sales | 6% | 6% | 20% | No |
| 2 | Coops and Condos (11+ Units) | Net Income Capitalization of Income from Comparable Rental Buildings | 45% | — | — | Yes1 |
| 2 | Large Rentals (11+ Units) | Net Income Capitalization | 45% | — | — | Yes1 |
| 2A-B | Small Rentals (4-10 Units) | Gross Income Multiplier Based on Available Rental Income | 45% | 8% | 30% | No |
| 2C | Small Coops and Condos (2-10 Units) | Gross Income Multiplier Based on Available Rental Income | 45% | 8% | 30% | No |
| 3 | Utility Property | Reproduction Cost New Less Depreciation | 45% | — | — | No |
| 4 | Commercial Property | Net Income Capitalization | 45% | — | — | Yes1 |
| 1 Transitional assessed value reflects growth from market value changes phased in over 5 years. | ||||||
| Source: NYC Department of Finance. (2018). New York City property tax system background, https://www.nyc.gov/assets/propertytaxreform/downloads/pdf/RPT-Overview-for-Commission-2018-07-20.pdf. | ||||||
Because we focus on Class 2 and multifamily properties in this report, it is particularly helpful to lay out DOF’s methods for larger rental properties and coops and condos:
- Larger Rental Buildings (11+ Units): DOF values larger rental properties with 11 or more units based on annual income generated by the property after deducting expenses (the net operating income), as self-reported by the property owner in the form of Real Property Income and Expense (RPIE) statements16 DOF then reviews the submissions and applies adjustments to the reported figures according to their assessment guidelines.17 The assessment guidelines ensure an owner, for example, cannot exceed certain vacancy or expense ratio caps, which would lower their values. Then, DOF applies a capitalization rate (the expected rate of return based on the building’s revenue), to the adjusted net operating income to estimate market value.18
- Smaller Class 2 properties (10 units or Fewer): These properties are not required to submit RPIEs, and are instead valued according to the gross income multiplier method. DOF identifies comparable rental properties and uses their income to estimate the income per square foot for the subject property. It then calculates the building’s total income by multiplying the estimated income per square foot by the building’s total square footage. Finally, it multiplies the estimated income by a set factor to estimate the property’s market value.19
- Larger Coops and Condos (11+ Units): State law requires DOF to value larger coops and condos as rental properties20 even though they do not typically generate rental income.21 To estimate the value of coops and condos, DOF chooses two to three rental buildings that are considered comparable based on factors like size, location, and building age.22 The agency then reviews and models the properties to estimate the income and expense each coop and condo would generate based on those rental comparables. DOF then applies a capitalization rate to determine a building’s estimated market value.23 Coops are assigned a market value for the entire building, while condo buildings are assigned a market value, and then individual units are valued based on the “unit allocation factor” provided by the condo board.24
As we discuss in Section 3, DOF’s approach to valuing larger coops and condos does not generate an estimated market value that is consistent with actual market values. Using this approach, condos and coops are compared with older rental buildings, including rent-stabilized properties where income is constrained, so DOF often produces estimates that fall well below observed market prices.25 This discrepancy is particularly pronounced for higher-value coop and condo properties.
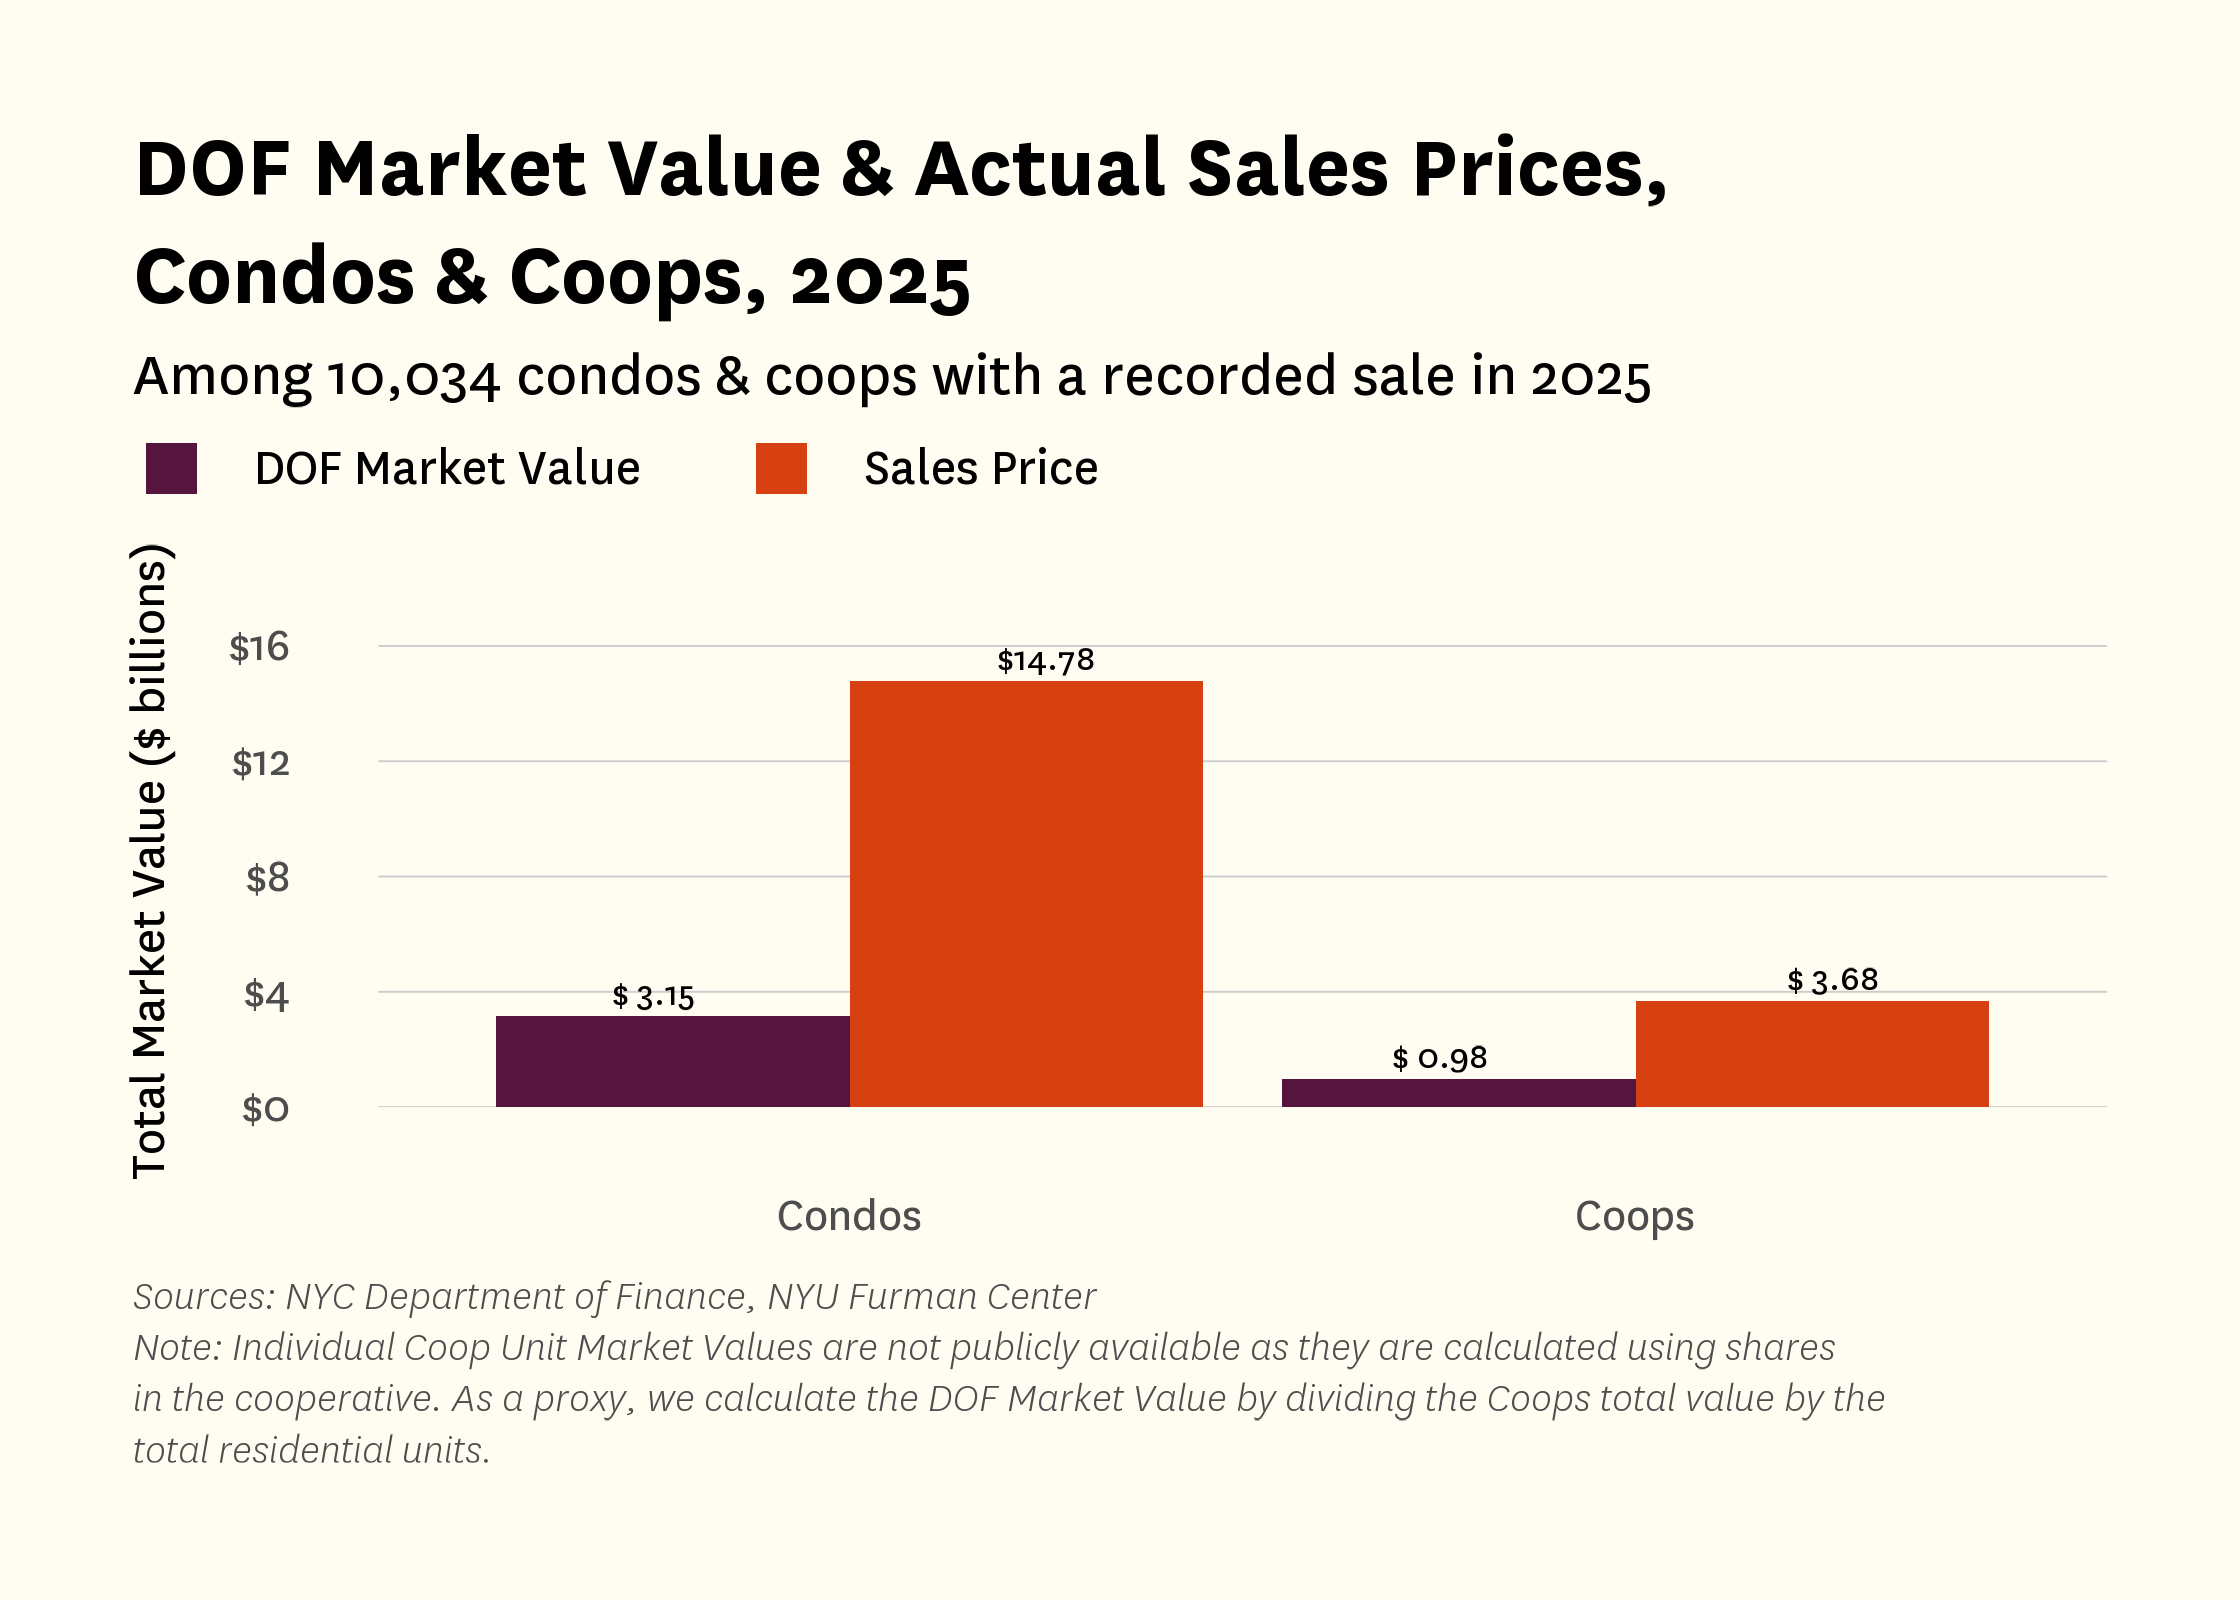
Figure 8 shows for the 10,034 coop and condo units sold in 2025 (which is a non-random subset of all coop and condo units), the difference between the total of DOF’s estimates of the market value and the total actual sales prices.26 For those properties, the difference in total market value was $2.7 billion for coops, and $11.6 billion for condos. The median difference between the DOF market value and the actual sales price for a single coop and condo in that year was $849,667 and $806,356, respectively.
Figure 8:
- Step 2: Calculate Assessed Value
Second, DOF calculates the “assessed value” of the property by multiplying the full market value of the property it estimates (according to the applicable assessment method described above) by the “target assessment ratio.” The City has some discretion to choose the target assessment ratio, but the state’s high court recently affirmed that this discretion is limited by the statutory mandate to ensure all property is “assessed at a uniform percentage of value” within each class.27
The target assessment ratio for Class 1 properties is 6 percent of their market value, compared to the 45 percent ratio applied to Class 2, 3, and 4 properties.
- Step 3: Apply Caps or Transitional Values
Third, DOF applies statutory assessed value caps and phase-ins, ostensibly to prevent dramatic changes in a property’s assessed value due purely to changes in market value (changes due to physical improvements are not restricted).28 The assessed value of Class 1 properties cannot increase by more than 6 percent in a single year or by 20 percent over any five-year period.29 For Class 2 properties with ten or fewer units the applicable caps are 8 percent and 30 percent respectively.30 Properties in neighborhoods with high rates of appreciation often hit these caps, further lowering assessed values for Class 1 and small Class 2 properties relative to actual market values.
For Class 2 properties with 11 or more units and all Class 4 properties, DOF phases in changes in assessed value at 20 percent annually over a five-year period (subject to a restriction that the resulting ‘transitional value’ is capped at the actual assessment value).31 The resulting transitional assessed value incorporates a pipeline of incremental changes in value from the current year and the previous four years, smoothing volatility in market value and delaying the full impact on tax liability.32
- Step 4: Subtract Exemptions to Determine the Taxable Actual Assessed Value
Fourth, DOF calculates the property’s “taxable actual assessed value” by subtracting any applicable exemptions from the (full/capped/transitional, as applicable) assessed value, reducing the tax liability of certain properties. Only the state legislature has the power to grant exemptions33, and has granted them only for a few narrow categories: certain individuals34, developments35, and institutions36 in particular.37 However, the state has given City Council discretion over certain aspects of some of these programs, like their eligibility requirements and how generous they are.38 For more information on major residential tax exemption programs, see the Appendix.
- Step 5: Multiply the Taxable Billable Assessed Value by Tax Rate to Determine Base Liability
Fifth, for Class 2 and 4 properties, DOF determines the taxable billable assessed value, which is the lower of the taxable actual assessed value or the transitional taxable assessed value. Residential properties with 10 or fewer units do not have a transitional taxable assessed value, so their taxable billable assessed value is equal to the actual taxable assessed value after exemptions.39 DOF40 then sums the taxable billable assessed value across all properties in each class and calculates the class’s tax rate.
Each year, property tax rates in New York City are set through a multi-step process described in detail above. In short, the City Council determines the overall levy, which is then distributed across the four property tax classes based on class shares.41
The levy is the dollar amount that City Council votes to raise through the property tax. New York State’s Constitution limits the amount the City can raise via the property tax to 2.5 percent of the five-year average of the estimated full market value of taxable real estate in the City.42
The levy is split between the four classes described above based on the share each class shouldered in 198943 adjusted44 in proportion to the appreciation in the class’s total market value relative to other classes since 1989.45 The City Council’s discretion over this adjustment is limited: appreciation is largely measured by the state Office of Real Property Tax Services and calculated according to statutory and state regulatory formula.46
However, as explained above, if a class’s share grows by more than five percent relative to the previous year as a result of the first adjustment, the City Council can allocate the excess growth to other classes.47 Further, the City frequently lobbies the state to limit growth in some class’s shares to an even lower percentage.48 The result is that historically, some or all the appreciation in values in Class 1 has been assigned to other classes, making taxpayers in those classes pay a higher share of the levy.49
Finally, class-specific tax rates are calculated by dividing the class levy by the class’s taxable billable assessed value.50 That value is multiplied by the class tax rate to calculate a property’s final “tax bill”.
- Step 6: Subtract Abatements to Determine Final Tax Bill
Sixth, DOF applies property tax abatements to the property’s tax bill. As is the case for exemptions, the state legislature alone has the power to grant abatements, and has granted them only for a few narrow categories.51 Similarly, the state has also granted the City some discretion over certain abatement programs.52
As an example, the City’s largest residential abatement program, the Cooperative and Condominium Property Tax Abatement Program, was created to reduce coop and condominium taxes so that they more closely align with those of one- to three-family homes, which benefit from caps on the growth in class shares and caps on assessed value growth. The abatement is substantial, reducing eligible owners’ tax liability by between 17.5 and 28.1 percent.53
Table 3 provides a detailed look at how property taxes were calculated for a large rental property that sold in 2025. In this example, the larger rental property’s DOF market value was 41.00% of the property’s actual sales price. At the end of the process, the large rental property’s tax bill was 1.2 percent of the property’s sales price and 2.8 percent of DOF estimates of the property’s market value.
Table 3:
| Example Multifamily Property Tax Calculation (FY 2025) | ||
| Step | Larger Rental Property | Notes & Calculations |
|---|---|---|
| Description of Property | Borough: The Bronx Number of Units: 40 Last Sold: 2025 Sales Price: $4,100,000 |
|
| 1. Determine Market Value | $1,681,000 | 41.0% of sales price |
| 2. Calculate Assessed Value | $756,450 | Market Value × 45% |
| 3. Apply Caps and/or Transitional Values | $763,110 | Applying Transitional Assessed Value |
| 4. Subtract Exemptions to Determine Taxable Billable Assessed Value | $394,2291 |
|
| 5. Multiply the Taxable Billable Assessed Value by Tax Rate to Determine Base Liability | $49,278.64 | Taxable Value × Tax Rate; ($394,229 x 12.5%) |
| 6. Subtract Abatements to Determine Final Tax Bill | −$2,186.38 | SCRIE |
| Final Annual Property Tax Bill | $47,092.262 |
|
| 1 Exemption Value is subtracted from the Taxable Assessed Value, which is the lower of the Actual Assessed Value and the Transitional Value. In this case, the Actual Assessed Value of $756,450 is the lower value. | ||
| 2 The base liability value in this table is taken from Quarter 3 tax bills which use the FY25 tax rate. | ||
| Sources: NYC Department of Finance, NYC Department of Housing Preservation and Development, NYU Furman Center | ||
New York City’s Property Tax System: Who Controls What?
Different entities govern different components of New York City’s property tax system, which has important implications for the feasibility of reform proposals. For example, the New York City Department of Finance can adjust elements of the assessment process, such as setting capitalization rates for rental, condominium, and cooperative properties, or modifying maximum expense ratio caps. In contrast, the State Legislature controls the broader structure of the system, including the class share framework and statutory limits on the growth of assessed values. See Table 4 for more information.
Table 4:
| State and Local Actors’ Powers and Duties for New York City’s Property Tax System | |
| Primary Powers and Duties | |
|---|---|
| State Legislature | Controls the statutory framework for property taxation—subject to the state constitution’s equalization and full value requirements. Mandates the class share system (definitions, 1989 baseline, growth caps), valuation approaches, and tax exemptions and abatements. |
| State Department of Taxation & Finance | Carries out and regulates the valuations used in calculating appreciation from 1989 to determine the state equalization rate that will be used to calculate class shares. |
| City Council | Sets the annual property tax levy subject to the state constitution’s 2.5% of the five-year-average of the estimated full marker value of taxable real estate in the City, and redistributes excess class share growth among the classes. |
| City Department of Finance | Calculates properties’ assessed values, including choice of assessment ratio and valuation method and model, subject to the state constitution’s full value requirement and the state statute’s uniformity requirement. This includes DOF’s selection of comparables for non-regulated condos/coops, as well as capitalization rates, expense-ratio caps, and the target assessment ratio under RPTL 305(2). |
| Sources: NYU Furman Center | |
a. Key Takeaways
A property tax bill in New York City is the product of layered interactions between many government entities, sources of laws, and policies.
Under the class share system, a property’s tax bill depends primarily on three things: the property’s taxable value (determined by the six steps previously described), the City’s overall levy, and the class shares.54 Over time, the process of estimating values and distributing the tax burden across classes has caused significant disparities across the property tax system.
Footnotes
- [1] Lincoln Institute of Land Policy & Minnesota Center for Fiscal Excellence. (2026). 50-state property tax comparison study. https://www.lincolninst.edu/publications/other/50-state-property-tax-comparison-study-2025/. New York City’s effective tax rate (ETR, or the tax levy divided by market value) on apartment buildings is high, ranking 5th among peer cities. In contrast, the city’s ETR for homestead properties is extremely low, ranking 50th out of the 53 cities reviewed. One important caveat to these rankings is that the Lincoln Institute report relies on median market values from the US Census Bureau’s American Community Survey (ACS). As such, the ETRs in the report differ from those explored later in this paper. In addition, the Lincoln Institute’s categories for which buildings are apartments and which are “homestead” follow different criteria from New York City’s property tax classes. Note that the study includes 53 cities because it includes Washington, DC, as well as two cities each in Illinois and New York, where property tax systems in Chicago and New York City differ substantially from those in the rest of their states.
- [2] Class 1 includes most condominiums under four stories, and buildings with a few apartments as well as a store or other commercial use. New York City Department of Finance. (n.d.). Definitions of property assessment terms. https://www.nyc.gov/site/finance/property/definitions-of-property-assessment-terms.page
- [3] New York City Department of Finance. (n.d.). Definitions of property assessment terms. https://www.nyc.gov/site/finance/property/definitions-of-property-assessment-terms.page; N.Y. Real Prop. Tax Law § 1802.
- [4] While this report focuses on rental properties, there are concerns about disparities within homeownership properties across different types of neighborhoods. See, for example: Murphy, M., & Brenner, R. (2024). Racial inequities in New York City’s property tax system. NYU Furman Center. https://www.furmancenter.org/publication/racial-inequities-in-new-york-citys-property-tax-system; Davis, J., & Champeny, A. (2018). New York City homeowners: Who’s got the unfairest tax burden of them all? Citizens Budget Commission. https://cbcny.org/research/new-york-city-homeowners; Gates, M. (2019). Residential property taxation in New York City (Working Paper WP19MG1). Lincoln Institute of Land Policy. https://www.lincolninst.edu/app/uploads/legacy-files/pubfiles/gates_wp19mg1.pdf
- [5] New York City Council. (2025). Resolution 1103-2025: Resolution to amend and restate the resolution computing and certifying base percentage, current percentage, and current base proportion of each class of real property for Fiscal 2026 to the State Board of Real Property Tax Services pursuant to Section 1803-a of the Real Property Tax Law, Exhibit A. https://legistar.council.nyc.gov/LegislationDetail.aspx?ID=7715473&GUID=C9AFA5E7-9A7E-4C99-A032-395AF2BEF9DA&Options=&Search=https://legistar.council.nyc.gov/View.ashx?M=F&ID=14895183&GUID=F7B2C24E-3D78-4909-AE9D-28E9FBEE5EB2
- [6] For example, the Council could not allocate the full amount of the increment above the growth limit to Class 3 because 7.61% plus 2.05% (the full increment) would have exceeded 8.41% (which reflects 5% growth above the 2024 class share percentage).
- [7] Note that a Gini based metric is an important tool for a vertical equity analysis based on shares. For our analysis, a simple comparison of shares is sufficient to demonstrate the disparities. More information on Gini metrics can be found here: Lincoln Institute of Land Policy. (n.d.) Lincoln Institute vertical equity app. https://www.lincolninst.edu/data/lincoln-institute-vertical-equity-app/; International Association of Assessing Officers. (2026). Standard on ratio studies: exposure draft May 2026. https://www.iaao.org/wp-content/uploads/StandardonRatioStudies_Exposure-Mar2026.pdf
- [8] New York City Advisory Commission on Property Tax Reform. (2021). The Road to Reform: A Blueprint for Modernizing and Simplifying New York City’s Property Tax System. https://www.nyc.gov/assets/propertytaxreform/downloads/pdf/final-report.pdf
- [9] Some coops and condos receive the Cooperative and Condominium Property Tax Abatement, which is intended to align their tax burden more closely with that of single-family homeowners. The market values underlying Figures 1-3 are estimated prior to those abatements, although the tax levy is net of abatements and exemptions.
- [10] New York City Advisory Commission on Property Tax Reform. (2021). The road to reform: A blueprint for modernizing and simplifying New York City’s property tax system. https://www.nyc.gov/assets/propertytaxreform/downloads/pdf/final-report.pdf
- [11] Tax Equity Now NY LLC v. City of New York, 42 N.Y.3d, No. 01498, slip op. at 2 (Court of Appeals of New York. 2024) [hereinafter TENNY].
- [12] Coops and condos (except those in Class 1) must be assessed “at a sum not exceeding the assessment which would be placed upon such parcel were the parcel not owned or leased by a cooperative corporation or on a condominium basis.” See N.Y. Real Prop. § 581(1). Rental property is to be valued without regard to the value it might have if converted to a condo or coop (or sold or owned for such purpose). See N.Y. Real Prop. Tax Law § 581(3).
- [13] New York’s high court has construed this provision to mean that “condominiums and cooperatives should be assessed as if they were conventional apartment houses whose occupants were rent-paying tenants.” See Greentree at Lynbrook Condominium No. 1 v. Board of Assessors, 81 N.Y.2d 1036 (1993). This appears to implicitly require the income capitalization approach because the income capitalizationmethod “is generally regarded as the preferred method for determining the value of income-producing property . . . [though it] can be effective only with thorough data . . . .”See 41 Kew Gardens Rd. Assoc. v. Tyburski, 70 N.Y.2d 325 (1987). Nonetheless, the Court of Appeals has held that the provision does not necessarily require DOF to compare condos to rent-regulated apartments, at least not where there are non-regulated comparables: . . . Greentree’s observation that the properties at issue there had to be assessed as if they were rent stabilized is not an immutable proposition that must be applied in all cases. Instead, it reflects the fact that all the rentals in the assessing unit at issue in Greentree were rent stabilized. In fact, most of New York City’s rentals are not rent stabilized. Nothing in the plain text of RPTL 581 requires municipalities to assess a luxury condominium or cooperative as if it were a regulated apartment where the properties differ in meaningful ways. Instead, the RPTL requires municipalities to treat condominiums and cooperatives like other similarly situated rentals. Therefore, to the extent that condominium and cooperative properties would not be subject to rent stabilization if they were not held in ownership, the proper comparable is a non-rent-regulated unit. Therefore, claims that the comparisons are inapt and produce unlawful disparities, are sufficient to survive the motion to dismiss. See TENNY, 42 N.Y.3d 20–21.
- [14] FMC Corp. v Unmack, 92 N.Y.2d 179 (1998) (“a property valuation by the tax assessor is presumptively valid . . . [h]owever, when a petitioner challenging the assessment comes forward with ‘substantial evidence’ to the contrary, the presumption disappears. . . . [P]etitioner need merely provide credible and competent evidence, usually in the form of a competent appraisal, that a valid dispute exists concerning the property’s valuation.”).
- [15] For example, the DOF sometimes switches between the Net Income Capitalization and Gross Income Multiplier methods for calculating the value of Class 2 properties under the income capitalization approach. Even within the former, there are different methods available for calculating the cap rate. See, e.g., New York City Department of Finance Property Division. (2026). FY 2027 RPIE 2024 Income and Expense Distributions (discussing the Ellwood formula). https://www.nyc.gov/assets/finance/downloads/pdf/26pdf/additional-income-expense-dist-fy-2027.pdf
- [16] New York City Department of Finance. (n.d.). Real property income and expense (RPIE) statements. https://www.nyc.gov/site/finance/property/property-rpie.page
- [17] New York City Department of Finance. (2025). FY 2026 Guidelines for Properties Valued Based on the Income Approach, Including Office Buildings, Retail, and Residential Properties. https://www.nyc.gov/site/finance/property/fy26-assessment-guidelines.page
- [18] New York City Department of Finance. (n.d.). NYC Class 2 Residential Property Taxes. https://www.nyc.gov/assets/finance/downloads/pdf/brochures/class_2_guide.pdf
- [19] New York City Department of Finance. (n.d.). NYC Class 2 Residential Property Taxes. https://www.nyc.gov/assets/finance/downloads/pdf/brochures/class_2_guide.pdf
- [20] N.Y. Real Prop. Tax Law § 581 and footnote 13 for more detail.
- [21] Some coop and condo units are rented out to tenants by their owners.
- [22] New York City Department of Finance. (2026).Cooperative and condominium comparables. https://www.nyc.gov/site/finance/property/property-cooperative-and-condominium-comparables.page
- [23] Under prevailing interpretations of state statute and caselaw, DOF uses capitalization rates based on one year of net income, rather than market capitalization rates that incorporate speculation related to forward-looking revenue growth or price appreciation. See N.Y. Real Prop. Tax Law §§ 302, 305, 581; Counsel State Board of Real Property Services, Opinion No. 45 (concluding that state statute and caselaw mandates valuation based on current use), https://www.tax.ny.gov/pubs_and_bulls/orpts/legal_opinions/v10/45.htm.
- [24] New York City Department of Finance. (n.d.). NYC class 2 residential property taxes.https://www.nyc.gov/assets/finance/downloads/pdf/brochures/class_2_guide.pdf.
- [25] Been, V., Hayashi, A. & Yager, J. (2013). Shifting the burden: Examining the undertaxation of some of the most valuable properties in New York City. NYU Furman Center. https://www.furmancenter.org/wp-content/uploads/2013/07/FurmanCenter_ShiftingtheBurden.pdf
- [26] Note: the 2025 DOF market value relies on RPIE filings from the year 2023 adjusted forward by DOF. The sales prices represent actual condo and coop sales from 2025. This analysis includes all condos and coops sold in 2025, regardless of property size, including those in both Class 2 and 2c).
- [27] See N.Y. Real Prop. Tax Law § 305(2); TENNY, 37 N.Y.2d at 22.
- [28] See generally, N.Y. Real Prop. Tax Law § 1805.
- [29] N.Y. Real Prop. Tax Law § 1805(1).
- [30] N.Y. Real Prop. Tax Law § 1805(2).
- [31] N.Y. Real Prop. Tax Law § 1805(3).
- [32] Champeny, A. (2011). Stabilizing revenue collection during the downturn: How assessment phase ins and caps affect the city’s property tax. New York City Independent Budget Office. https://www.ibo.nyc.ny.us/iboreports/taxstability2102011.pdf
- [33] N.Y. Const. art. XVI § 1 (“Exemptions from taxation may be granted only by general laws.”).
- [34] E.g., § 425’s STAR and Enhanced STAR program provides an exemption for the principal residence of long-time homeowners meeting income requirements (that is more generous for low-income seniors), § 467 provides an exemption to very low-income seniors, § 459-c provides an exemption to disabled homeowners, and § 458-a/§ 458-b provides an exemption to certain veterans, and § 460 provides an exemption for members of the clergy. See N.Y. Real Prop. Tax Law §§ 425, 458-a, 458-b, 459-c, 460, 467.
- [35] E.g., § 485-x (successor to the 421-a program) provides a ten-to-forty-year exemption (depending on the property type and scale) for new multi-unit residential buildings that include affordable units, § 467-m provides an exemption for conversions from office to rental, and § 489 provides an exemption for residential rehabilitation. See N.Y. Real Prop. Tax Law §§ 467-m, 485-x, 489.
- [36] E.g., § 420-a/§ 420-b provides an exemption for properties used exclusively for religious, charitable, hospital, or educational purposes. See N.Y. Real Prop. Tax Law §§ 420-a, 420-b.
- [37] See generally, N.Y. Real Prop. Tax Law, art. 4.
- [38] E.g., § 467(1)(a)–(b), § 459-c(1)(a)–(b), and § 458-a(2)(d)(ii) give the City substantial discretion over certain exemptions for seniors, disabled persons, and veterans respectively. See N.Y. Real Prop. Tax Law §§ 458-a, 459-c, 467. § 458-x(9)(c)(viii), § 458-x(18), and 458-x(19) authorize the City’s Comptroller and Department of Housing Preservation and Development to make certain rules related to the program’s eligibility requirements and broader administration. See N.Y. Real Prop. Tax Law § 458-x. The most well-known example of a residential tax exemption program is the 421-a tax exemption program that was recently redesigned and renamed 485-x. This exemption aims to incentivize the development of new residential rental properties by lowering their tax burden. More recent versions of 421-a and 485-x also require the inclusion of income-restricted units.
- [39] Champeny, A. (2011). New York City Independent Budget Office. (2011). Stabilizing revenue collection during the downturn: How assessment phase ins and caps affect the city’s property tax. New York City Independent Budget Office. https://www.ibo.nyc.ny.us/iboreports/taxstability2102011.pdf
- [40] City Council is responsible for approving these tax rates, but the calculation is mechanical, and DOF is authorized to proceed if City Council hasn’t approved them by June 5th. New York City Charter § 1516(a).
- [41] New York City Department of Finance. (2018). New York City Property Tax System Background. https://www.nyc.gov/assets/propertytaxreform/downloads/pdf/RPT-Overview-for-Commission-2018-07-20.pdf
- [42] N.Y. Const. art. VIII § 10(e). Per the State Board of Real Property Services, “[t]he basic rule of law is that “[t]he ‘market value of real property is the amount which one desiring but not compelled to purchase will pay under ordinary conditions to a seller who desires but is not compelled to sell’ [citations omitted]” (W.T. Grant Co. v. Srogi, 52 N.Y.2d 496, 510, 420 N.E.2d 953, 438 N.Y.S.2d 761, 767 (1981); see also, Parklin Operating Corp. v. Miller, 287 N.Y. 126, 38 N.E.2d 465 (1941)).” Opinions of Counsel State Board of Real Property Services, No. 34 (available at https://www.tax.ny.gov/pubs_and_bulls/orpts/legal_opinions/v10/34.html)
- [43] N.Y. Real Prop. Tax Law § 1801(k) (pegging the local base proportion to assessment rolls completed in 1990, which provides 1989 valuations). Note that, while the legislation laid out a process for regularly updating the shares from the 1989 baseline valuations, adjustments to shares have not effectively changed the dynamic of assigned class shares since the law passed.
- [44] See N.Y. Comp. Codes R. & Regs. tit. 20, §§ 8186-9.3, 8186-9.5 (together directing the “legislative body of each special assessing unit”, of which NYC is one, to calculate the “current percentage,” “base percentage,” “current base proportion,” and “adjusted base proportion” used to determine the current class share). These calculations are subject to the rules and regulations prescribed by the state’s commissioner of the Department of Taxation and Finance, including that the local legislative body can establish its own procedure for calculating the adjusted base proportion,subject to approval by the Office of Real Property Tax Services. In practice, the City Council delegates these calculations to the City’s Department of Finance, but it nonetheless bears ultimate statutory responsibility for the calculations.
- [45] This calculation is carried out through a series of steps. First, the City Council calculates the “base percentage” for each class. N.Y. Real Prop. Tax Law § 1803-a(2)(a). This is approximately the class’s share of total taxable market value in 1989, adjusted for changes in parcels’ class designations. More technically, that market value is estimated as the class’s 1989 total taxable assessed value divided by the class’s 1989 state equalization rate, adjusted for class changes. Id.; N.Y. Comp. Codes R. & Regs. tit. 20, § 8186-9.3(a). The equalization rate is calculated as assessed value divided by full market value. N.Y. Real Prop. Tax Law § 102(19). As a result, the base percentage doesn’t quite reflect full market value but rather (adjusted) market value less grossed up exemptions (informally, the ‘adjusted taxable market value’). Second, the City Council calculates the “current percentage” for each class, following the same logic as above, but using the current year’s total taxable assessed value and equalization rate, with no necessary adjustments. N.Y. Real Prop. Tax Law § 1803-a(2)(b). Third, the City Council calculates the “current base proportion” for each class. N.Y. Real Prop. Tax Law § 1803-a(1)(b). This is approximately a class’s 1989 class share (of the levy, not of the total market value), adjusted in proportion to its total market value appreciation relative to the other classes. More technically, it is the 1989 class share (the “local base proportion”) multiplied by the class’s percent increase in total adjusted taxable market value (as measured by the ratio of the current percentage to base percentage), normalized across classes to 1 (i.e., the class’s relative appreciation in adjusted taxable market value). Id.; N.Y. Comp. Codes R. & Regs. tit. 20, § 8186-9.3(c). Fourth, the City Council calculates the “adjusted base proportion” for each class. N.Y. Real Prop. Tax Law § 1803-a(5). This is the current base proportion adjusted to reflect additions or removals of property from the tax rolls or changes in class designations occurring after the adoption of state equalization rates. Id. It appears to be intended to capture adjustments that would have been made in the calculation of the current and base percentages, but were not because the changes occurred after the adoption of the year’s equalization rates. Department of Finance and Taxation regulations provide a default for calculating these adjustments, but authorize the City Council to override this default, subject to ORPTS approval. N.Y. Comp. Codes R. & Regs. tit. 20, § 8186-9.3(c). These adjusted base proportions are the final class shares that represent the fraction of the levy the class will be responsible for raising.
- [46] The City Council’s primary discretion is in its ability to prescribe procedures for distinguishing changes in a class’s total market value that are due to appreciation rather than physical or quantity changes. N.Y. Comp. Codes R. & Regs. tit. 20, § 8186-9.5(b).
- [47] N.Y. Real Prop. Tax Code § 1803-a(1)(c).
- [48] See N.Y. Real Prop. Tax Law § 1801(d)–(nn) (capping class share percent increases for specified years). See also, Williams, B. M. (2025). Proposed Albany bill would let NYC choose a lower class-share cap for FY 2026. New York City Independent Budget Office. (n.d.). Property tax burden shifts: Where does the buck stop? https://www.ibo.nyc.ny.us/newsfax/proptaxshifts.html.
- [49] See, e.g., Rosenberg & Estis, P.C. (2025). Proposed Albany bill would let NYC choose a lower class-share cap for FY 2026. https://www.rosenbergestis.com/media/blog/nyc-property-tax/proposed-albany-bill-would-let-nyc-choose-a-lower-classshare-cap-for-fy-2026.
- [50] New York City Department of Finance. (2018). New York City property tax system background 10. https://www.nyc.gov/assets/propertytaxreform/downloads/pdf/RPT-Overview-for-Commission-2018-07-20.pdf
- [51] See, e.g., § 467-a (providing an abatement for keeping a condo or coop as a primary residence), § 489 (providing an abatement for the J-51 rehabilitation program), § 489-aaaaaa (providing an abatement for industrial and commercial property), and § 499 (providing various ‘green’ and revitalization abatements). See N.Y. Real Prop. Tax Law §§ 467-a, 489-aaaaaa, 499.
- [52] E.g., § 489 gives the City Council significant discretion over whether to implement a J-51 program, which buildings and types of rehabilitation qualify, which agencies implement it, how generous it is, and what conditions attach to its receipt. See N.Y. Real Prop. Tax Law § 489.
- [53] New York City Department of Finance. (n.d.). Cooperative and condominium property tax abatement. https://www.nyc.gov/site/finance/property/landlords-coop-condo.page
- [54] NYC can additionally impose a surcharge property tax on Class 1 properties receiving rental income that are not used as a primary residence. See N.Y. Real Prop. Tax Law § 307-a(3)–(5).