
Legacy 90%+ Properties
I. How could the current mass appraisal system deal with specific challenges associated with valuing buildings where 90 percent or more of the units are rent-stabilized?
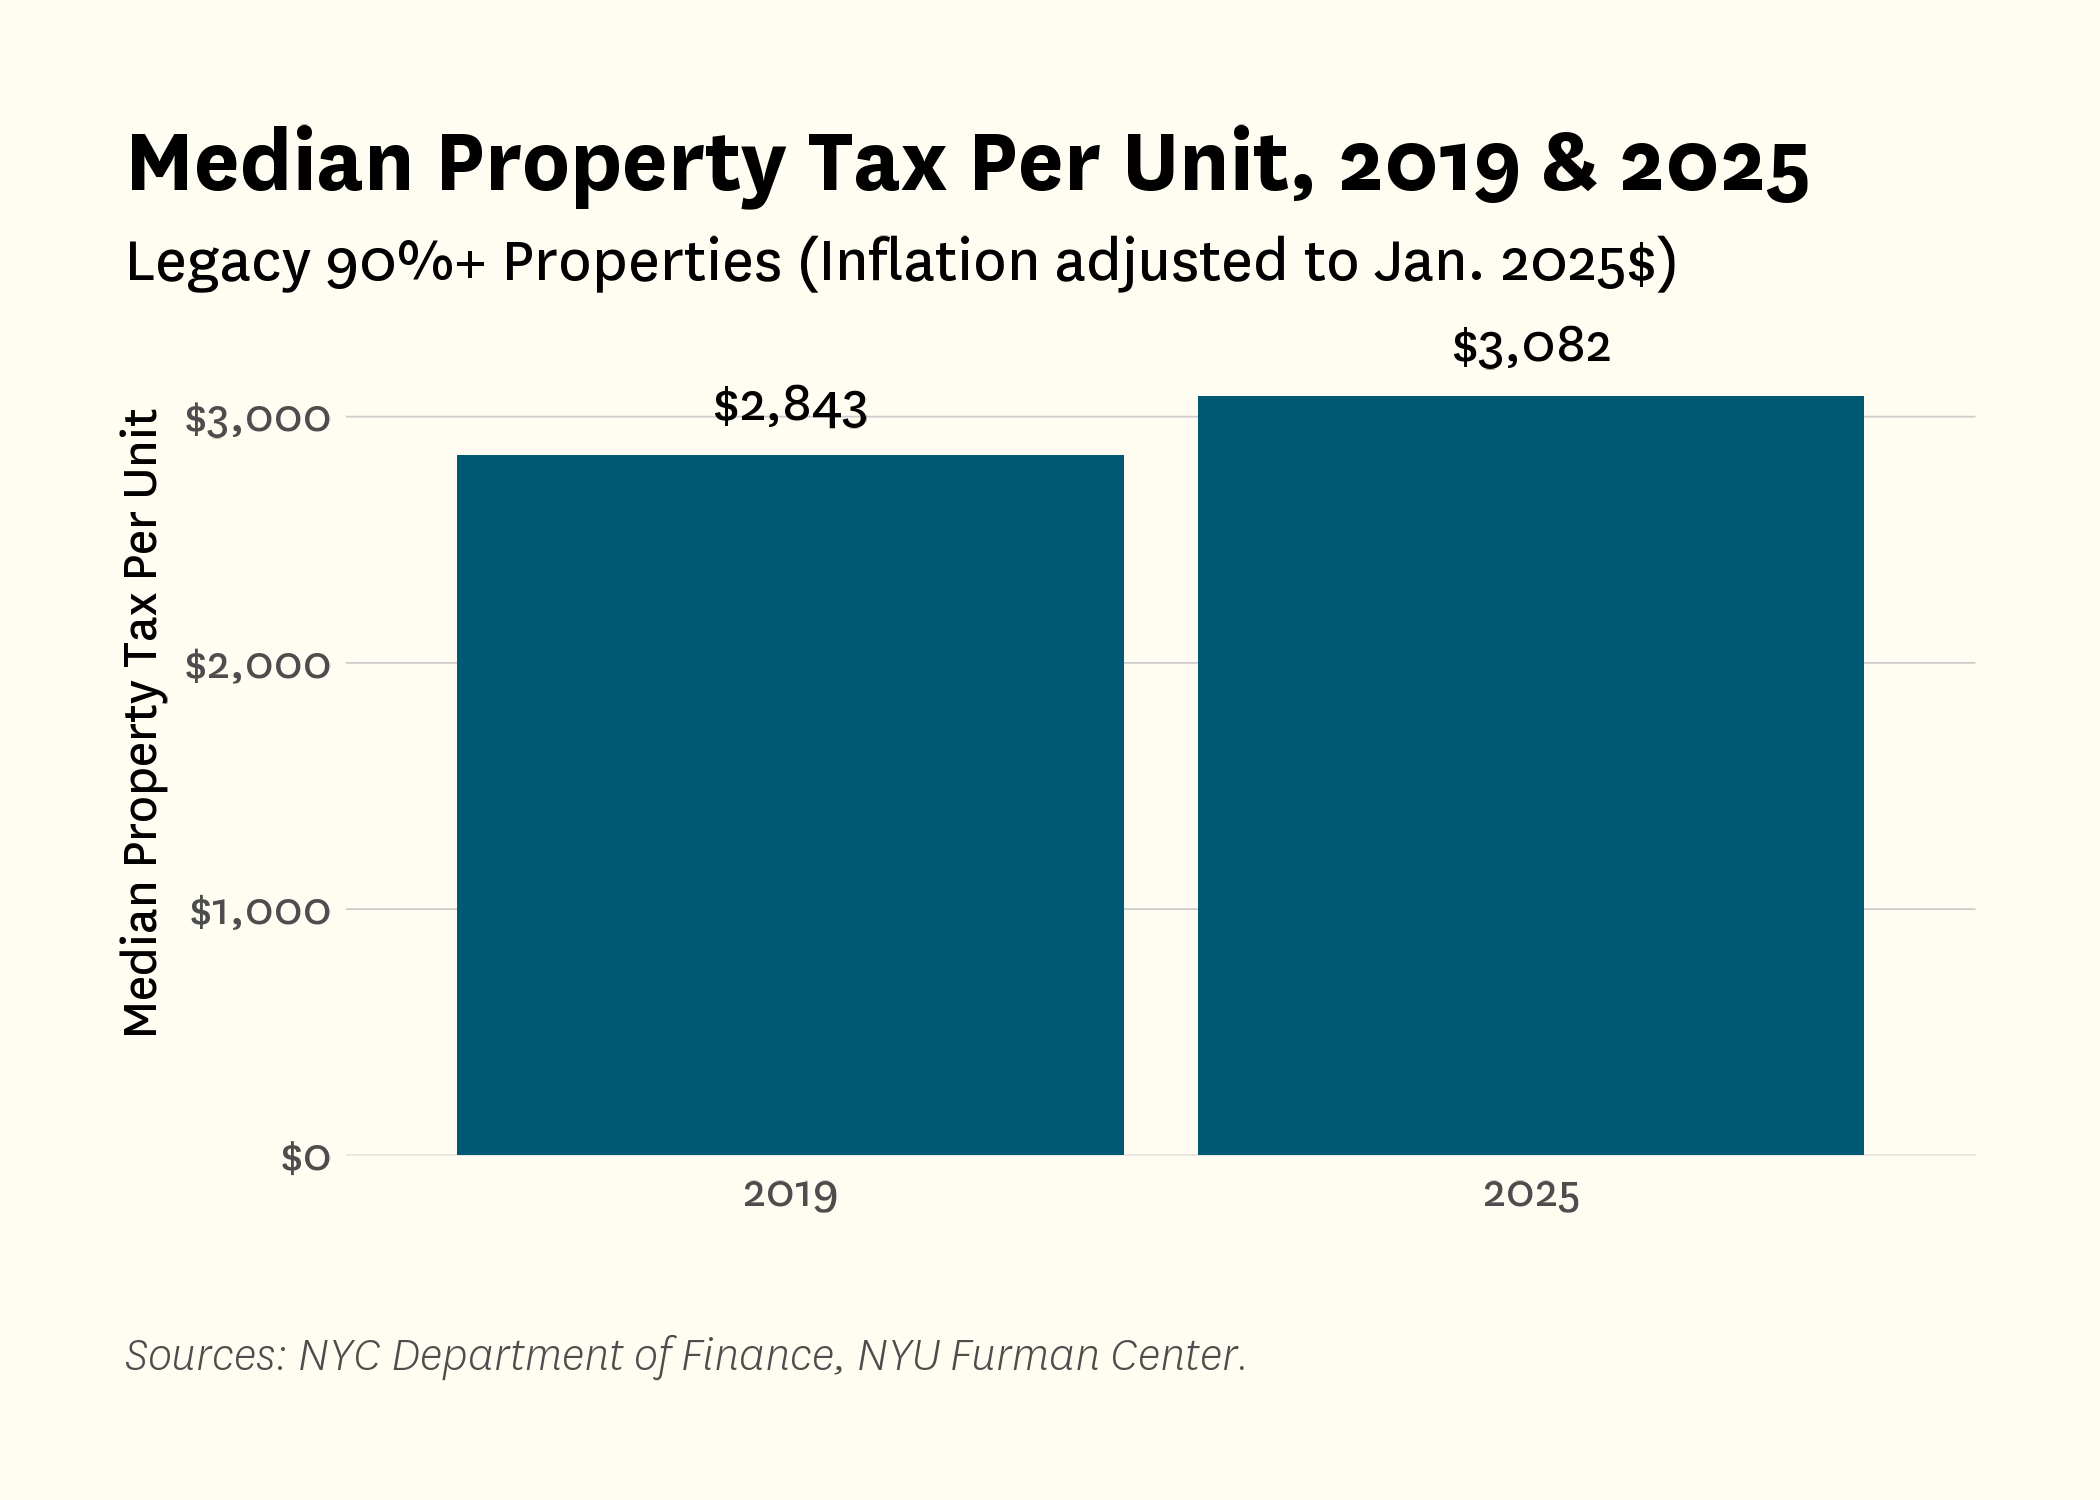
In this section, we highlight concerns about the Department of Finance’s (DOF) method of estimating the market value of older properties in which 90 percent or more of the units are rent stabilized.1 We find that property taxes for these buildings have increased faster than the rate of inflation, even though the net operating income of these buildings has been declining in real terms. The median per unit property tax bill for these units is $3,082 per year ($257 per month), and the total amount paid across 463,333 units is $1.5 billion.2 Property taxes represent a little more than a quarter of operating costs for legacy 90%+ properties3 and approximately 17 percent of their rental income.4
Our analysis reveals that DOF’s assessment guidelines, when using the income-based approach applied to rental buildings, leads to artificially high DOF market values for properties where rental income growth lags behind that of operating costs and inflation. We surface a number of steps that DOF could take to improve the precision of those valuations, including creating new categories and subcategories for 90 percent or more rent-stabilized buildings in the assessment guidelines. With finer categories, DOF will be able to right-size caps on the property-level ratio of expenses to incomes while also allowing certain properties in the rent-stabilized stock to exceed the caps (with sufficient documentation). DOF would also be able to right-size the capitalization rate (the expected rate of return based on the building’s revenue) to take into account declining actual sales values for many of these buildings regardless of the degree to which they are showing a decline in their net operating income.
Current Property Tax Burdens for the Rent-Stabilized Stock
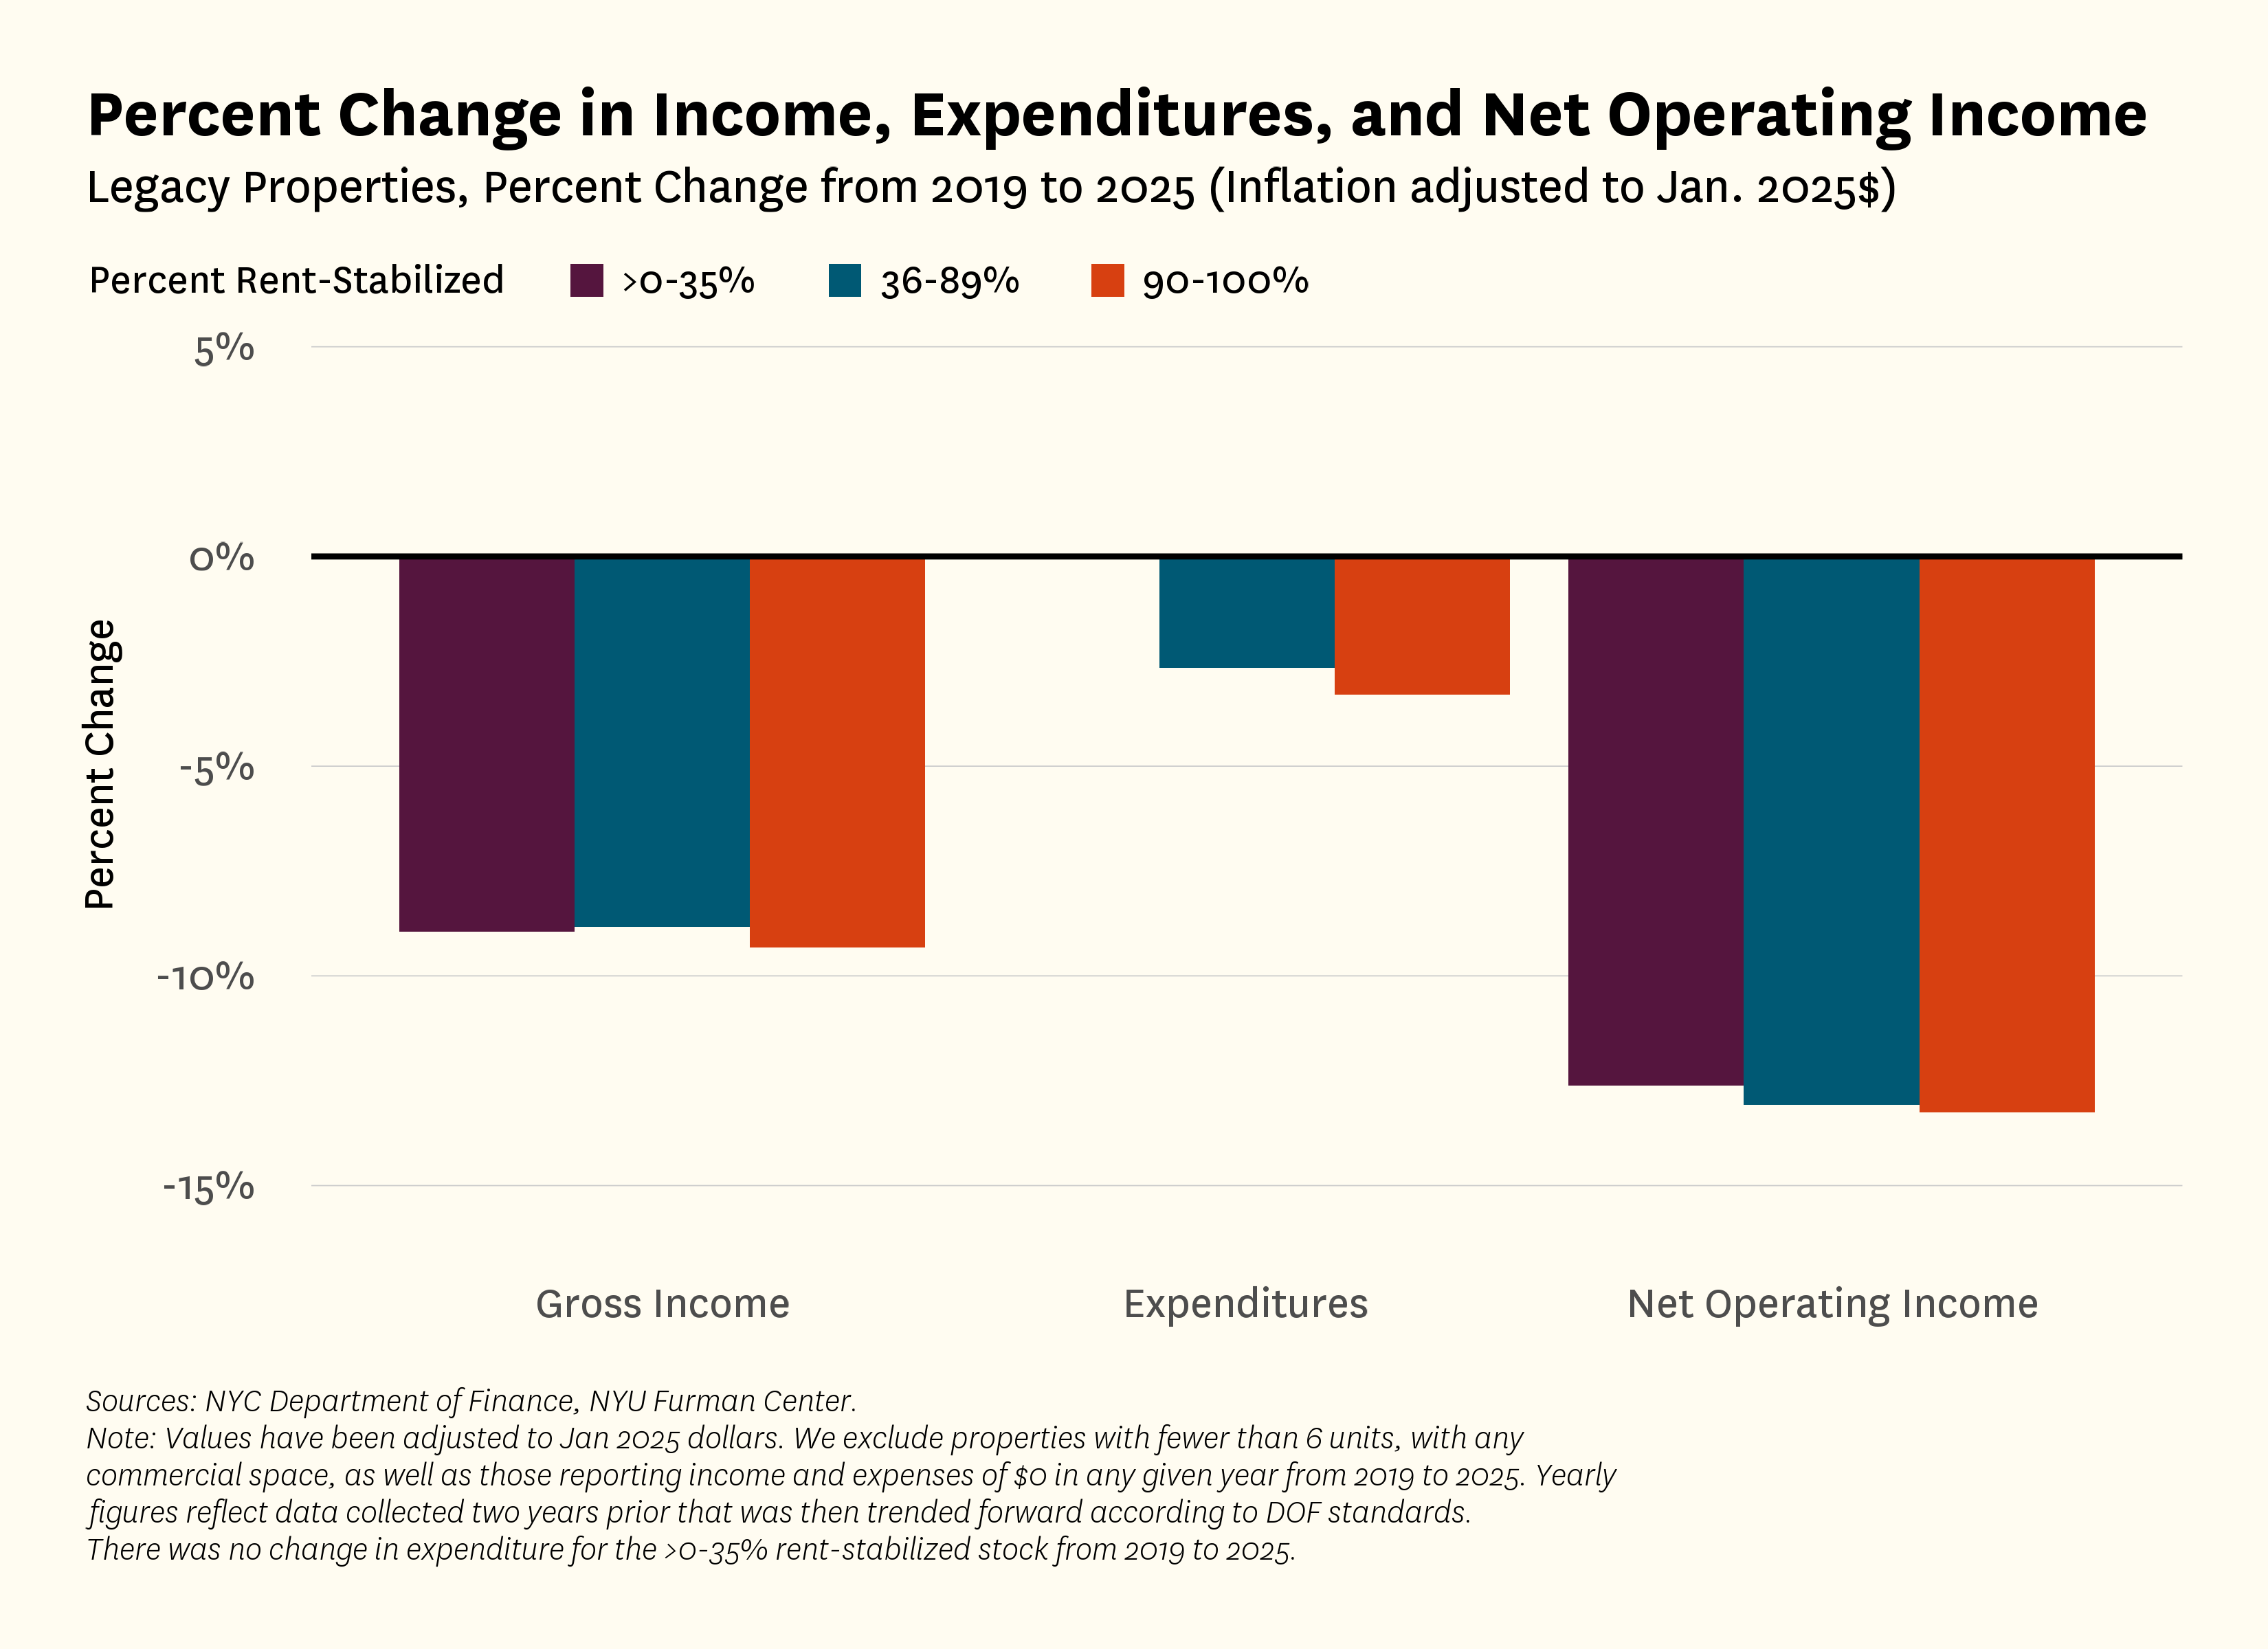
Pre-1974 properties in which 90 percent or more of the units are rent-stabilized saw real per-unit tax obligations rise slightly faster than inflation between 2019 and 2025 (Figure 1), despite real declines in net operating income during that same period (Figure 2).5 Because DOF uses an income capitalization-based approach to value these properties—which capitalizes the property’s adjusted net operating income (before property taxes) to generate a market value—we would expect that taxes would decline as market values decline and especially when net operating incomes decline.
Figure 1:
Over the same years, operating expenditures excluding taxes have remained roughly flat in real terms while gross income has declined, so these rising tax obligations further narrow the margin between income and total operating costs (Figure 2). That tightened margin implies that the resources available for maintenance, repairs, and day-to-day operations in these properties are increasingly limited.6
Figure 2:
Three elements of DOF’s assessment guidelines and its methodology for assessing the value of larger rental properties cause this distortion, particularly evident in 90%+ rent-stabilized properties. The three elements are limited mass appraisal categories, static expense-ratio caps, and the application of overly broad capitalization rates.
Mass Appraisal Categories
Mass appraisal categories are smoothing out variation in market values of larger rental buildings in ways that lead to inflated assessed values for 90%+ rent-stabilized buildings.
To estimate market values for larger rental properties, DOF relies on an expense ratio cap, a capitalization rate, and a vacancy rate cap that vary based on a property’s mass appraisal category. A property’s category is determined by a property’s location, regulated status, building type, and income. Individual properties are assigned to categories based on a range of factors:
- Location: DOF has separate categories for Manhattan and the outer boroughs;
- Regulated vs. Unregulated: DOF assigns properties to categories based on whether 50 percent or more of the units in the property are regulated or unregulated;
- Building Type: DOF distinguishes buildings based on whether they are walk-ups, pre-1974 elevator buildings, and post-1974 elevator buildings.7
- Income Percentiles: DOF distinguishes between buildings based on income by splitting out buildings by quartile based on the buildings’ gross income per square foot.
DOF then sets expense ratio caps, vacancy rate caps, and capitalization rates for each category after modeling how actual values have changed in each category and reviewing RPIE filings.
Figure 3:
Source: New York City Department of Finance. (2026). FY 2027 Guidelines for properties valued based on the income approach, including office buildings, retail, and residential properties. https://www.nyc.gov/site/finance/property/fy27-assessment-guidelines.page#
The current set of categories DOF uses obscures the financial status of legacy 90%+ properties, including those in upper Manhattan, that are struggling financially.8 Indeed, the 90 percent rent-stabilized building in upper Manhattan, for example, that is in the fourth percentile in terms of gross income per square foot may be in the same category as a 50 percent rent-stabilized building that is in the 24th percentile in terms of income and that is located in core Manhattan. As a result, DOF’s calculation of capitalization rates, expense ratio caps, and vacancy rate caps will reflect the average conditions across the broader base of buildings, including buildings where values tend to be much higher.
To address variation between categories of larger rental properties, DOF should create a 90%+ category with subcategories based on gross income per square foot and consider property location differently.
To better reflect variation in net operating income among larger rental properties, DOF should create a distinct 90 percent or more rent-stabilized category, rather than grouping these buildings within the broader 50 percent or more rent-stabilized category. Within that category, DOF would also establish subcategories based on buildings’ income levels (low, median, and high). For example, the properties in a 90 percent or more rent-stabilized category would have three subcategories based on income. The lowest-income subcategory, at the 25th percentile and below, would have monthly imputed rents of $1,161, while the properties at the 50th percentile would have monthly imputed rents of $1,344 and at the 75th percentile they would have monthly imputed rents of $1,512.
New subcategories should also more precisely account for location. In particular, Manhattan should be evaluated with greater geographic specificity, distinguishing upper Manhattan from the rest of the borough. The majority of legacy 90%+ properties in Manhattan are concentrated in Washington Heights/Inwood (Figure 4). Those properties are likely performing quite differently from properties in core Manhattan.
To address this issue, more granular subcategories, such as creating a “Core Manhattan” category for properties south of 96th Street and then an “Other” category for all other properties, may be more appropriate. Relying on broad borough-level groupings to set capitalization rates and other assessment inputs can mask meaningful differences across neighborhoods and lead to less accurate valuations.
Figure 4:
Static Expense Ratio Caps
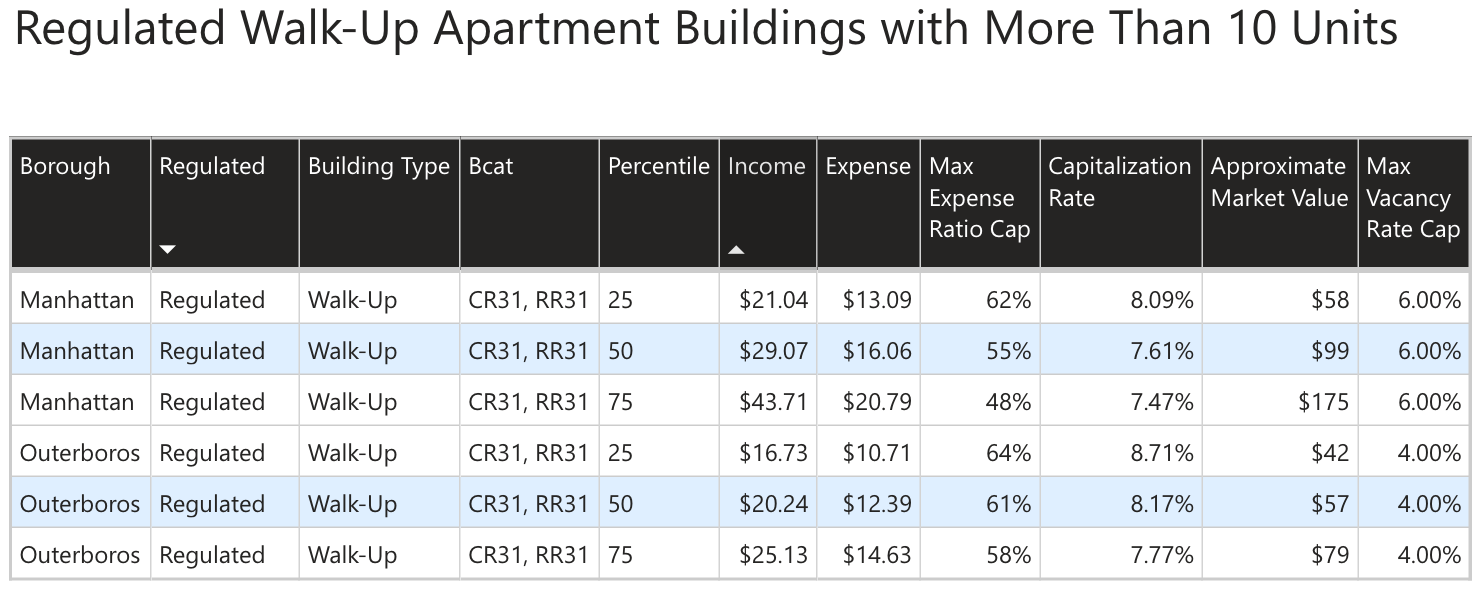
Under its assessment guidelines, DOF caps the ratio of expenses to income that an owner can claim (as noted earlier, rental properties are assessed on the basis of information owners provide in a Real Property Income and Expense (RPIE) report each year). DOF sets expense ratio caps for each subcategory of larger rental buildings, based on properties’ borough, rent regulation status, building type, and other characteristics.9 Figure 3, above, shows the expense ratio caps DOF currently applies to some regulated buildings.
For example, because of the expense ratio caps, if a landlord submits an RPIE that claims their regulated, walk-up Bronx building has an income of $100,000 and $80,000 in expenses and DOF applies an expense ratio cap of 64 percent, the cap will limit the building’s expenses to $64,000. DOF then assesses the market value for that property using that lower-than-reported expense amount and the now higher figure for net operating income.
DOF establishes the maximum expense ratio cap to guard against owners who file what DOF views to be unreasonably high expenses and/or low incomes benefiting from the production of outlier submissions which would otherwise translate into lower market values and, by extension, a lower property tax bill. Because the Rent Guidelines Board has allowed modest rent increases in recent years, even as some expenses have increased substantially, the range of expense ratios for the 90%+ rent-stabilized buildings may very well have increased. The existing caps, therefore, may be suppressing expenses that are legitimate rather than outliers.
Indeed, when we compared the distribution of expense ratios after the cap is applied among legacy 90%+ rent-stabilized buildings as a whole in 2019 (Figure 5) with the distribution for those same buildings’ expense ratios after the cap is applied six years later in 2026 (Figure 6) we confirmed that hypothesis. In 2019, the cap affected fewer properties, and the bell-shaped distribution of expense ratios suggests that the ratios were just limiting extreme outliers. However, by 2026, both the mean and median of the distribution in expense ratios after application of the caps had increased, even though the caps had not changed. In addition, there was a sharp drop-off in the distribution at around 64 percent in 2026. The distribution shows a cliff rather than a bell-shaped curve, suggesting that the expense ratio cap is affecting buildings that are not, in fact, outliers.
Figure 5:
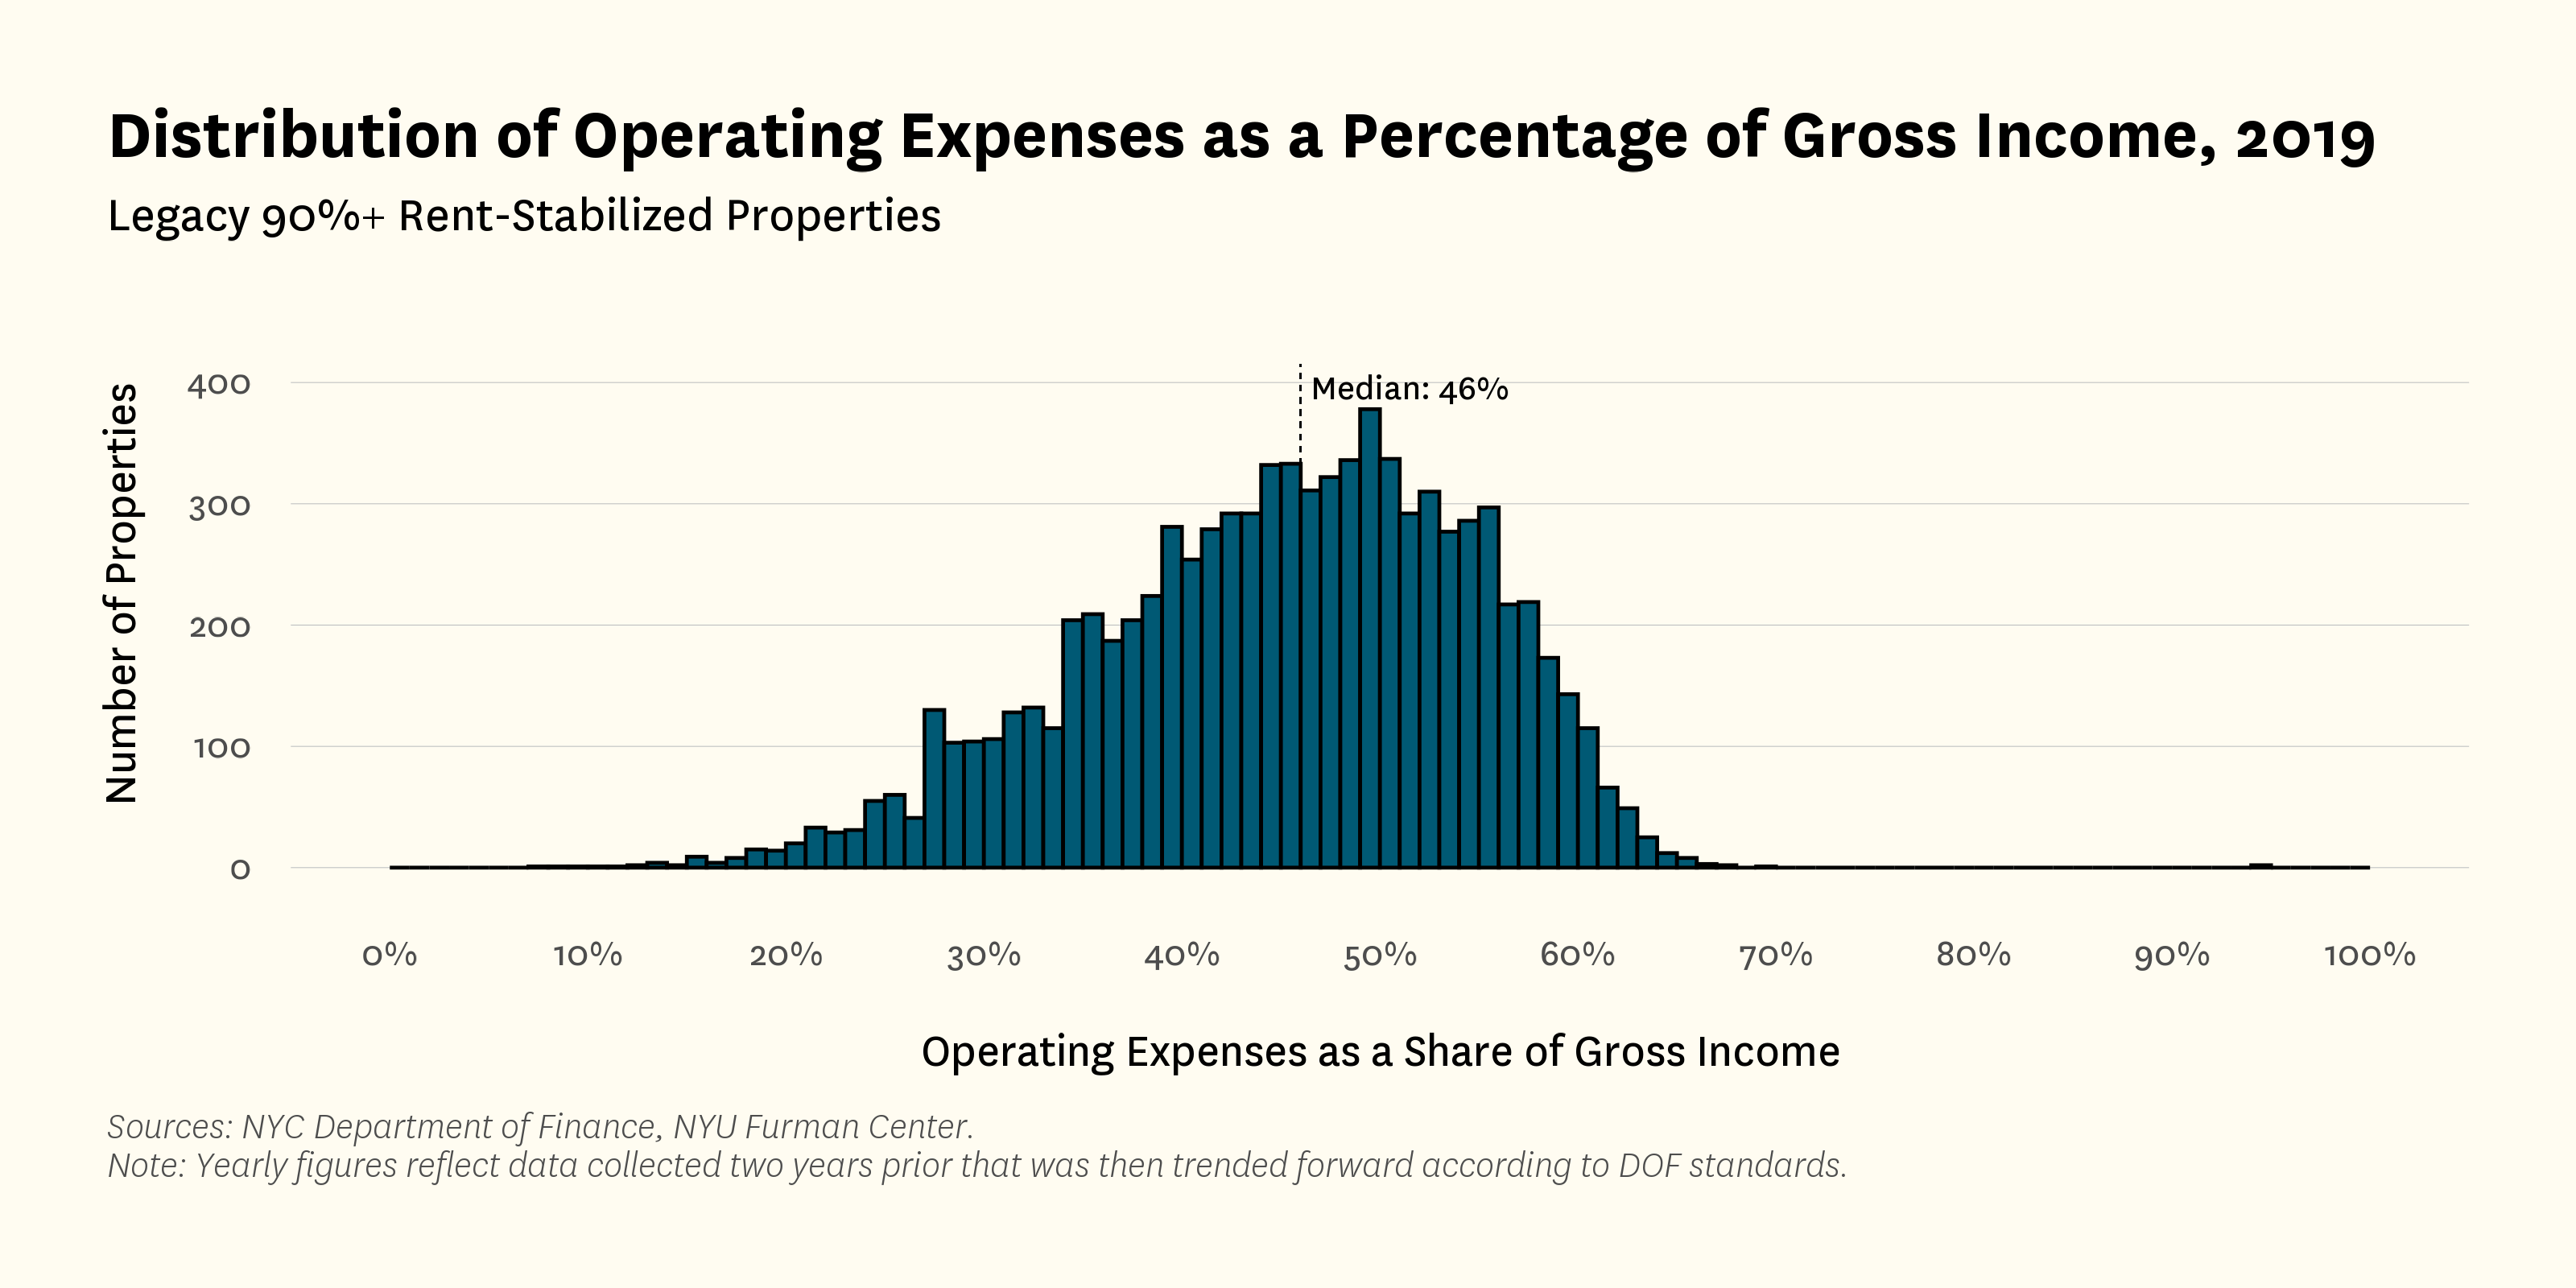
Figure 6:
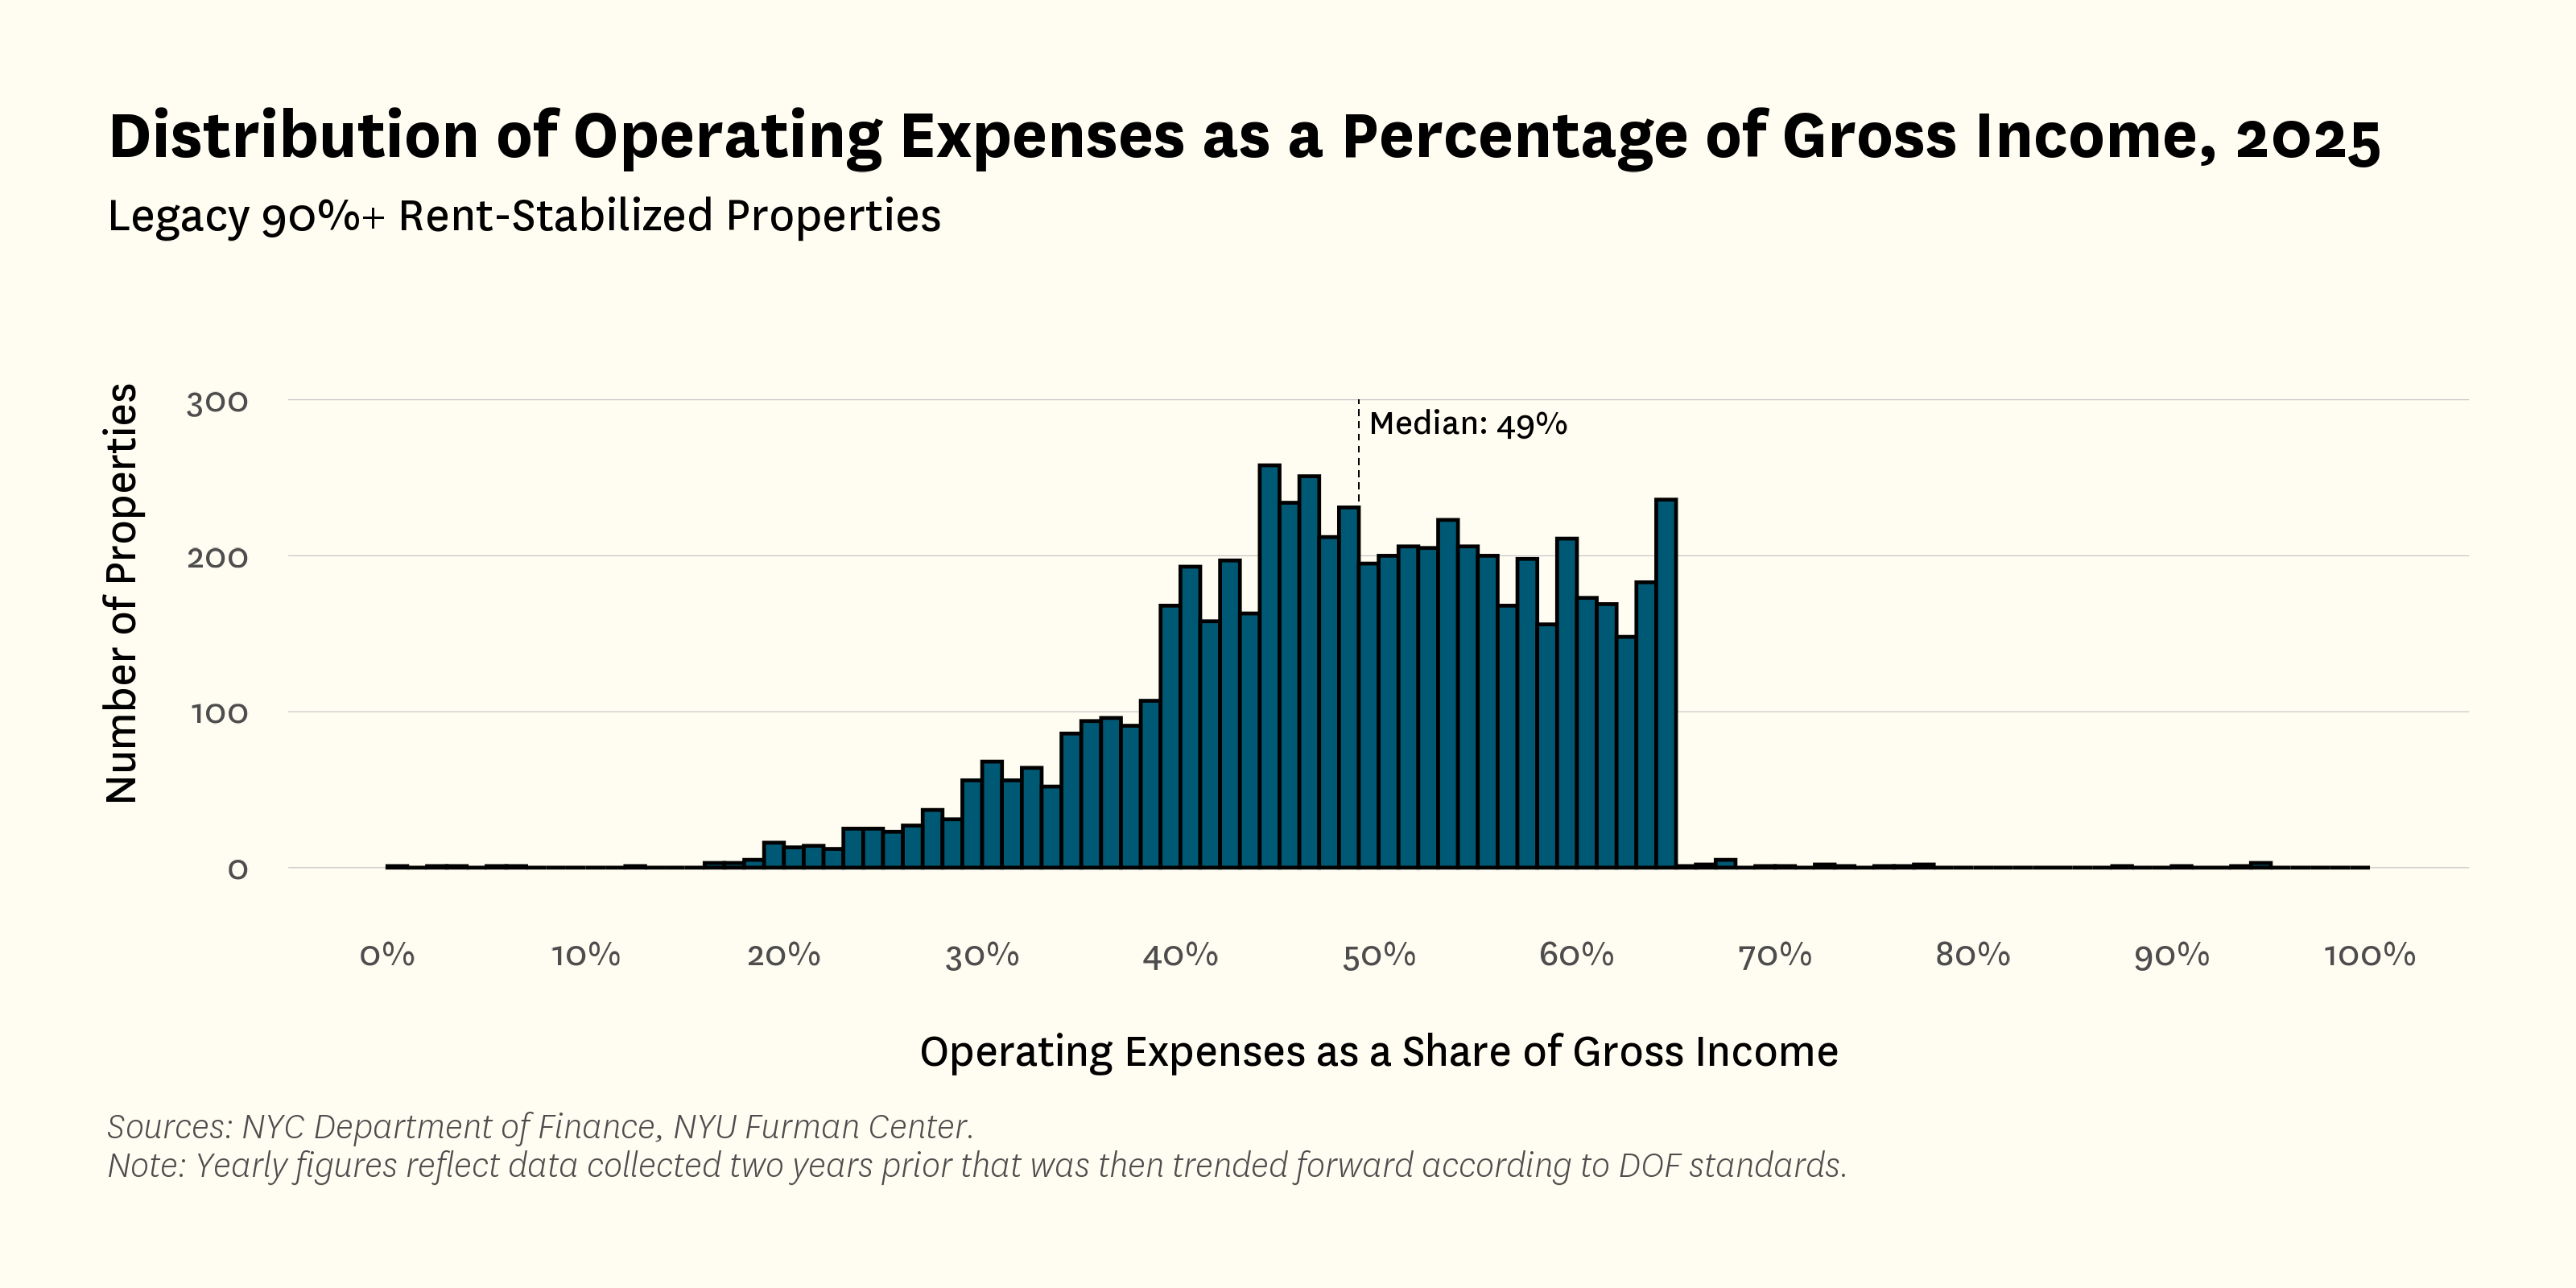
If DOF’s cap is affecting buildings that are justified in reporting higher expenses or lower incomes, then it seems inappropriate to treat them as if they were outliers and attribute to them a higher net operating income than the owners report. This artificially increases DOF’s measure of net operating income, which then inflates DOF’s estimates of market values, leading to a higher tax bill for those properties.
To avoid artificially inflated assessments for this subsegment of buildings, the expense ratio cap should be adjusted periodically to ensure that it only capture outliers in that subcategory of buildings, and even then DOF should allow 90%+ rent-stabilized properties to exceed the new cap with sufficient documentation.
DOF originally set expense ratio caps at a level where no more than 10 percent of buildings exceeded the cap, treating those properties as outliers. In 2024, however, across all categories, more than 20 percent (and in the boroughs other than Manhattan, more than 25 percent) of the legacy 90%+ rent-stabilized buildings exceeded the 64 percent expense ratio cap.10 In other words, the cap now applies to a substantial share of properties rather than just the outliers. For these properties, the cap leads to an inflated assessed value and higher property tax liabilities. To better align the cap with its original intent, DOF could apply it only to the buildings with the highest expense ratio by setting the threshold at the 90th percentile each year.
State law provides an alternative pathway. Under New York Real Property Tax Law (RPT) § 581-a, DOF must use the actual reported income and expenses from the RPIE to appraise properties subject to regulatory agreements that restrict incomes for at least 20 percent of units.11 Those buildings are not subject to expense ratio caps, in recognition of the fact that expenses may be increasing while incomes are restrained by the terms of the regulatory agreement.
A similar approach could be extended to certain rent-stabilized properties. For example, 90%+ rent-stabilized buildings with building-wide rents below the median monthly rent12 are constrained from having incomes increase under state law, even though their expenses have been rising. Allowing these rent-stabilized buildings to exceed the cap, with sufficient documentation, would prevent the cap from artificially inflating their assessed values, because DOF would rely on the owner’s reported RPIE data when estimating market values, rather than adjusting the numbers to conform to its cap. Because these properties are not exempt from taxation (unlike subsidized buildings), DOF might require additional documentation to prevent fraud.
Capitalization Rates
Finally, DOF estimates a property’s market value by dividing its net income by the capitalization rate. Capitalization rates (or “cap” rates) measure the expected rate of return on an investment property. Holding everything else constant, a lower cap rate will result in a higher estimated market value. The value of properties where more than 90 percent of the units are rent-stabilized has dropped dramatically in recent years, with the median sales price per square foot dropping to 2011 levels from a high in 2018 in inflation-adjusted terms. Annual sales volumes have remained below prepandemic levels.13
At the same time, DOF’s capitalization rates for these properties have stayed relatively stable, rather than rising in response to declining property values. For example, in fiscal year 2020, DOF’s assessment capitalization rates for regulated pre-1973 rental elevator buildings in the outer boroughs ranged from 7.62 to 8.99 percent.14 In the fiscal year 2027 assessment guidelines, the rates for the same category had barely changed, ranging from 7.95 to 8.93 percent.15 If DOF had a finer category of 90 percent or more rent-stabilized properties, it could set a cap rate that aligns more closely with changes in value that have specifically impacted the market for these properties.
a. Key Takeaways
Our analysis suggests that there is a need and pathway to better align the market values for older, low-income 90%+ stabilized rental properties to reflect actual market prices.
Right-sizing property taxes for legacy 90%+ properties would help lower operating costs and help stabilize buildings experiencing slowing or stagnant rental income. Property taxes represent a little more than a quarter of operating costs for legacy 90%+ properties.16 While reducing tax burdens may be helpful as a part of a larger effort to solve the financial challenges faced by the regulated housing stock,17 it is not a panacea as long as rent increases continue to fall short of the growth in expenses and inflation.
We are unable to estimate how much the property taxes paid by that stock would be reduced if DOF follows our recommendations, including reforming the expense ratio cap and refining the categories of properties DOF uses to estimate market value. Decreases in property taxes resulting from these changes to the expense ratio caps and these categories, alone, might only be a small share of the $1.5 billion that owners pay in property taxes annually, and cannot reverse the long-term operating dynamics of these properties if allowed rent increases fall short of increase in operating costs and inflation. Still, improving the accuracy of the assessments would help preserve regulated rental properties.
II. Conclusion
New York City’s property tax system is infamously complicated. This report seeks to demystify how those taxes are calculated and to highlight the structural features of the system that create and compound disparities between different property types. Our analysis takes a close look at multifamily properties in the city, and highlights the role property valuation methodologies play in causing disparities between the effective tax rates of condos and coops and large rental buildings. We find that condos and coops are systematically undervalued relative to their sales value, and that disparity is particularly pronounced for the most expensive units.
By modeling a series of potential reforms to condos and coops, we illustrate the impact of valuing those properties based on sales rather than comparing them to rentals. Our models find that such changes could add additional revenue or be used to reduce disparities in tax rates between rental properties and coops and condos.
Finally, we examine how DOF could refine the valuation of legacy 90%+ rent-stabilized properties to right-size their values and tax burdens. Proposed changes here, including the creation of new categories within the assessment guidelines and changing the expense ratio caps and capitalization rates for these properties, are relatively modest and would not require legislative action, but would have an outsized impact on an important source of low-cost rental housing for New Yorkers.
The way property tax burdens are allocated has an impact on the feasibility of new rental housing development and on the ongoing operation of rental properties. Property tax rates (net of abatements and exemptions) for coop and condo properties are currently substantially lower than those for rental buildings. Bringing the effective tax rate for larger rental properties closer to that of condo and coop properties would make rentals a more competitive choice for new development and could ease operating pressures.
While there is limited research exploring whether savings from lowering property tax burdens on rental properties are passed onto renters in unregulated properties, reducing or restraining increases in this burden over time could incentivise new rental supply, which has been shown to help mitigate rent increases.18 For the rent-stabilized stock, the City could lower tax burdens and then pass that benefit on directly to the tenants by ensuring the rent guideline reflects that reduction in expenses.
Property taxes matter. They are ultimately paid by New Yorkers and they shape what gets built. Property taxes can either support or undermine efforts to preserve existing low-cost housing. We hope that this report sheds light not only on the impacts of New York City’s current property tax system, but also on opportunities for reform that could improve equity within and across the residential property tax classes.
Footnotes
- [1] About 40 percent of legacy 90%+ properties are smaller in size, with 6-10 units total. However, only 10 percent of units in the legacy 90%+ category are located in properties with less than 11 units.
- [2] Of the 463,333 units in these legacy 90%+ properties, 455,979 are rent stabilized.
- [3] Legacy 90%+ properties paid an average of $3.37 per square foot in property taxes and $9.18 per square foot in non-tax operating expenses, for total operating expenses of $12.55 per square foot. As a result, property taxes accounted for approximately 27 percent of total operating expenses for these properties. Figures calculated using 2025 NOPV data from the Department of Finance.
- [4] Legacy 90%+ properties had an average rental income of $19.99 per square foot and paid an average of $3.37 per square foot in property taxes. As a result, property taxes accounted for approximately 17 percent of rental income. Figures calculated using 2025 NOPV data from the Department of Finance.
- [5] New York University Furman Center. (2026). Data brief: Legacy 90%+ rent-stabilized properties. https://www.furmancenter.org/publication/data-brief-legacy-90-rent-stabilized-properties/
- [6] New York University Furman Center. (2026). Data brief: Legacy 90%+ rent-stabilized properties. https://www.furmancenter.org/publication/data-brief-legacy-90-rent-stabilized-properties/
- [7] Post-1973 properties are additionally categorized based on whether they were built before or after 2000. New York City Department of Finance. (2026). FY’ 2027 Guidelines for Properties Valued Based on the Income Approach, Including Office Buildings, Retail, and Residential Properties. https://www.nyc.gov/site/finance/property/fy27-assessment-guidelines.page#
- [8] New York University Furman Center. (2026). Data brief: Legacy 90%+ rent-stabilized properties. https://www.furmancenter.org/publication/data-brief-legacy-90-rent-stabilized-properties/
- [9] New York City Department of Finance. (2026). FY’ 2027 Guidelines for Properties Valued Based on the Income Approach, Including Office Buildings, Retail, and Residential Properties. https://www.nyc.gov/site/finance/property/fy27-assessment-guidelines.page#
- [10] More information on how the NYU Furman Center was able to make these estimates can be made available upon request via https://www.furmancenter.org/data-inquiries/.
- [11] N.Y. Real Prop. Tax Law § 581-a. See also New York City Department of Finance. (2026) RPIE – 2025 worksheet. https://www.nyc.gov/assets/finance/downloads/pdf/rpie/rpie-worksheet.pdf.
- [12] There are two reasons we suggest limiting this option to buildings with lower rents. These buildings tend to have tighter operating margins, especially where income is being constrained and expenses are increasing. These buildings are also a critical source of affordable housing.
- [13] New York University Furman Center. (2026). Data brief: Legacy 90%+ rent-stabilized properties. https://www.furmancenter.org/publication/data-brief-legacy-90-rent-stabilized-properties/
- [14] New York City Department of Finance. (2019). FY’ 2020 Guidelines for Properties Valued Based on the Income Approach, Including Office Buildings, Retail, and Residential Properties. https://www.nyc.gov/assets/finance/downloads/pdf/19pdf/fy2020_assessment_roll_guidelines_final.pdf
- [15] New York City Department of Finance. (2026). FY’ 2027 Guidelines for Properties Valued Based on the Income Approach, Including Office Buildings, Retail, and Residential Properties. https://www.nyc.gov/site/finance/property/fy27-assessment-guidelines.page#
- [16] Legacy 90%+ properties paid an average of $3.37 per square foot in property taxes and $9.18 per square foot in non-tax operating expenses, for total operating expenses of $12.55 per square foot. As a result, property taxes accounted for approximately 27 percent of total operating expenses for these properties. Figures calculated using 2025 NOPV data from the Department of Finance.
- [17] New York University Furman Center. (2026). NYC’s rent-stabilized housing: Understanding different segments of the stock and why it matters. https://www.furmancenter.org/collection/nycs-rent-stabilized-housing-understanding-different-segments-of-the-stock-and-why-it-matters/
- [18] Although the topic remains a subject of some debate, a number of recent papers have found evidence that at least some portion of increases in property taxes are passed on to renters, although the amount and timeline of the estimated pass-through varies. Baker (2025) examined this dynamic in Berkeley, California, where Proposition 13 limits property tax increases until a property is sold, at which point a building typically experiences a tax shock. She found that landlords passed $0.50-$0.89 of every dollar of that property tax increase to renters. Schwegman and Yinger’s (2020) analysis of within-unit variation over time in New York cities with tiered rental property tax systems suggested that property owners deflect only about 14 percent of a tax hike onto renters. Finally, Watson and Ziv (2024) estimated a pass-through rate in the New York City rental market of more than 100 percent, following idiosyncratic tax shocks. They also found that when DOF adjusted assessments for smaller buildings, a 45 percent reduction in property taxes led to a decrease in rents of 12 percent. The authors propose different mechanisms for passing through increases in property taxes to renters. Baker’s findings rely on landlords re-engaging with rents following a transaction-induced tax shock, while Watson and Ziv emphasize pricing power and market competition; this distinction may matter because a property tax reduction may not prompt the same behavioral response as an increase, particularly if landlords are less attentive to cost decreases than increases. See: Baker, S. (2025). Property tax pass-through to renters: A quasi-experimental approach (Working Paper No. 25-41). Federal Reserve Bank of Philadelphia. https://doi.org/10.21799/frbp.wp.2025.41; Schwegman, D. & Yinger, J. (2020). The shifting of the property tax on urban renters: Evidence from New York State’s homestead tax option (CES Working Paper No. 20-43). U.S. Census Bureau.https://www.census.gov/library/working-papers/2020/adrm/CES-WP-20-43.html; Watson, C. L. & Ziv, O. (2025). A test for pricing power in urban housing markets. Review of Economics and Statistics. 1-33. https://doi.org/10.1162/REST.a.1687