State of Homeowners and Their Homes
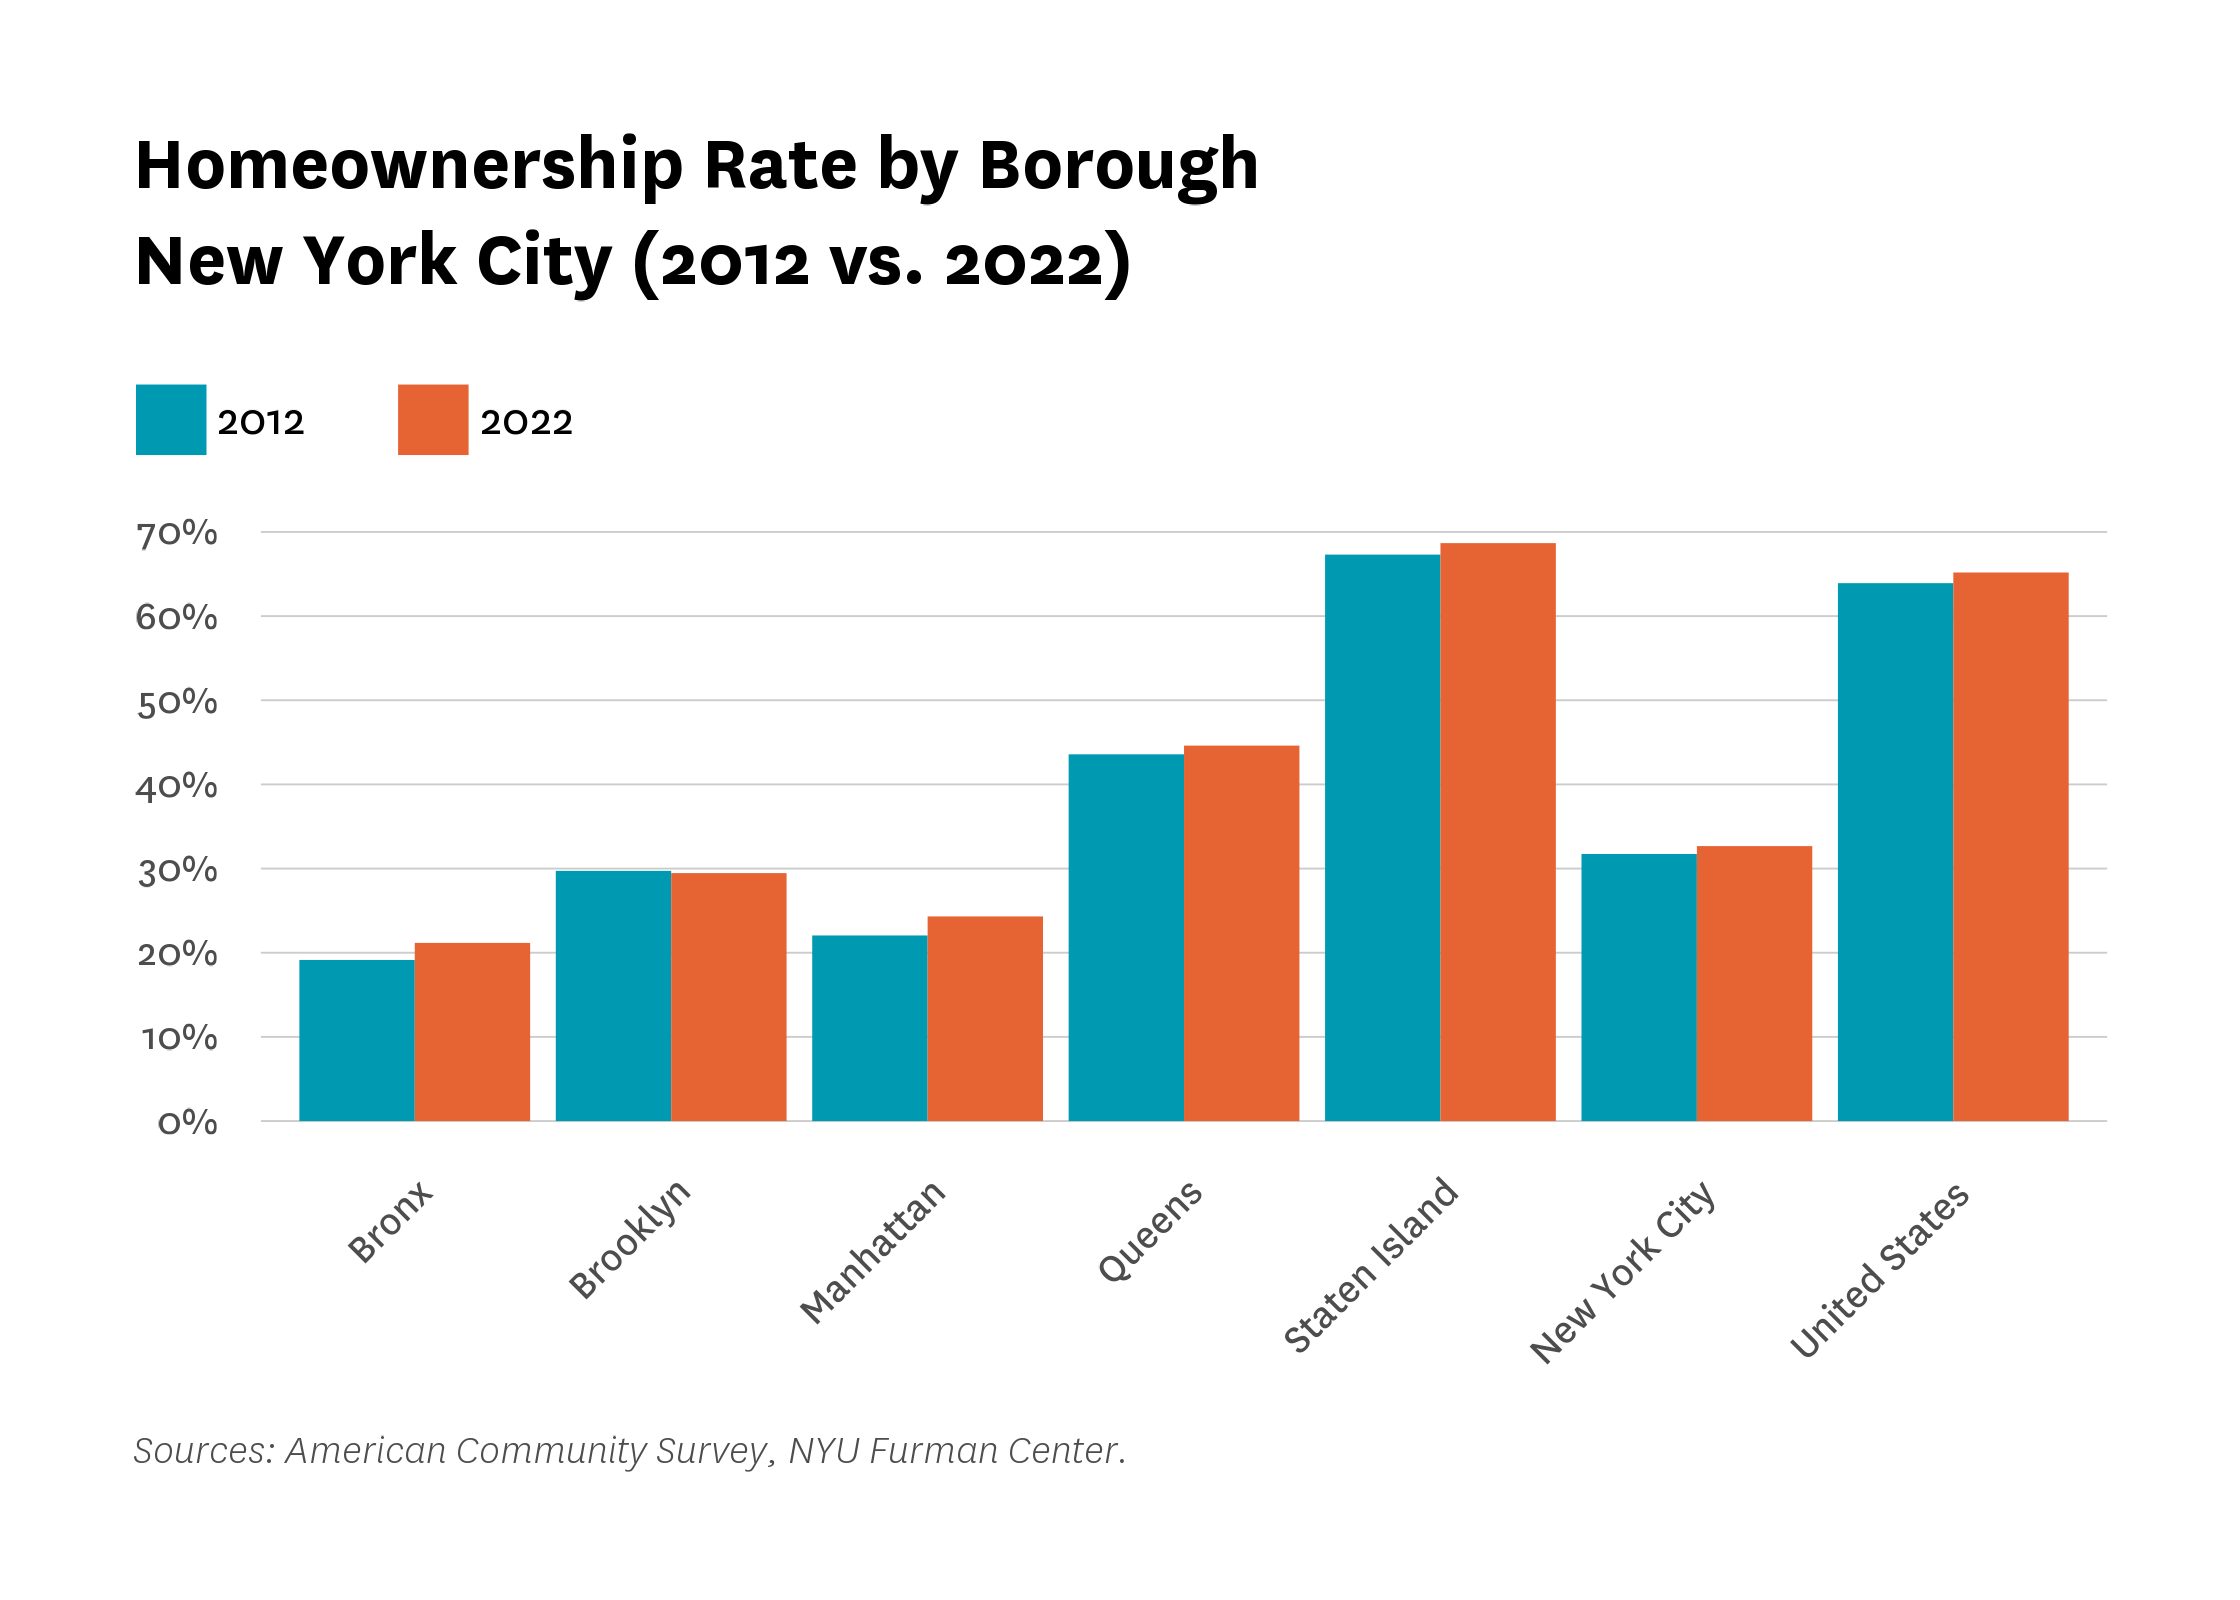
The homeownership rate in New York City increased modestly between 2012 and 2022, with a rise from 31.7 percent to 32.7 percent. This growth was evident in nearly all boroughs, with the most substantial gains in Manhattan and the least in Staten Island and Queens. Staten Island maintained the highest rate at 68.7%, significantly higher than other boroughs and the national rate of 65.2%. Homeownership disparities were pronounced across racial and ethnic groups, with the highest rates among Asian and white households and the lowest among Black and Hispanic households.The share of cost-burdened homeowners also decreased during this period. Home mortgage originations declined as interest rates rose: The interest rate on 30-year fixed-rate mortgages nationally was approximately 6.42 percent at the end of 2022, up from 3.11 percent at the end of 2021.1 Homeownership purchase originations decreased across all boroughs between 2021 and 2022, with the greatest decreases in Staten Island and Brooklyn. The rise in Interest rates spurred an even larger decline in mortgage refinancing across all boroughs, with the largest percent decreases seen among Asian and white borrowers. Finally, pre-foreclosure notices in one- to four-unit homes, condominiums, and cooperatives declined between 2022 to 2023, after having increased dramatically in the previous year.
Homeownership rates increased slightly in almost all boroughs from 2012 to 2022.
The homeownership rate in the city saw a slight increase, rising from 31.7 percent in 2012 to 32.7 percent in 2022, similar to a small bump in the national average over the same time period. Across four boroughs, the homeownership rate increased between a range of 1.04 and 2.26 percentage points over the same time period, with the largest increase in Manhattan and the smallest increases in Staten Island (1.4%) and Queens (1.0%). Out of all the boroughs, Staten Island had the highest homeownership rate at 68.7 percent. This is 3.5 percentage points higher than the national rate (65.2%), more than three times as high as the rate in the Bronx (21.2%), and over twice as high as the rates in Brooklyn (29.46%) and Manhattan (24.3%). Queens had the second-highest homeownership rate in the city at 44.6 percent.
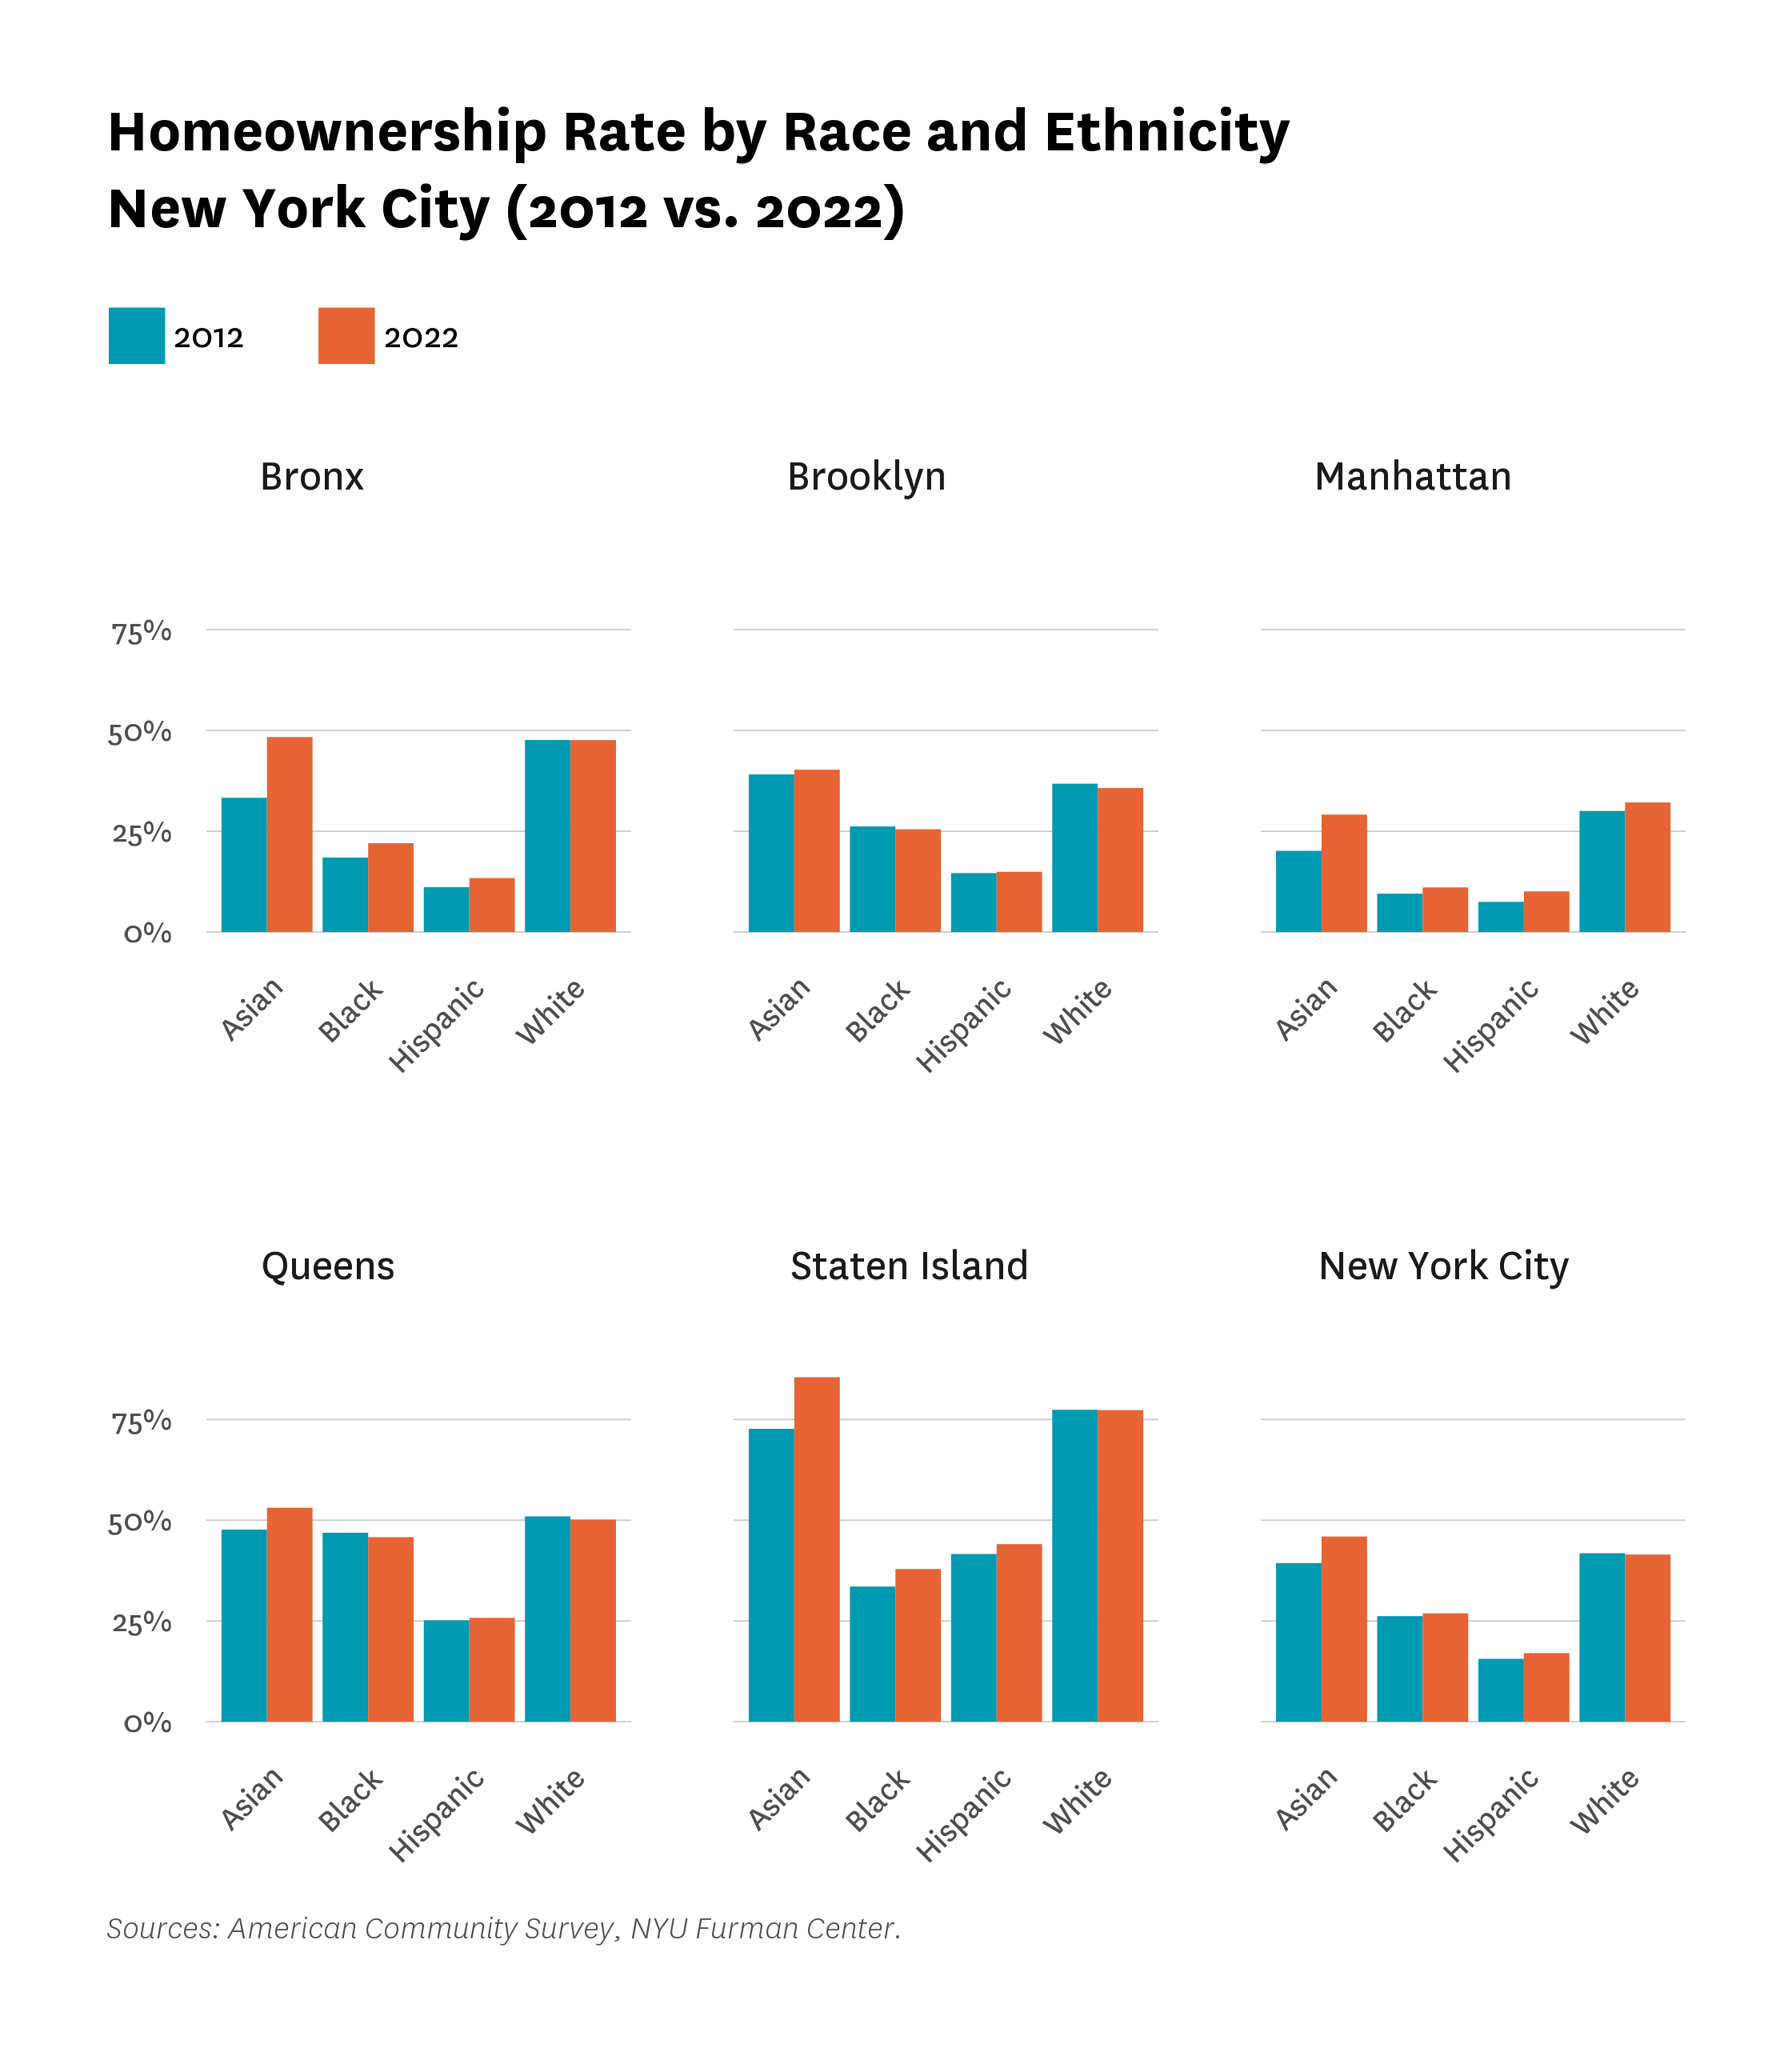
Across the city, homeownership rates were highest among Asian and white households, respectively, and lowest for Black and Hispanic households.
Asian households had the highest rate of homeownership at 46.0 percent, followed by white households at 41.5 percent. Black and Hispanic households had the lowest homeownership rates, at 26.9 percent and 17.0 percent, respectively. Staten Island showed the largest disparities in homeownership between groups. The homeownership rates of Asian and white households were 41.4 and 33.3 percentage points above that of Hispanic households, and 47.6 and 39.4 percentage points above Black households, respectively. In Queens, the difference in homeownership rates between Black and white households is much lower than in other boroughs. Notably, Asian households saw the largest increases in homeownership rates from 2012 to 2022 across all five boroughs among any racial/ethnic group. Homeownership rates decreased the most among white households, by 1.1 percentage points in Brooklyn and 0.8 percentage points in Queens between 2012 and 2022. Black households in Brooklyn and Queens were the only other group to experience a decline, by 0.7 and 1.1 percentage points respectively.
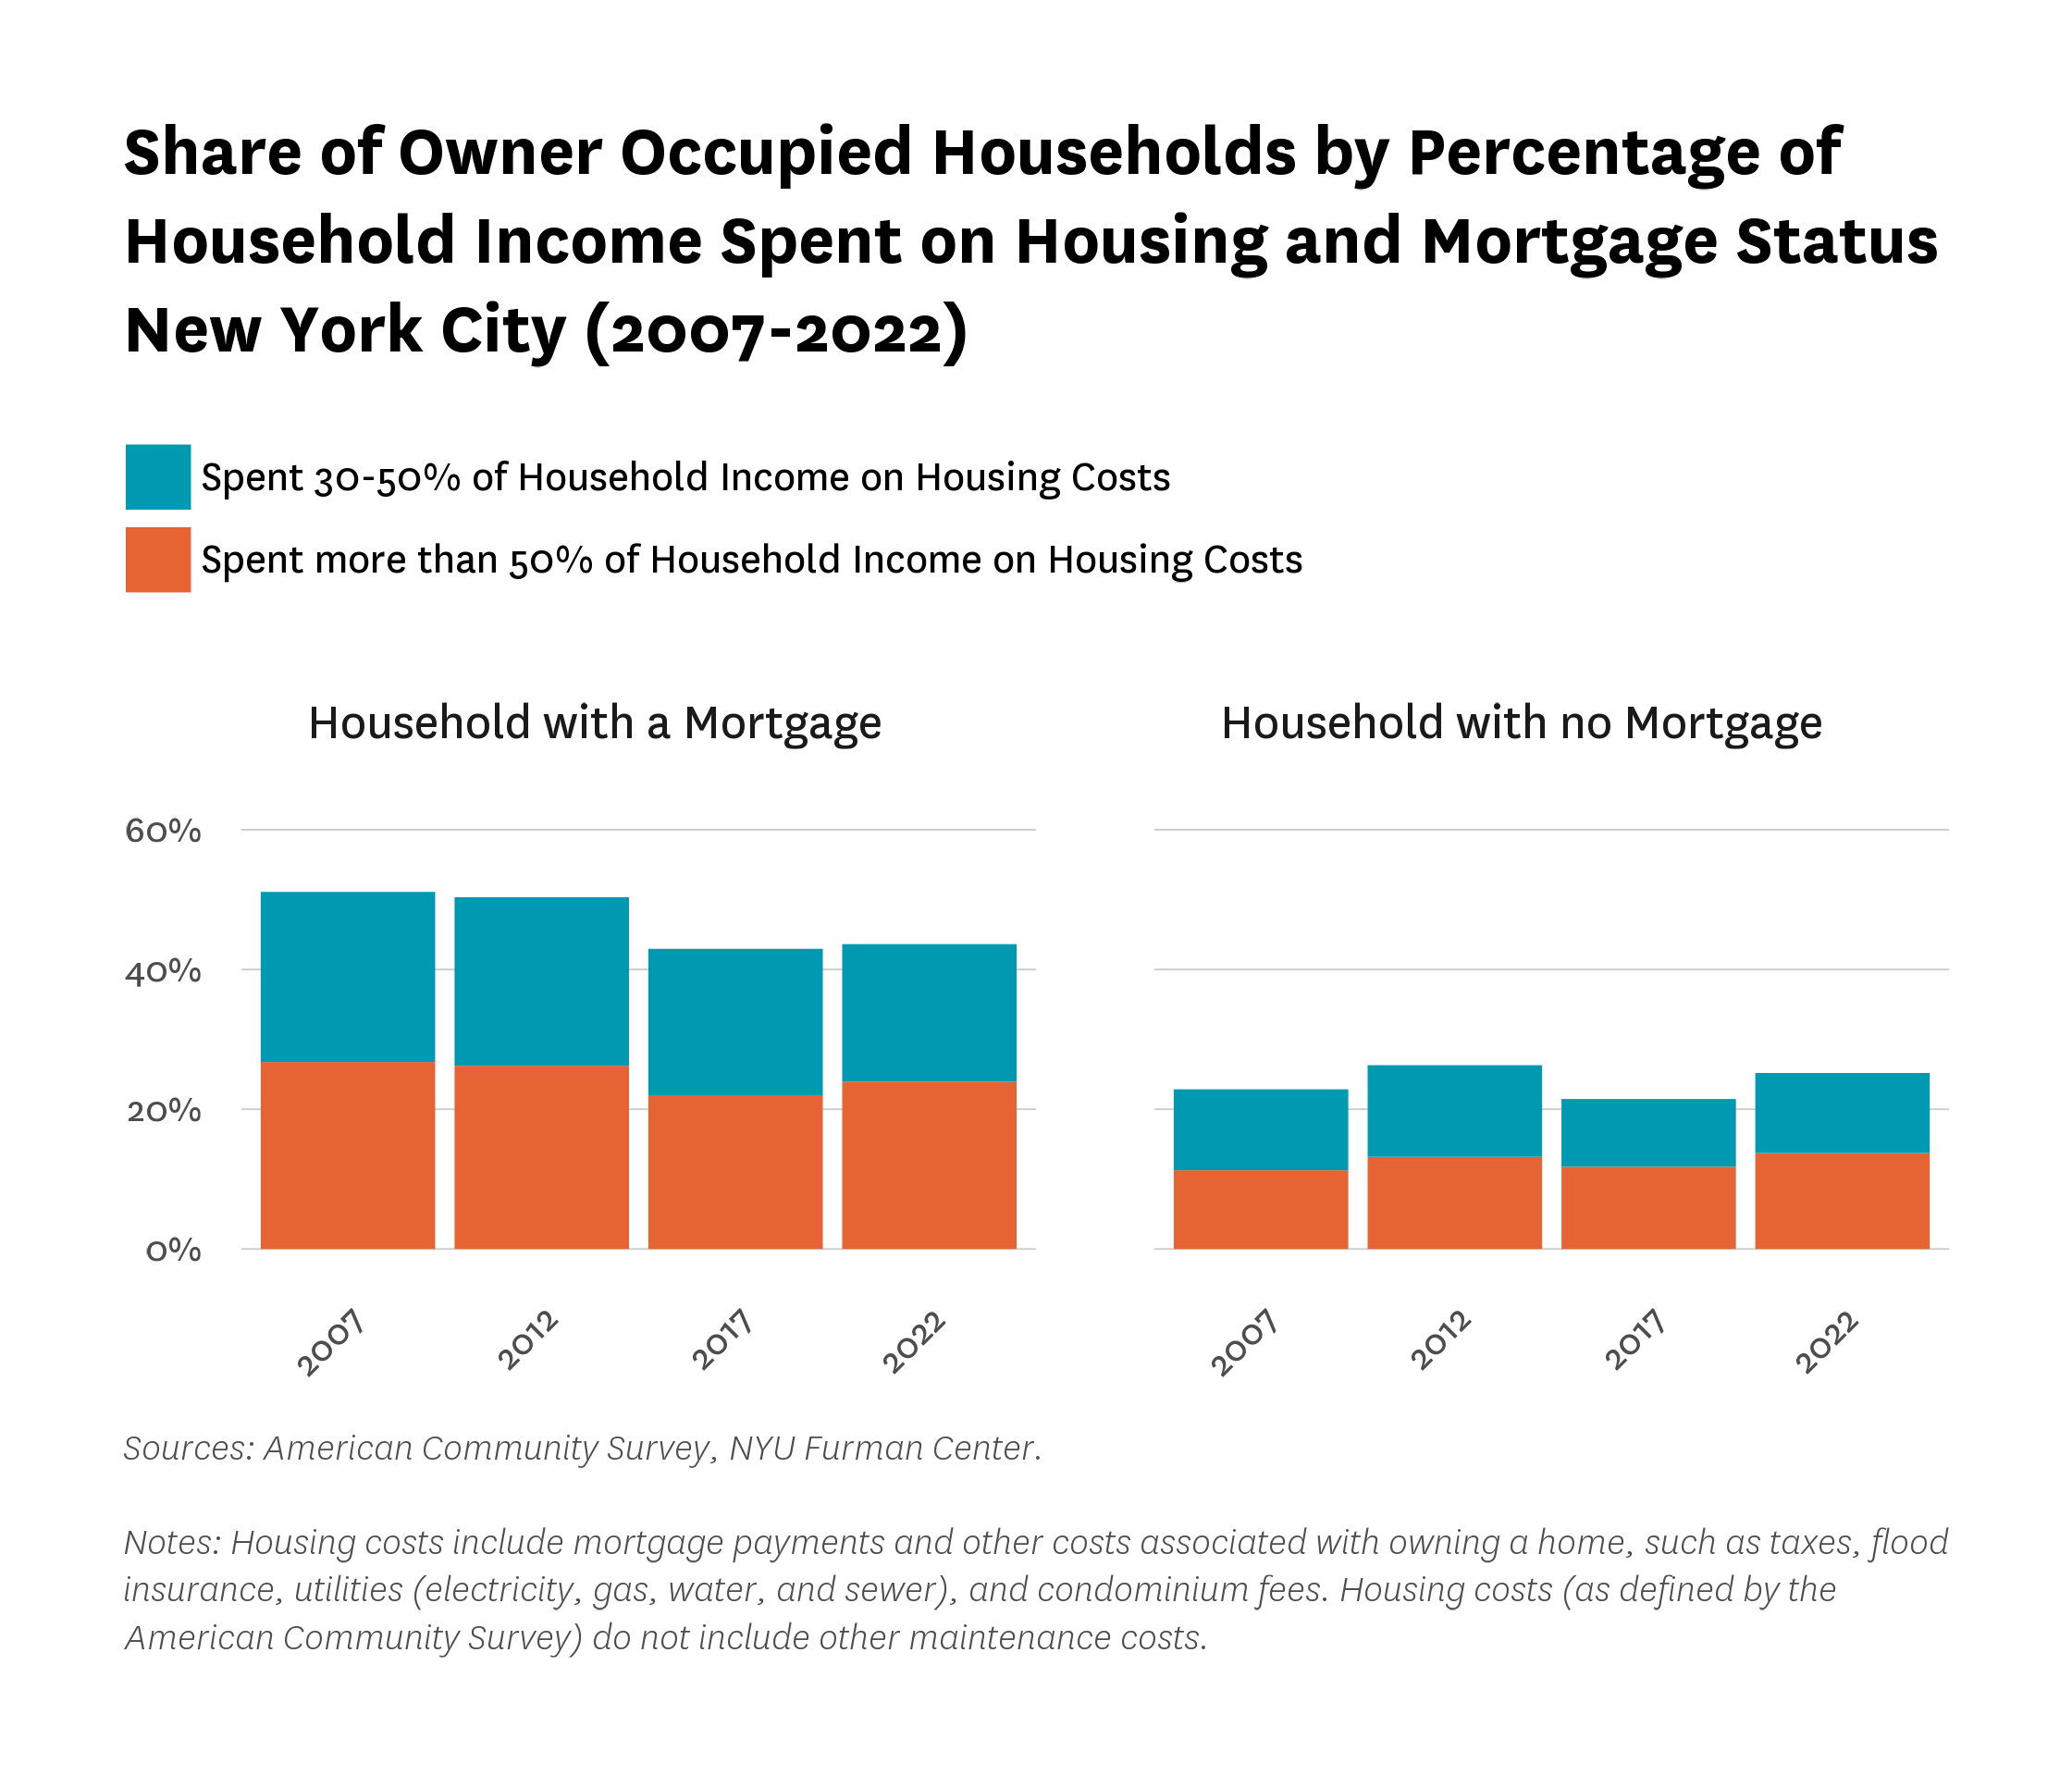
The share of cost-burdened homeowners in New York City decreased slightly between 2007 and 2022.
The share of severely cost-burdened owners, defined as those spending more than 50 percent of household income on housing costs, peaked in 2007 at 26.8 percent for households with a mortgage. Since that peak, this share has decreased slightly by 0.6 percentage points to 26.2 percent in 2012, and then more significantly by 4.2 percentage points to 22.0 percent in 2017. However, it increased again to 23.9 percent by 2022. The proportion of owners who spent 30 to 50 percent of their household income on housing costs dropped from 24.3 percent in 2007 to 19.7 percent in 2022 for those with a mortgage. The rates of cost burden are notably lower for households without a mortgage. In 2022, the share of severely cost-burdened households without a mortgage was 10.2 percentage points lower than that of households with a mortgage.
The number of mortgage-financed home purchase originations decreased in all boroughs between 2021 and 2022
The number of mortgages taken out by borrowers to purchase a home remained relatively constant between 2014 and 2019, but then declined by 12.3 percent between 2019 and 2020. Between 2021 and 2022, home purchase originations decreased across all boroughs. Staten Island saw the largest decrease at 23.3 and Queens had the lowest decrease in home purchase originations, at 14.1 percent.
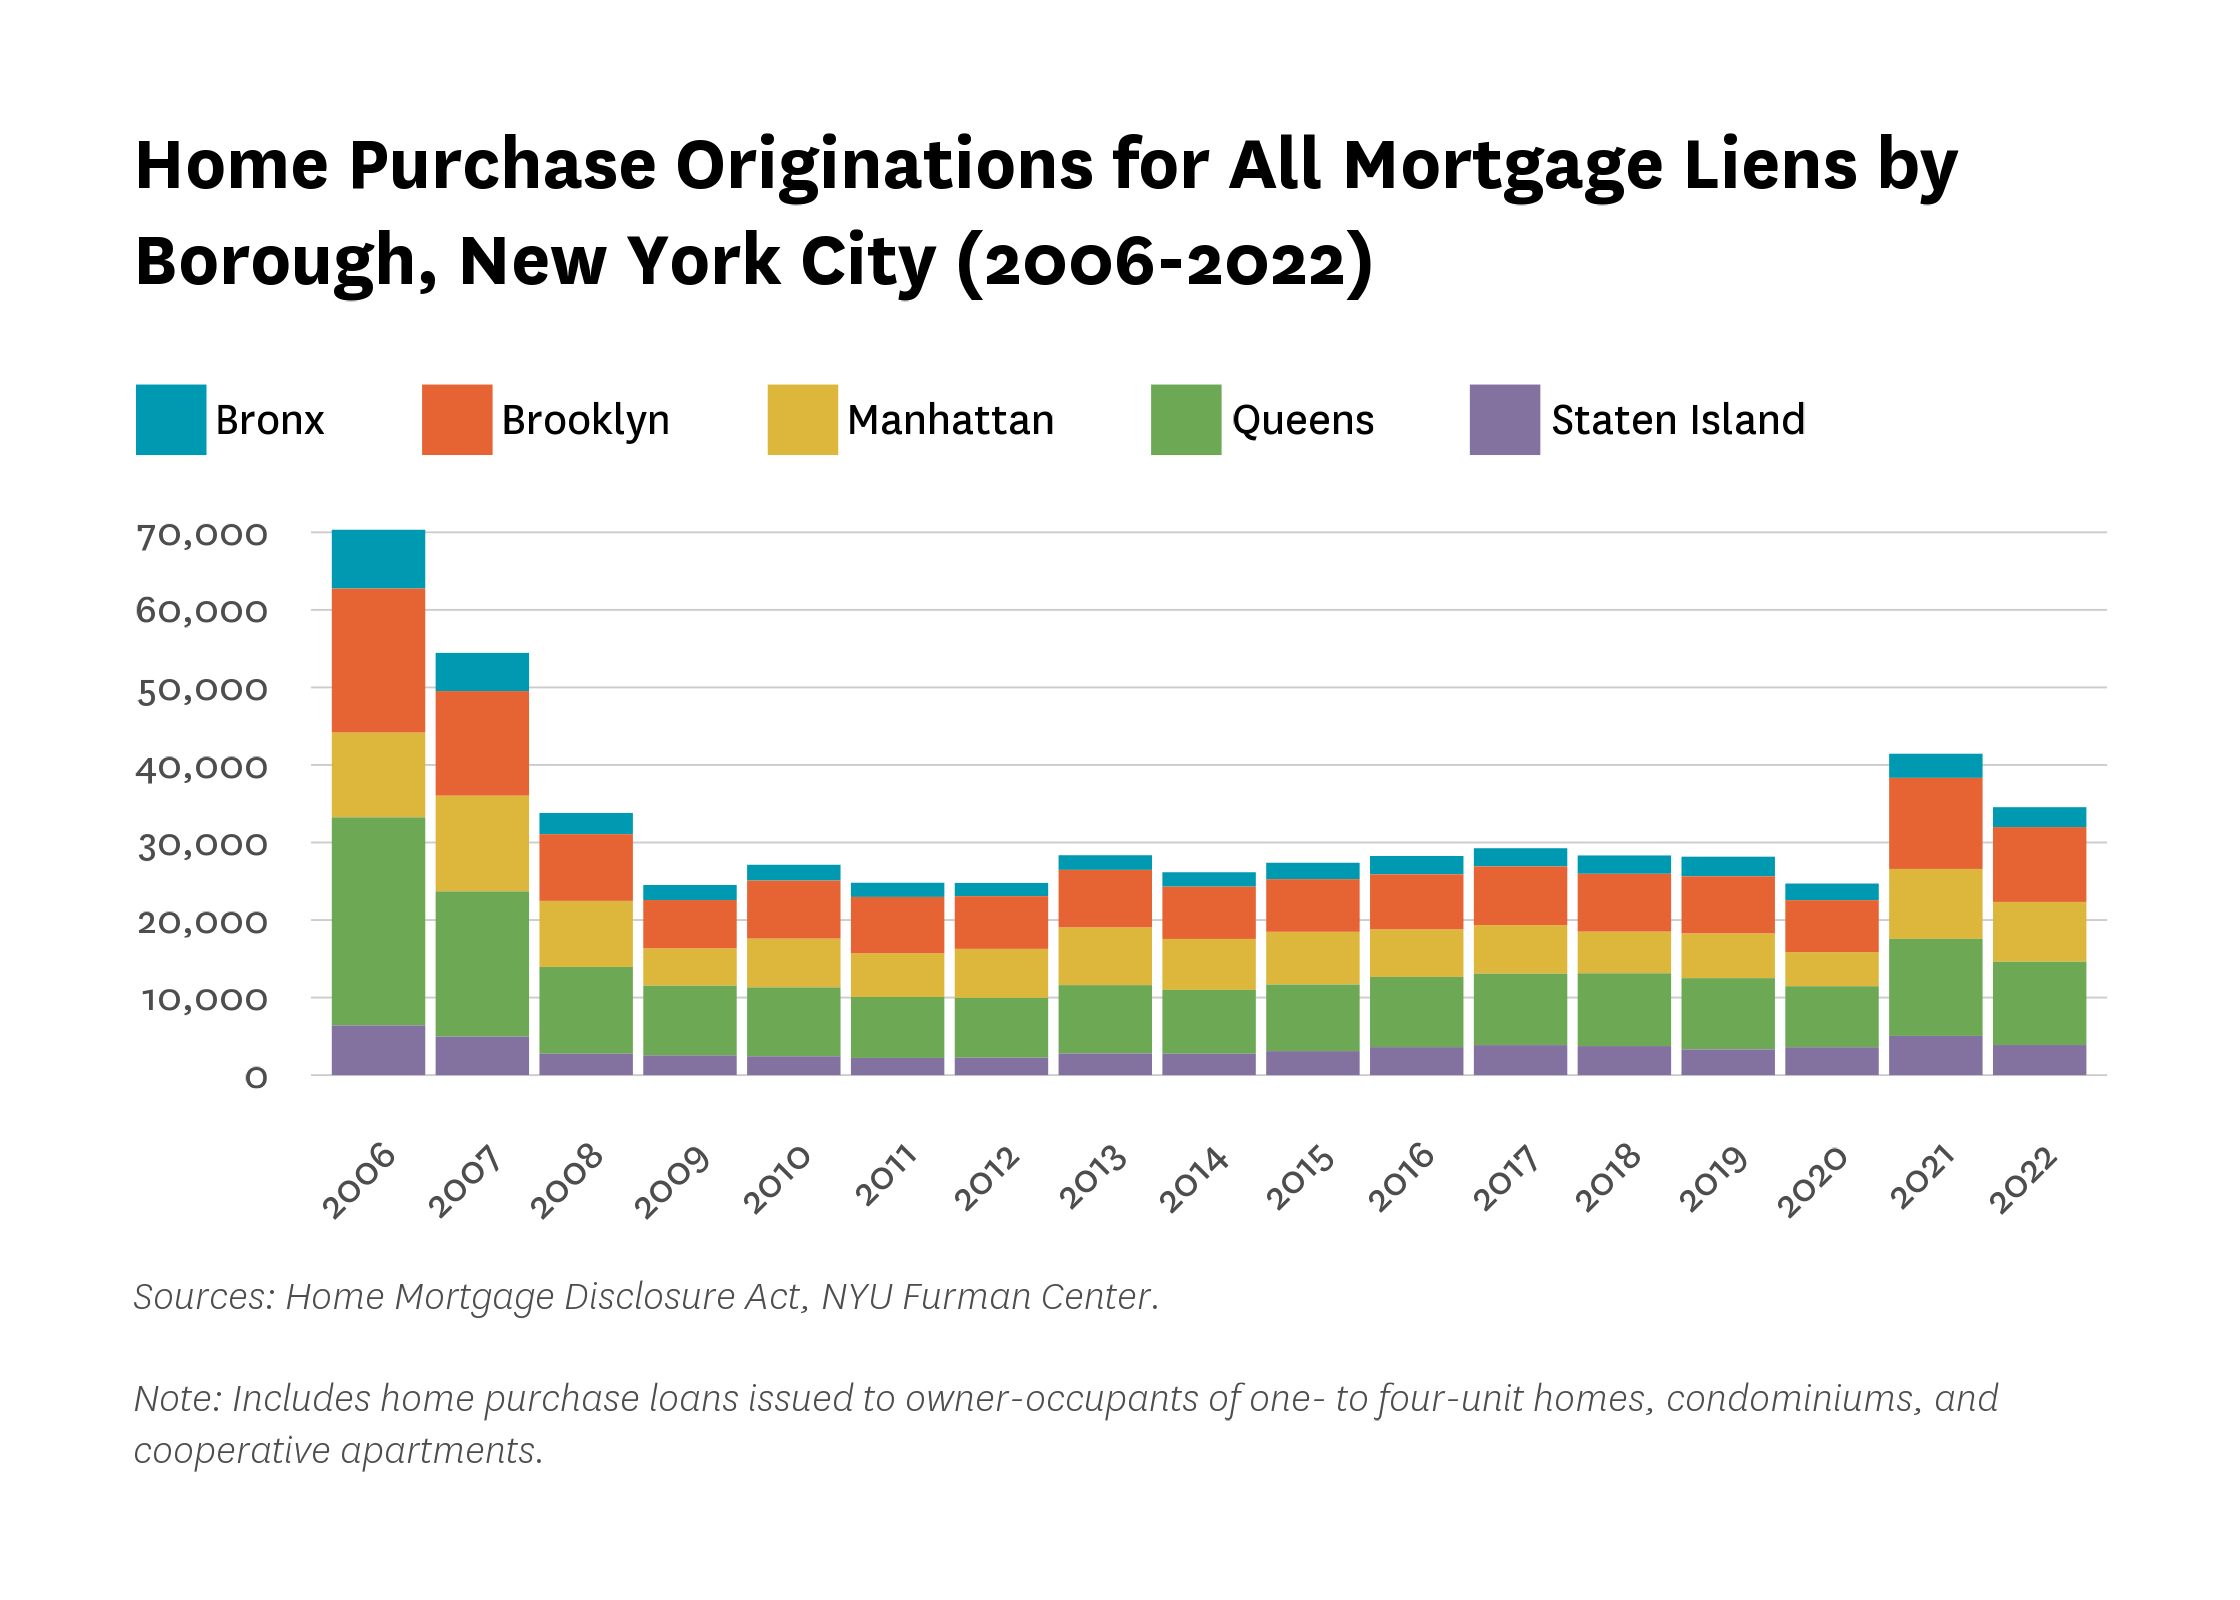
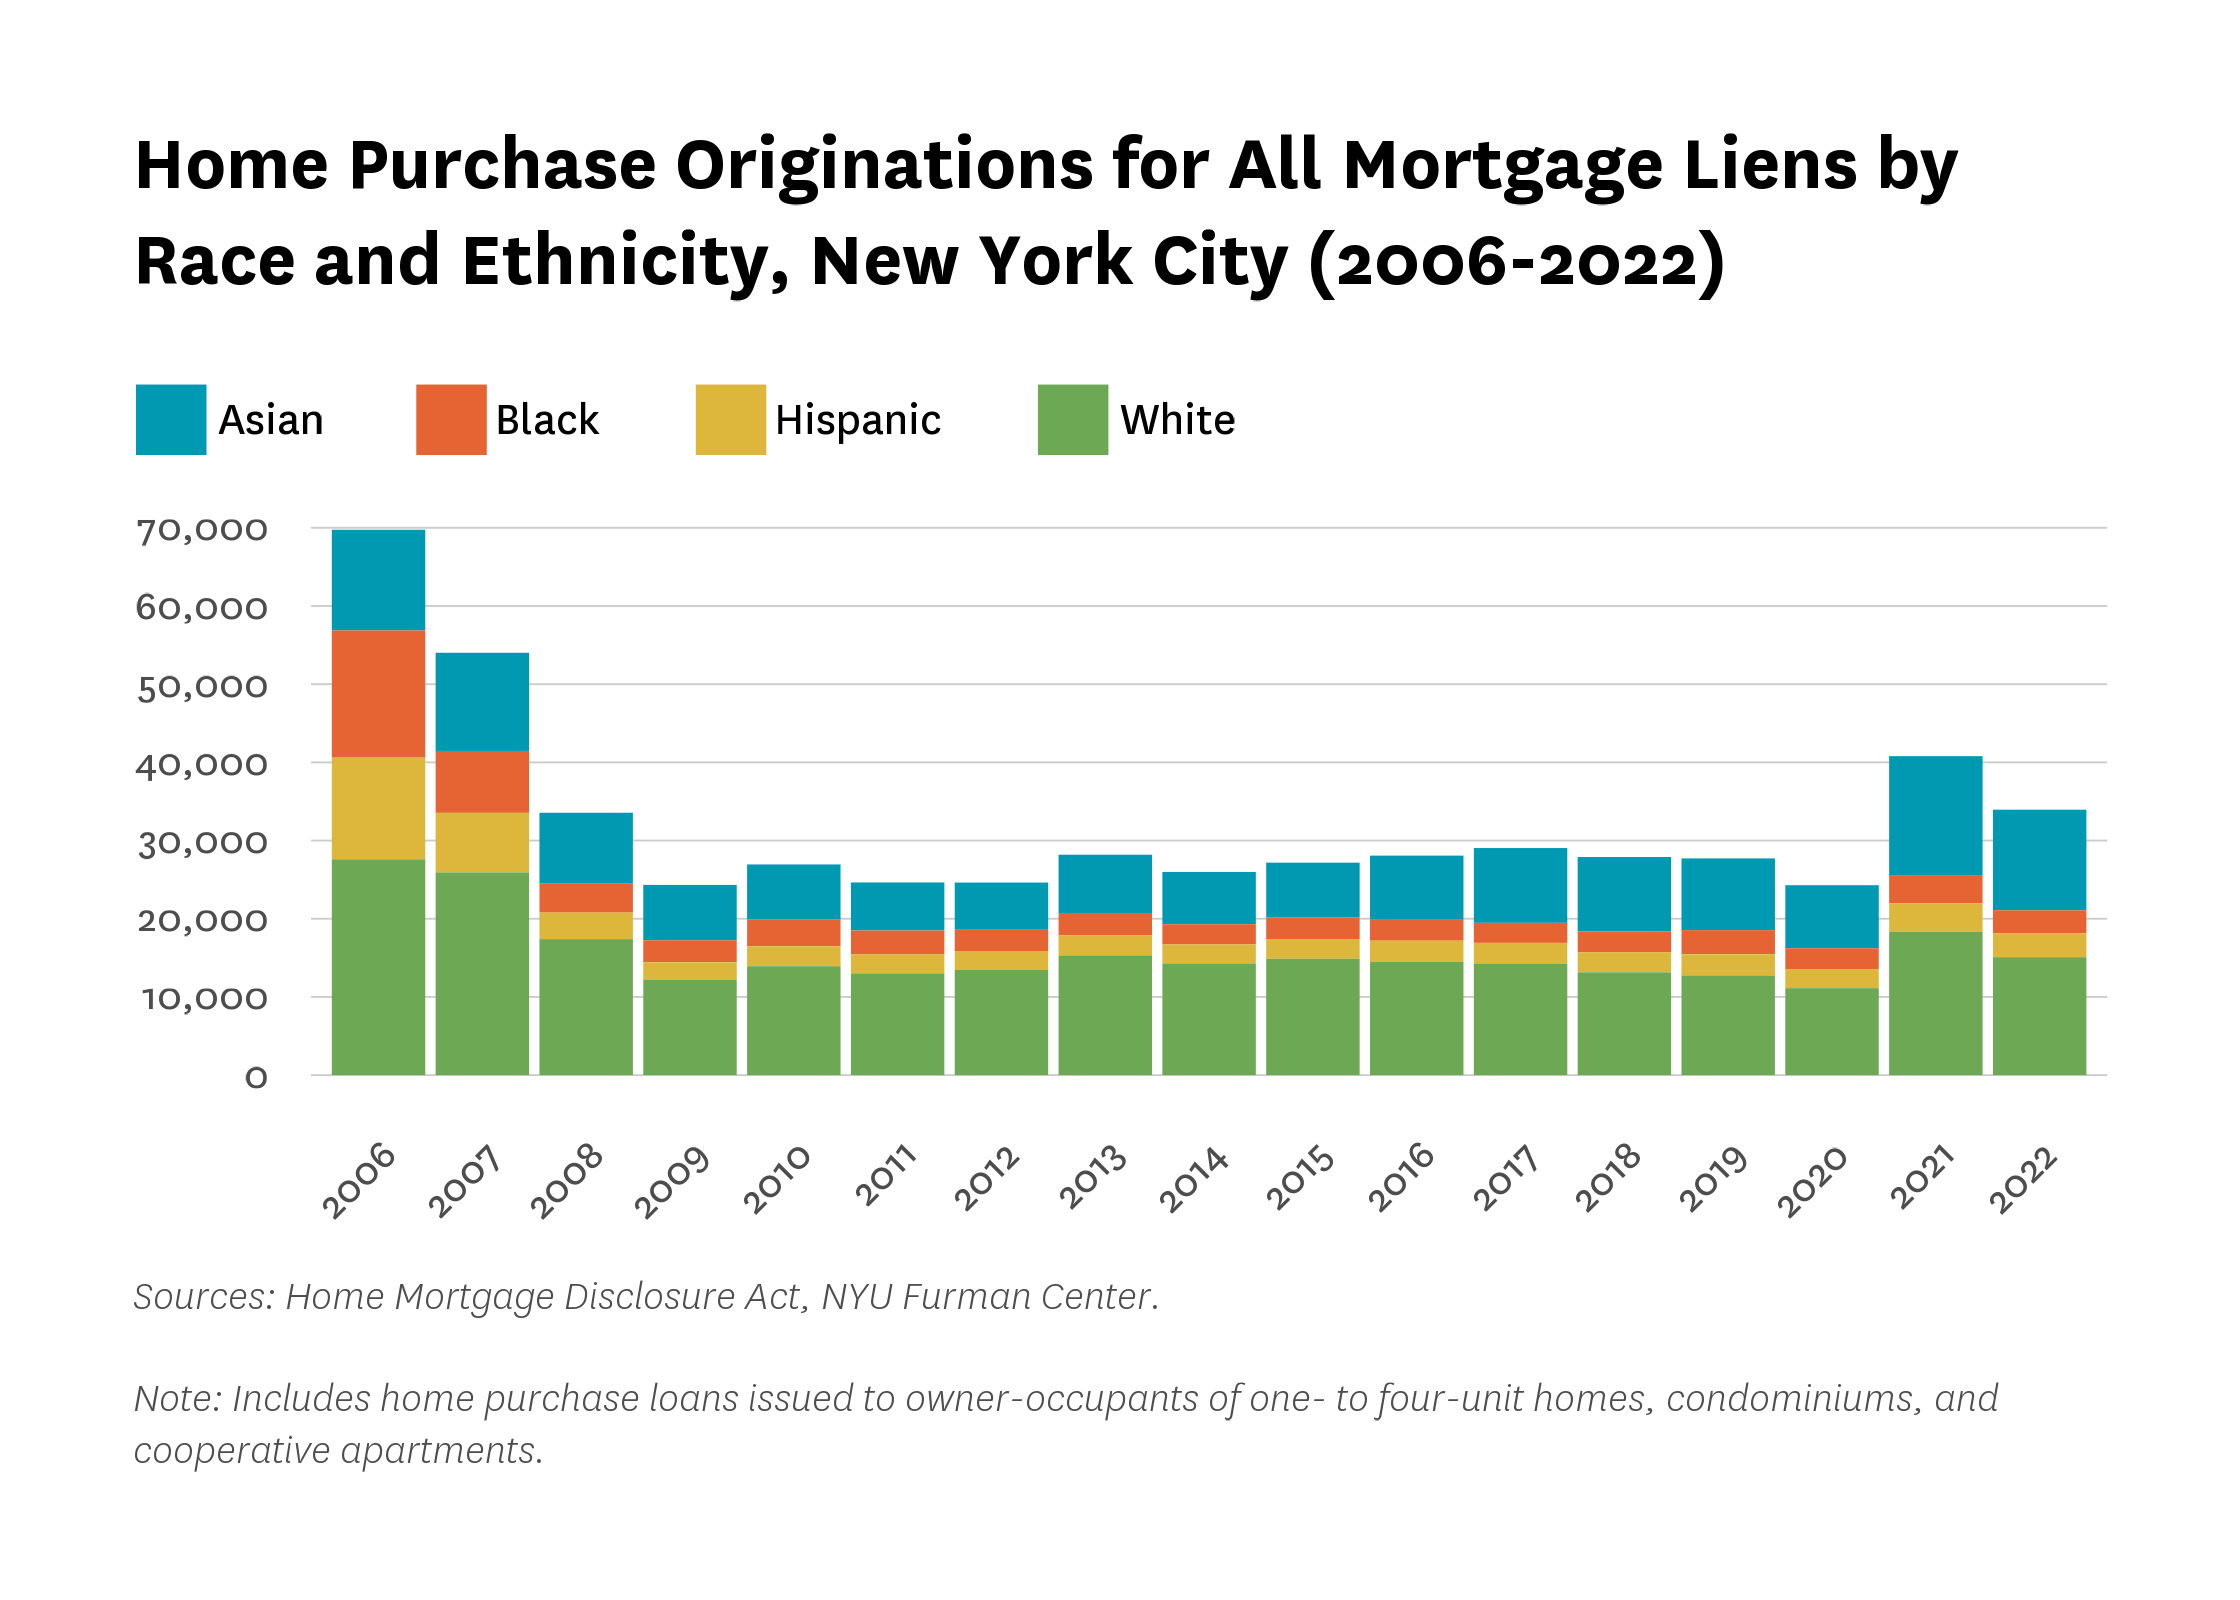
Home purchase originations decreased across all racial and ethnic groups between 2021 and 2022 as interest rates rose, following an increase across all groups in the previous year.
Between 2021 and 2022, Black borrowers saw the largest percent decrease in home loan originations from 3,605 to 2,931 (18.7%), and comprised the smallest share of home mortgage originations (8.6%). Hispanic borrowers represented the second lowest share of mortgage originations (9.0%) and saw a 15.6 percent decrease from 2021 to 2022. White borrowers saw the second highest percent decrease in mortgage originations during this time (17.8%), and represented the largest share of home loan originations of all groups (44.4%).
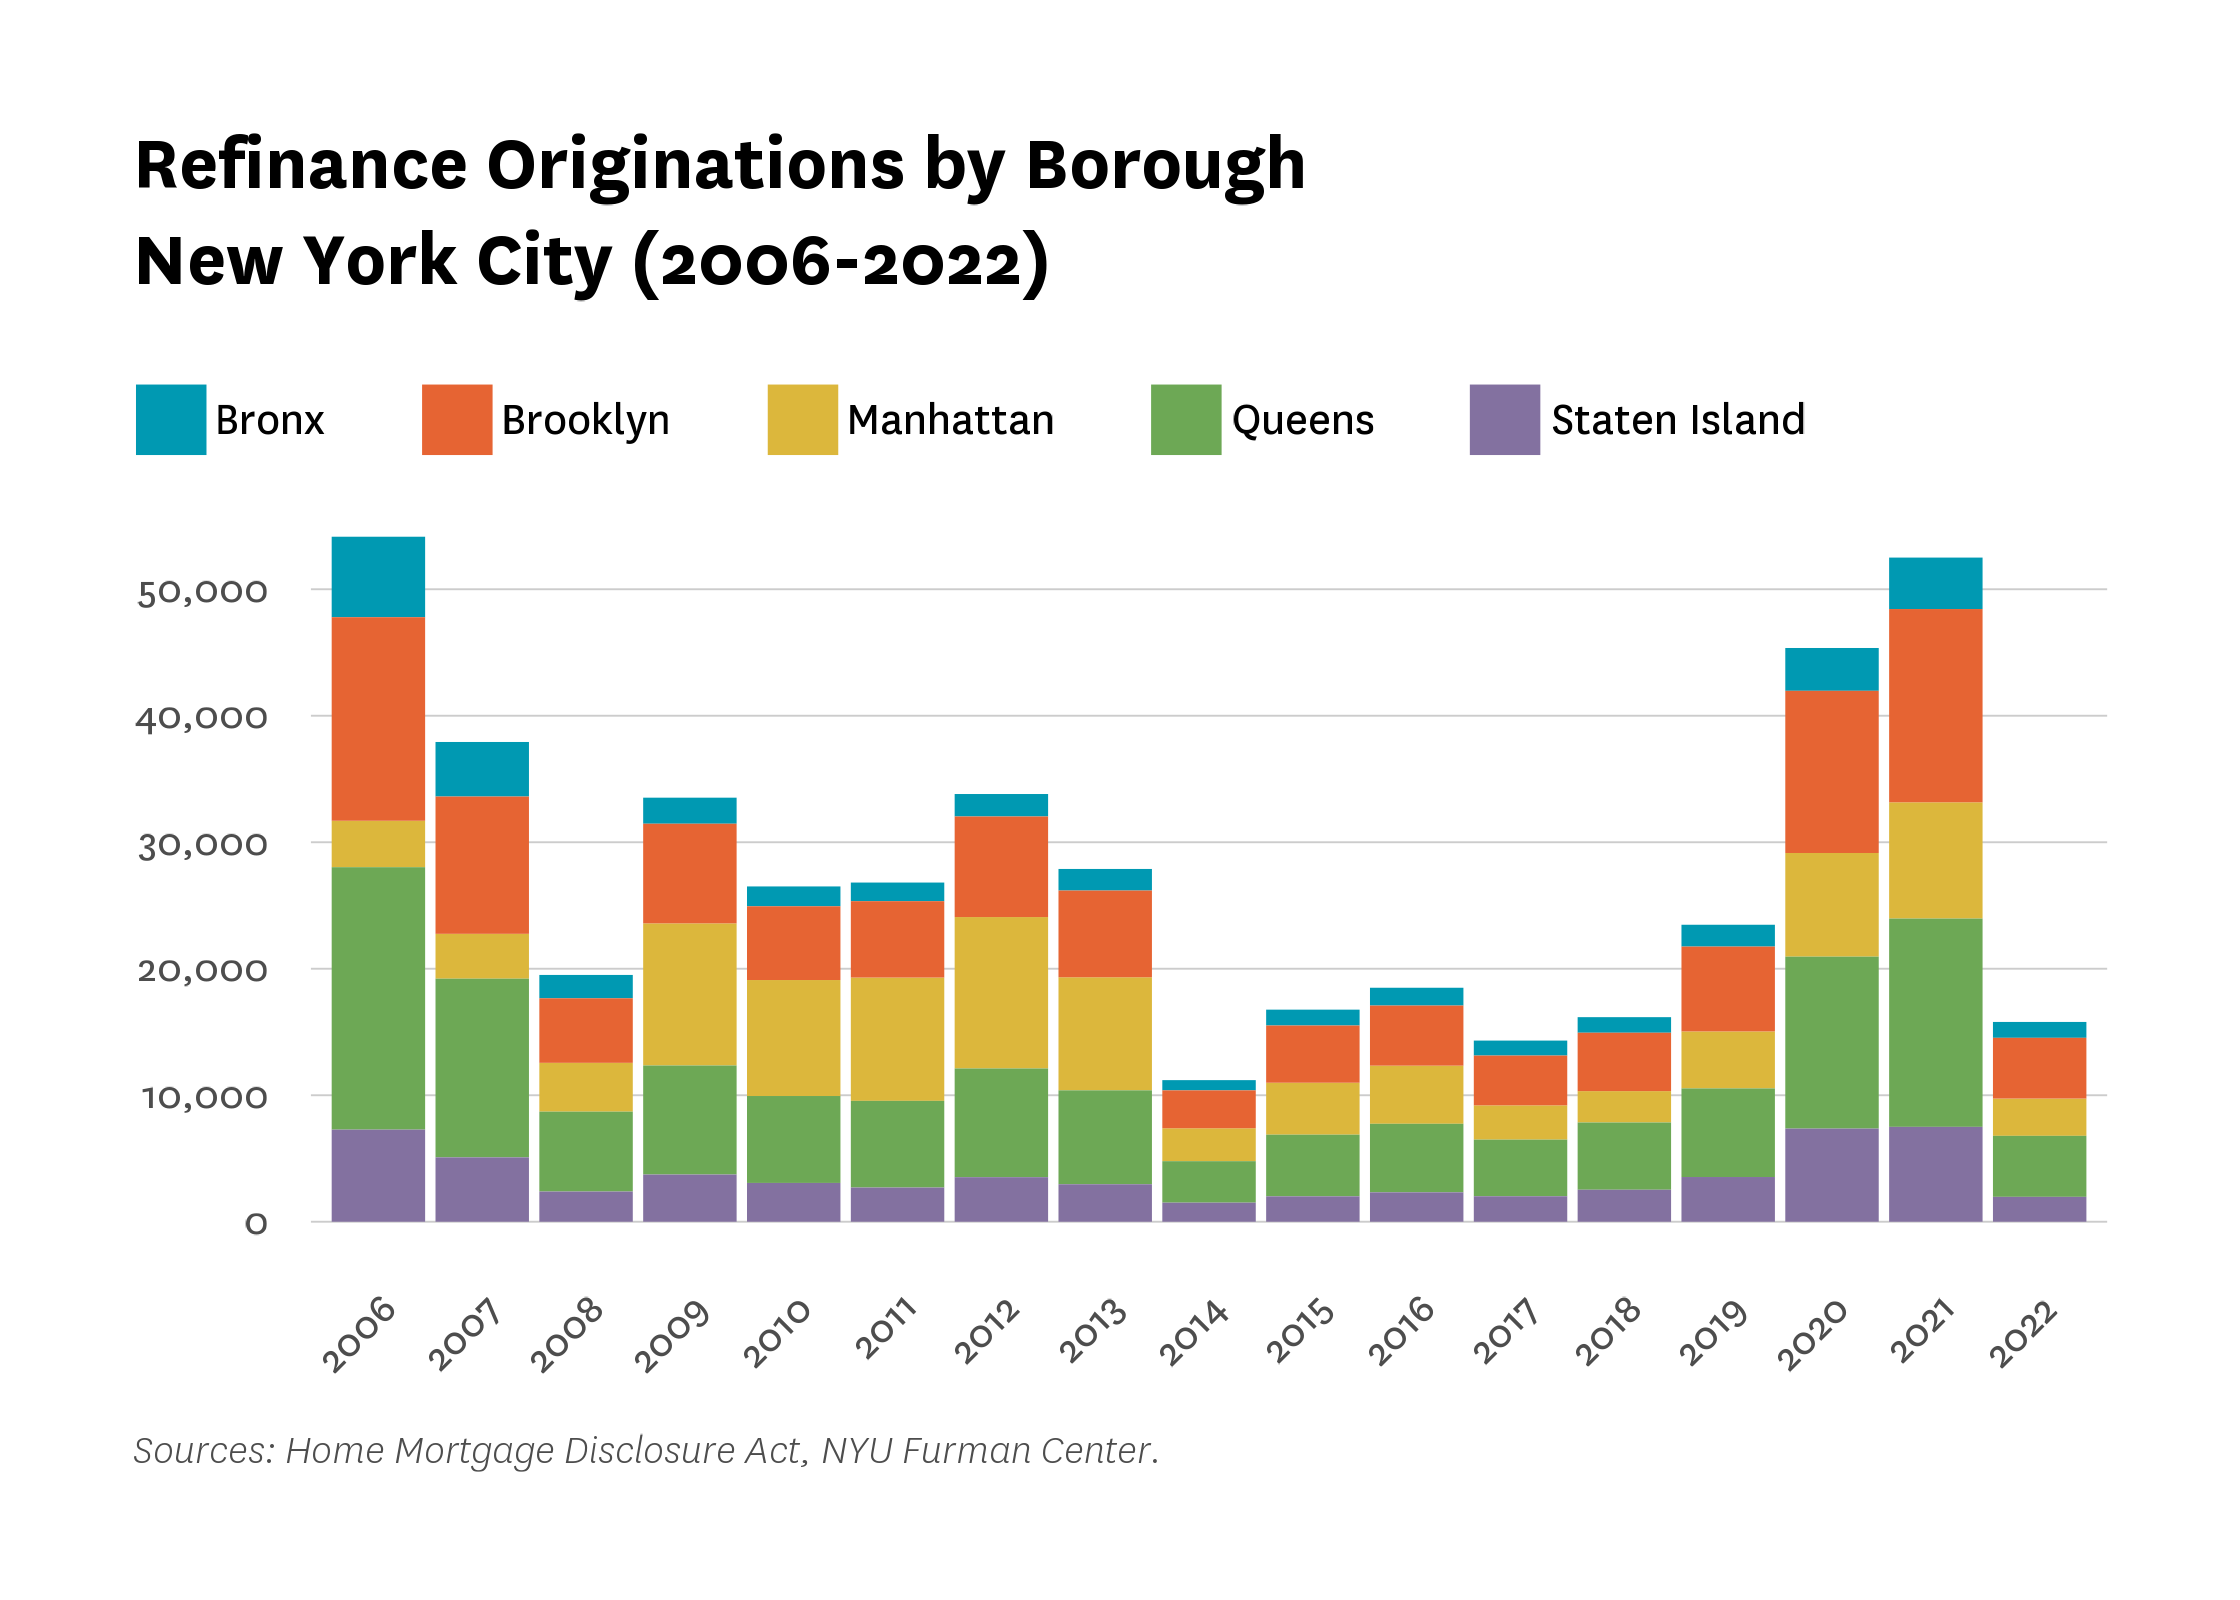
Between 2021 and 2022, mortgage refinancing across all boroughs decreased by 69.9 percent.
The total number of mortgage refinance originations citywide decreased from 52,503 in 2021 to 15,794 in 2022 as interest rates rose. All boroughs saw decreases in refinance originations in this time period, with Staten Island experiencing the largest percent decrease (73.8%) followed by Queens (70.7%). This decrease in mortgage refinancing occurred at the same time interest rates rose.
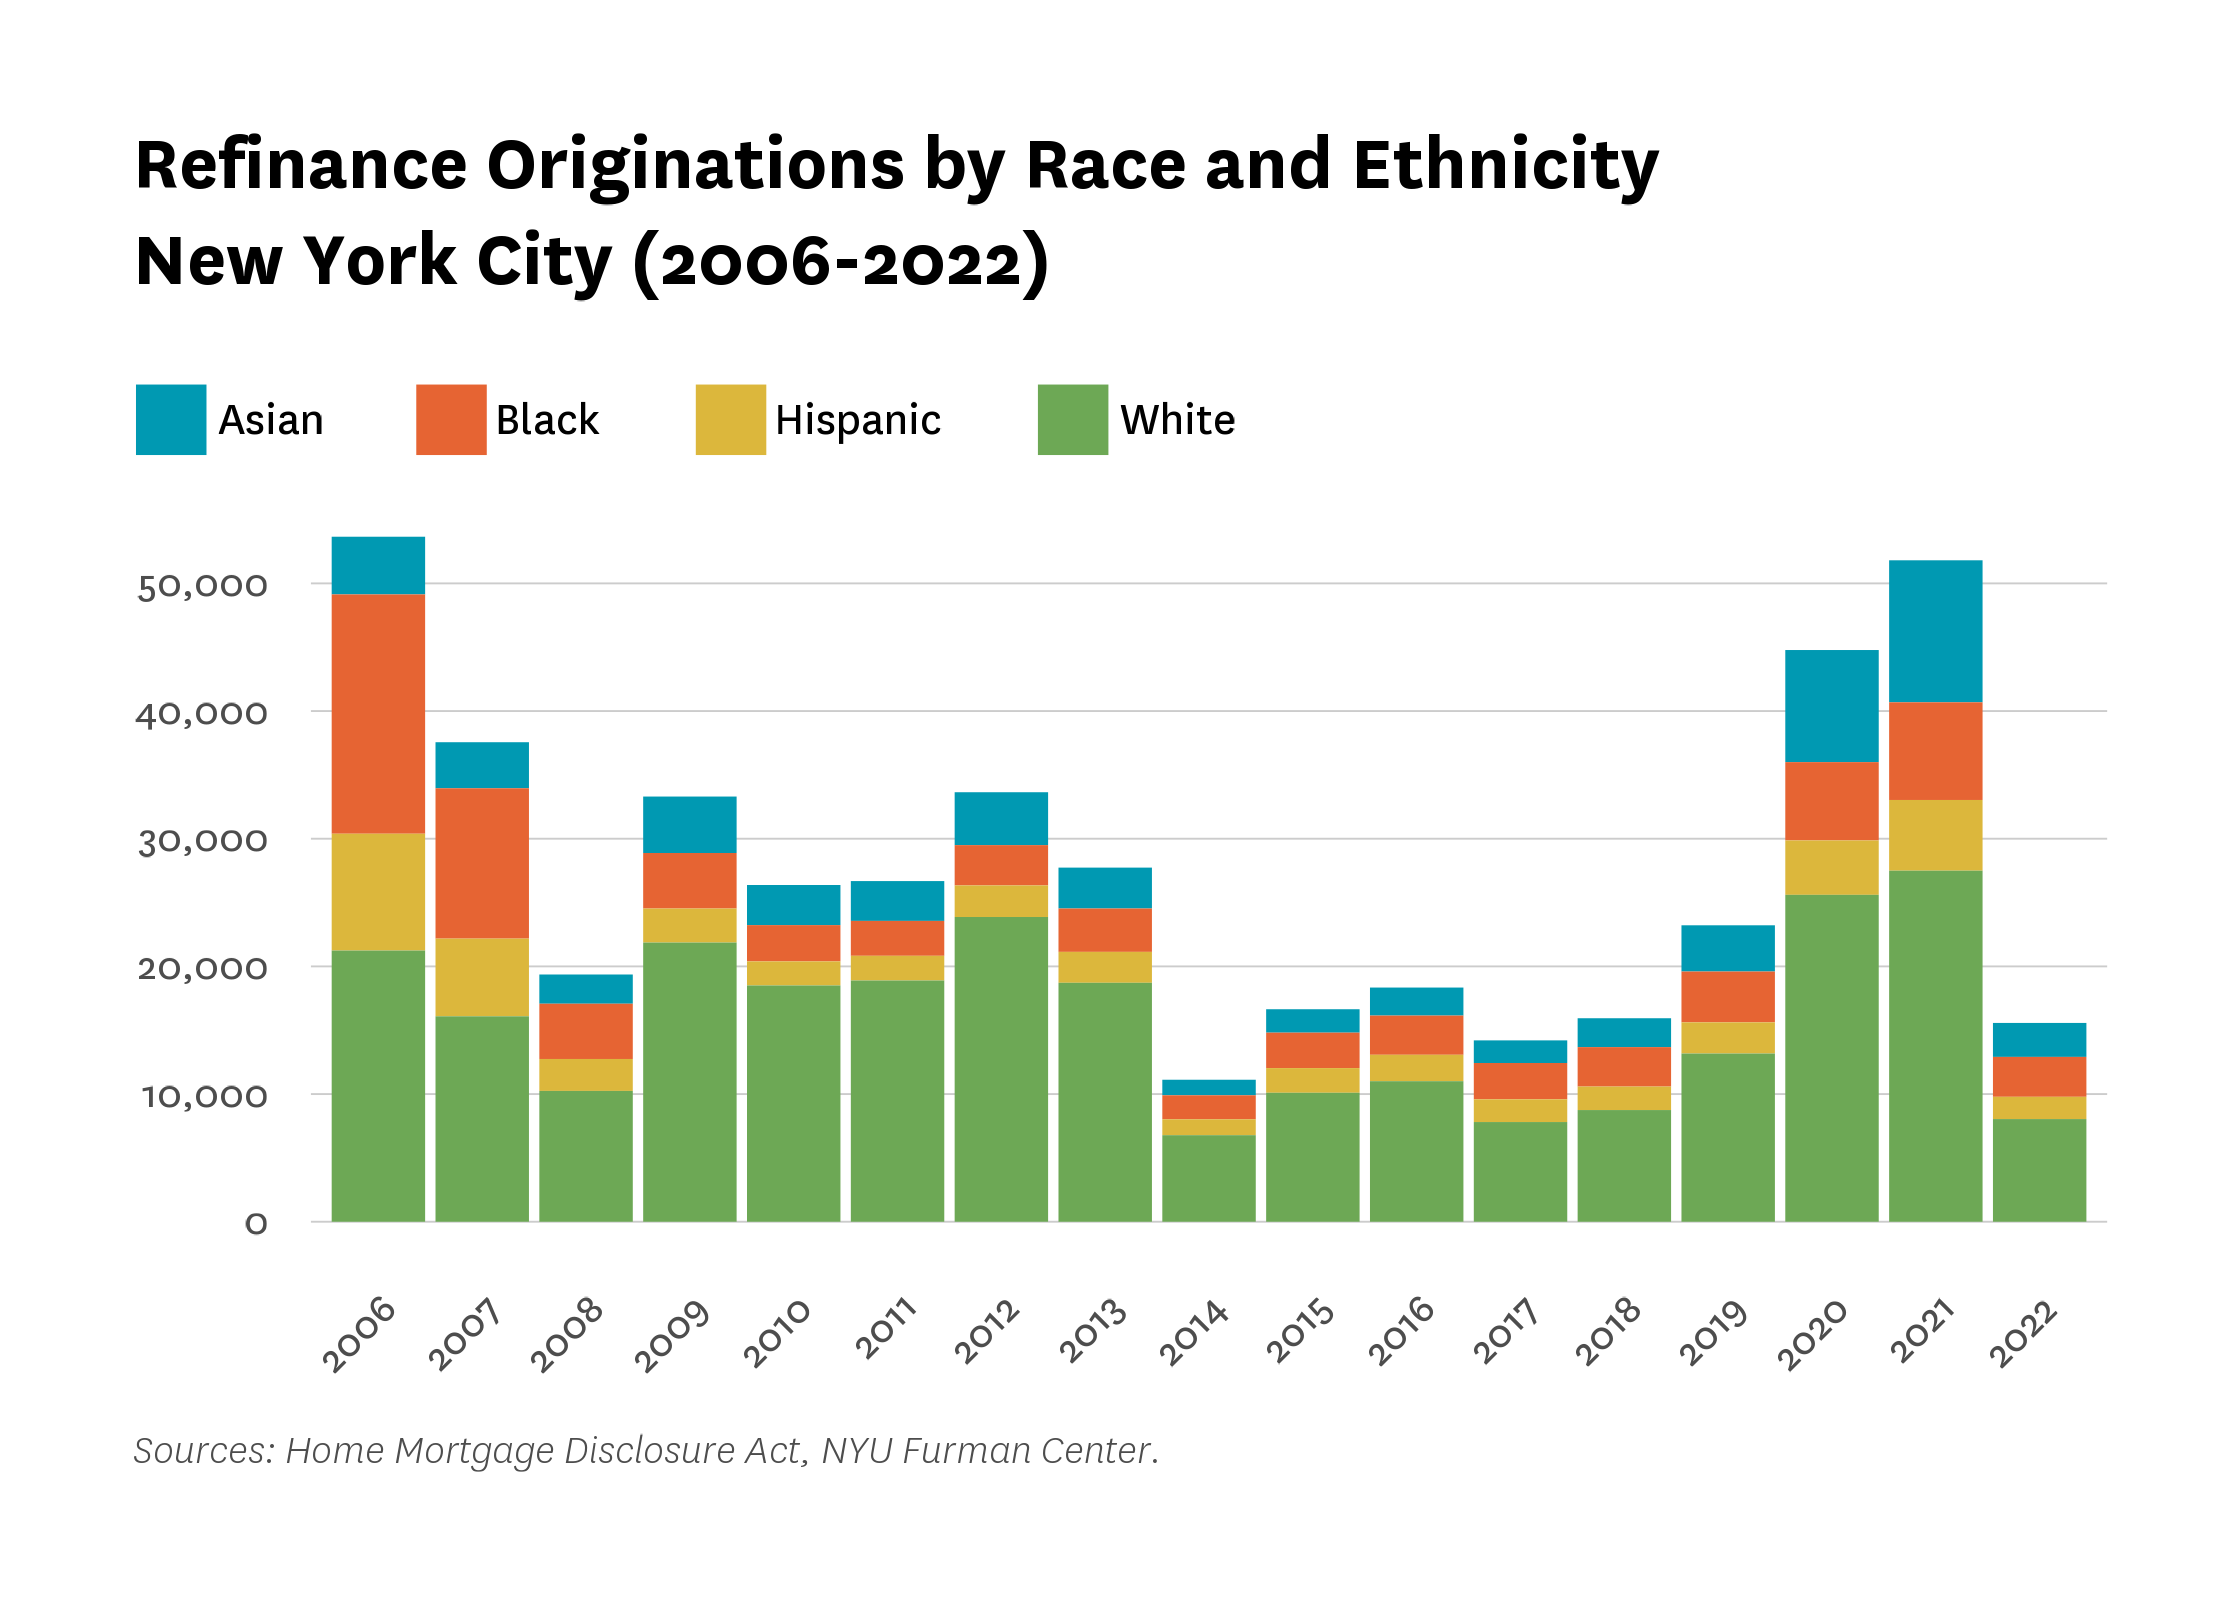
From 2021 to 2022, refinancing activity decreased for mortgage holders in all racial and ethnic groups, with the largest percent decreases seen among White and Asian borrowers.
As mortgage interest rates rose the number of mortgage refinance originations decreased for all racial and ethnic groups between 2021 and 2022 back to levels more comparable to those in the mid teens. Originations decreased the least for Black borrowers (59.1%) and Hispanic borrowers (68.5%), while Asian and white borrowers saw decreases of 76.1 percent and 70.8 percent, respectively. Shares of refinance originations for Asian and Hispanic households (17.1% and 11.2%) remained below that of Black and white borrowers (20.1% and 51.6%).
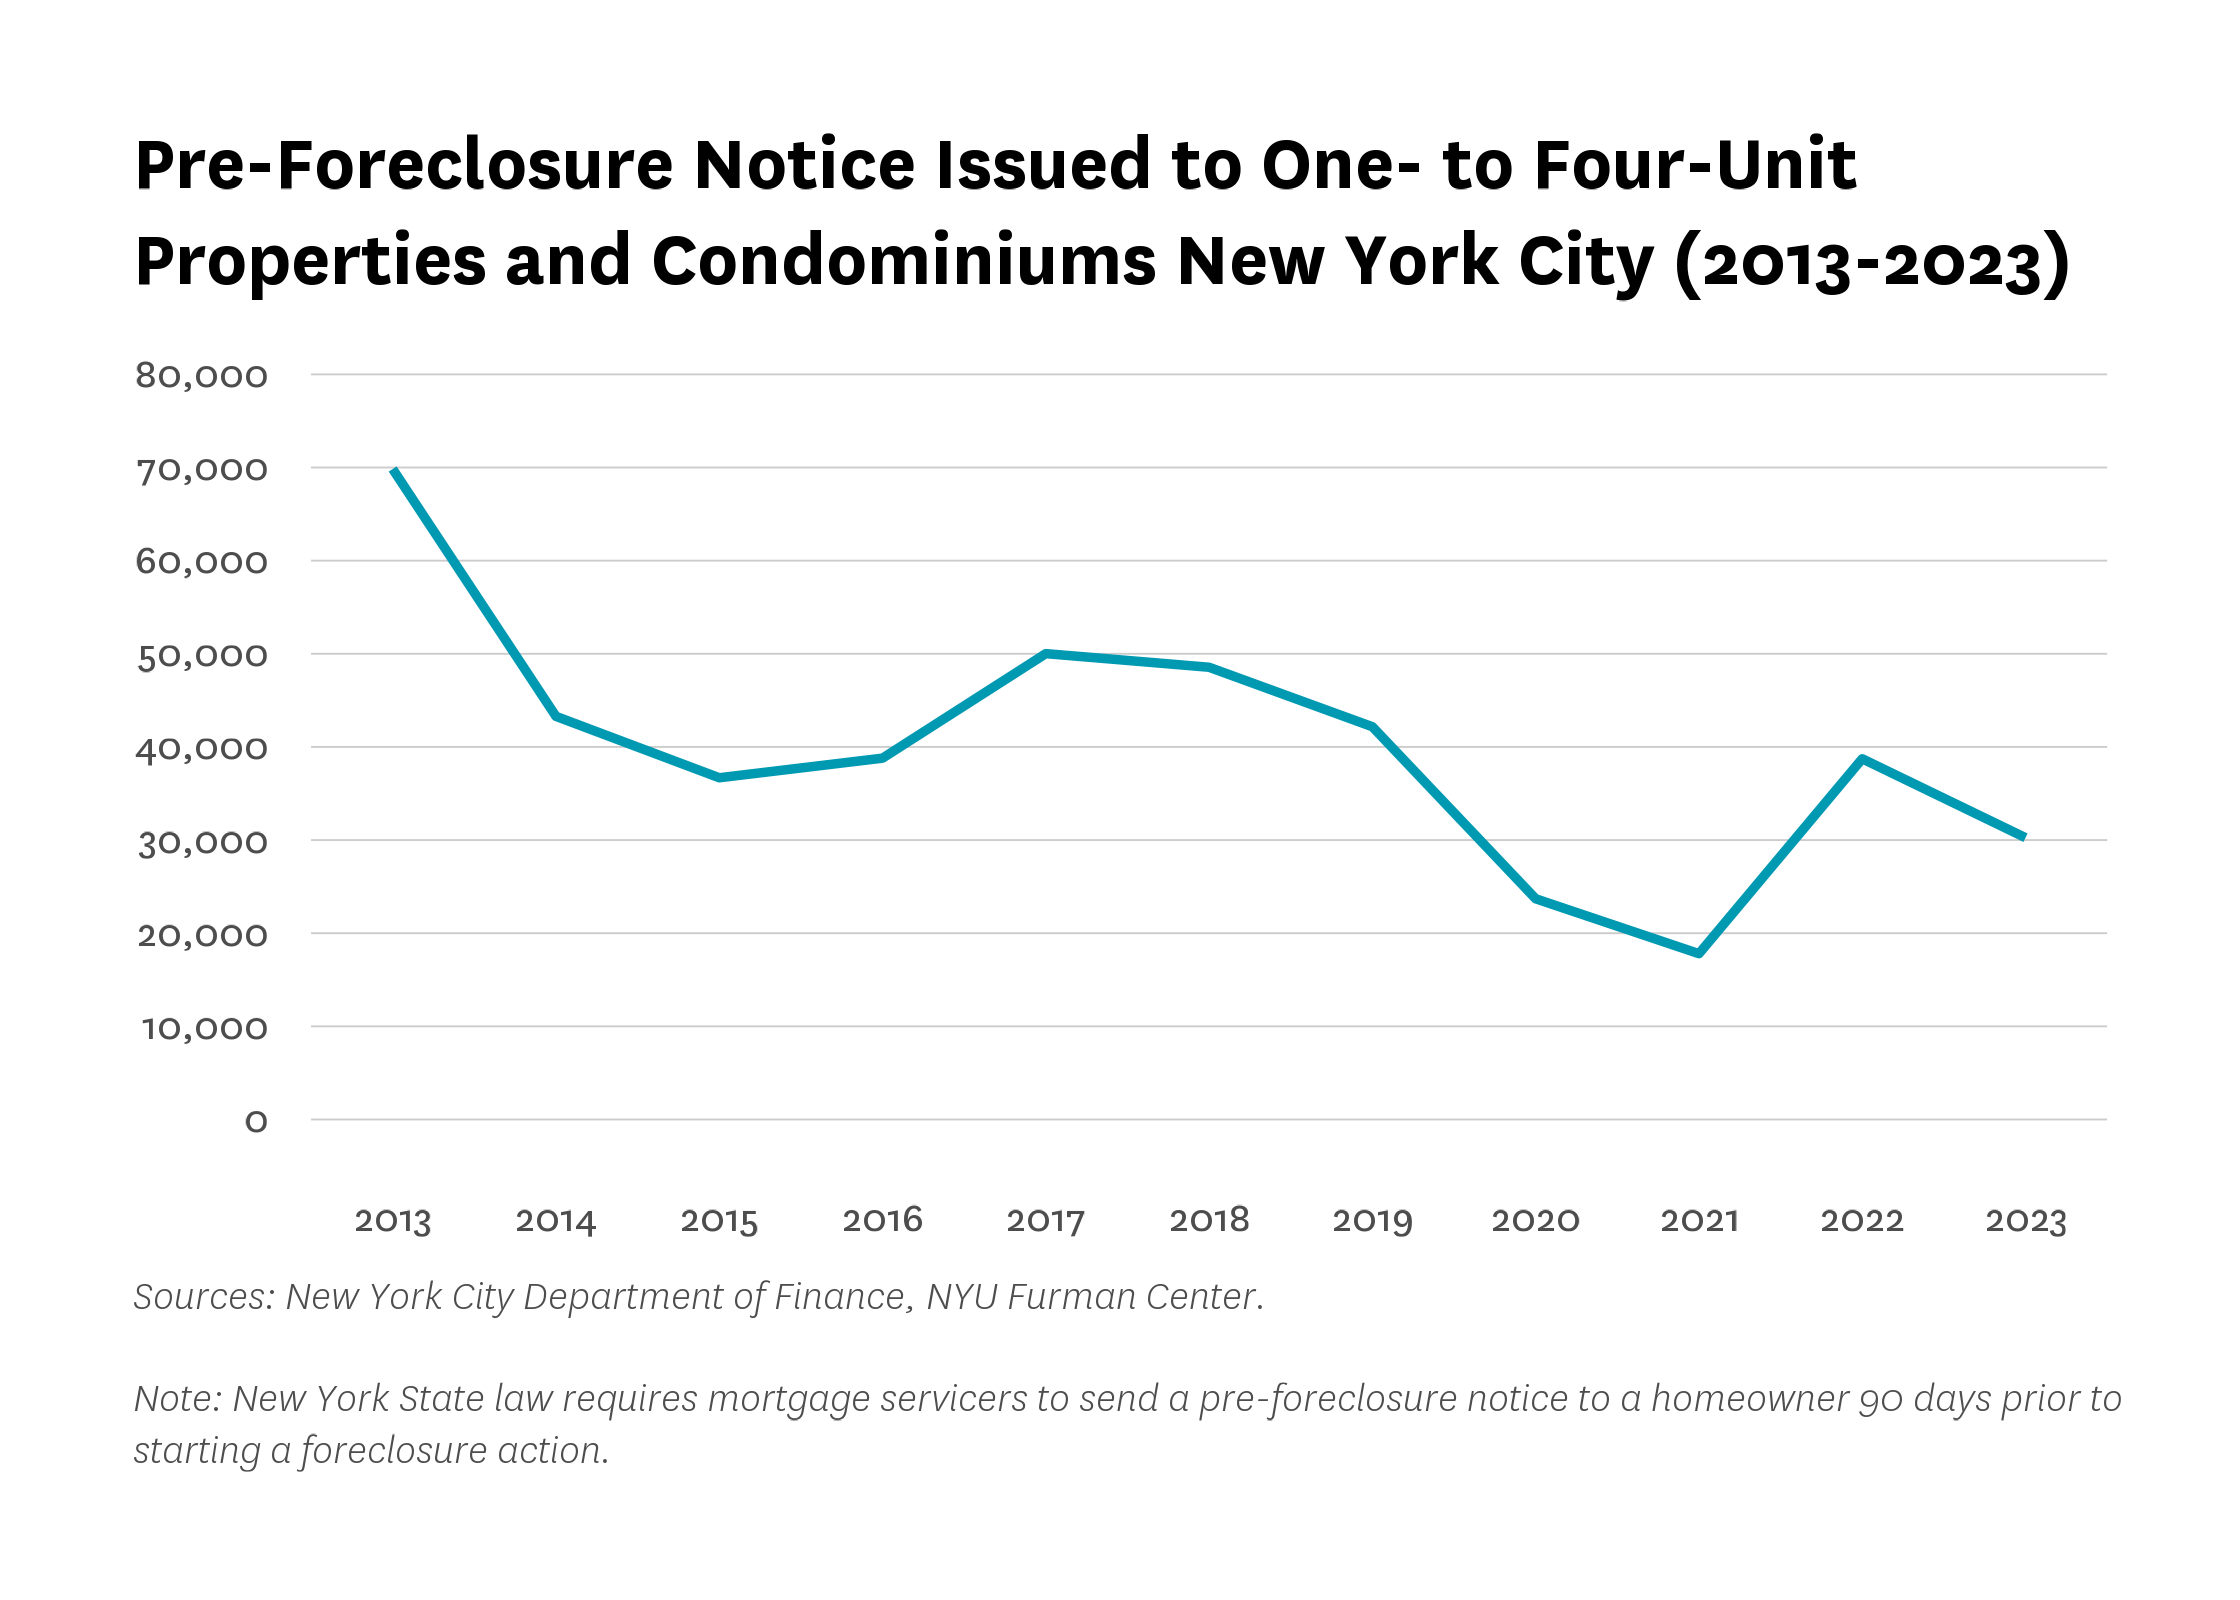
Pre-foreclosure notices in one- to four-unit homes, condominiums, and cooperatives fell from 2022 to 2023, after having increased dramatically in the previous year.
Between 2017 to 2021, the number of pre-foreclosure notices in one to four unit homes, condominiums, and cooperatives declined. In 2021, however, pre-foreclosure notices jumped by 117.6 percent to 38,729. This year over year increase is likely due to the lifting of the NYS pandemic moratorium on foreclosure in January 2022 (the Federal foreclosure moratorium began in mid-March, 2020).2 2023 saw foreclosure notices begin to decline once again, decreasing 21.9 percent to 30,253. Part of the increase in 2022 could be attributed to a backlog that developed during the pandemic period.
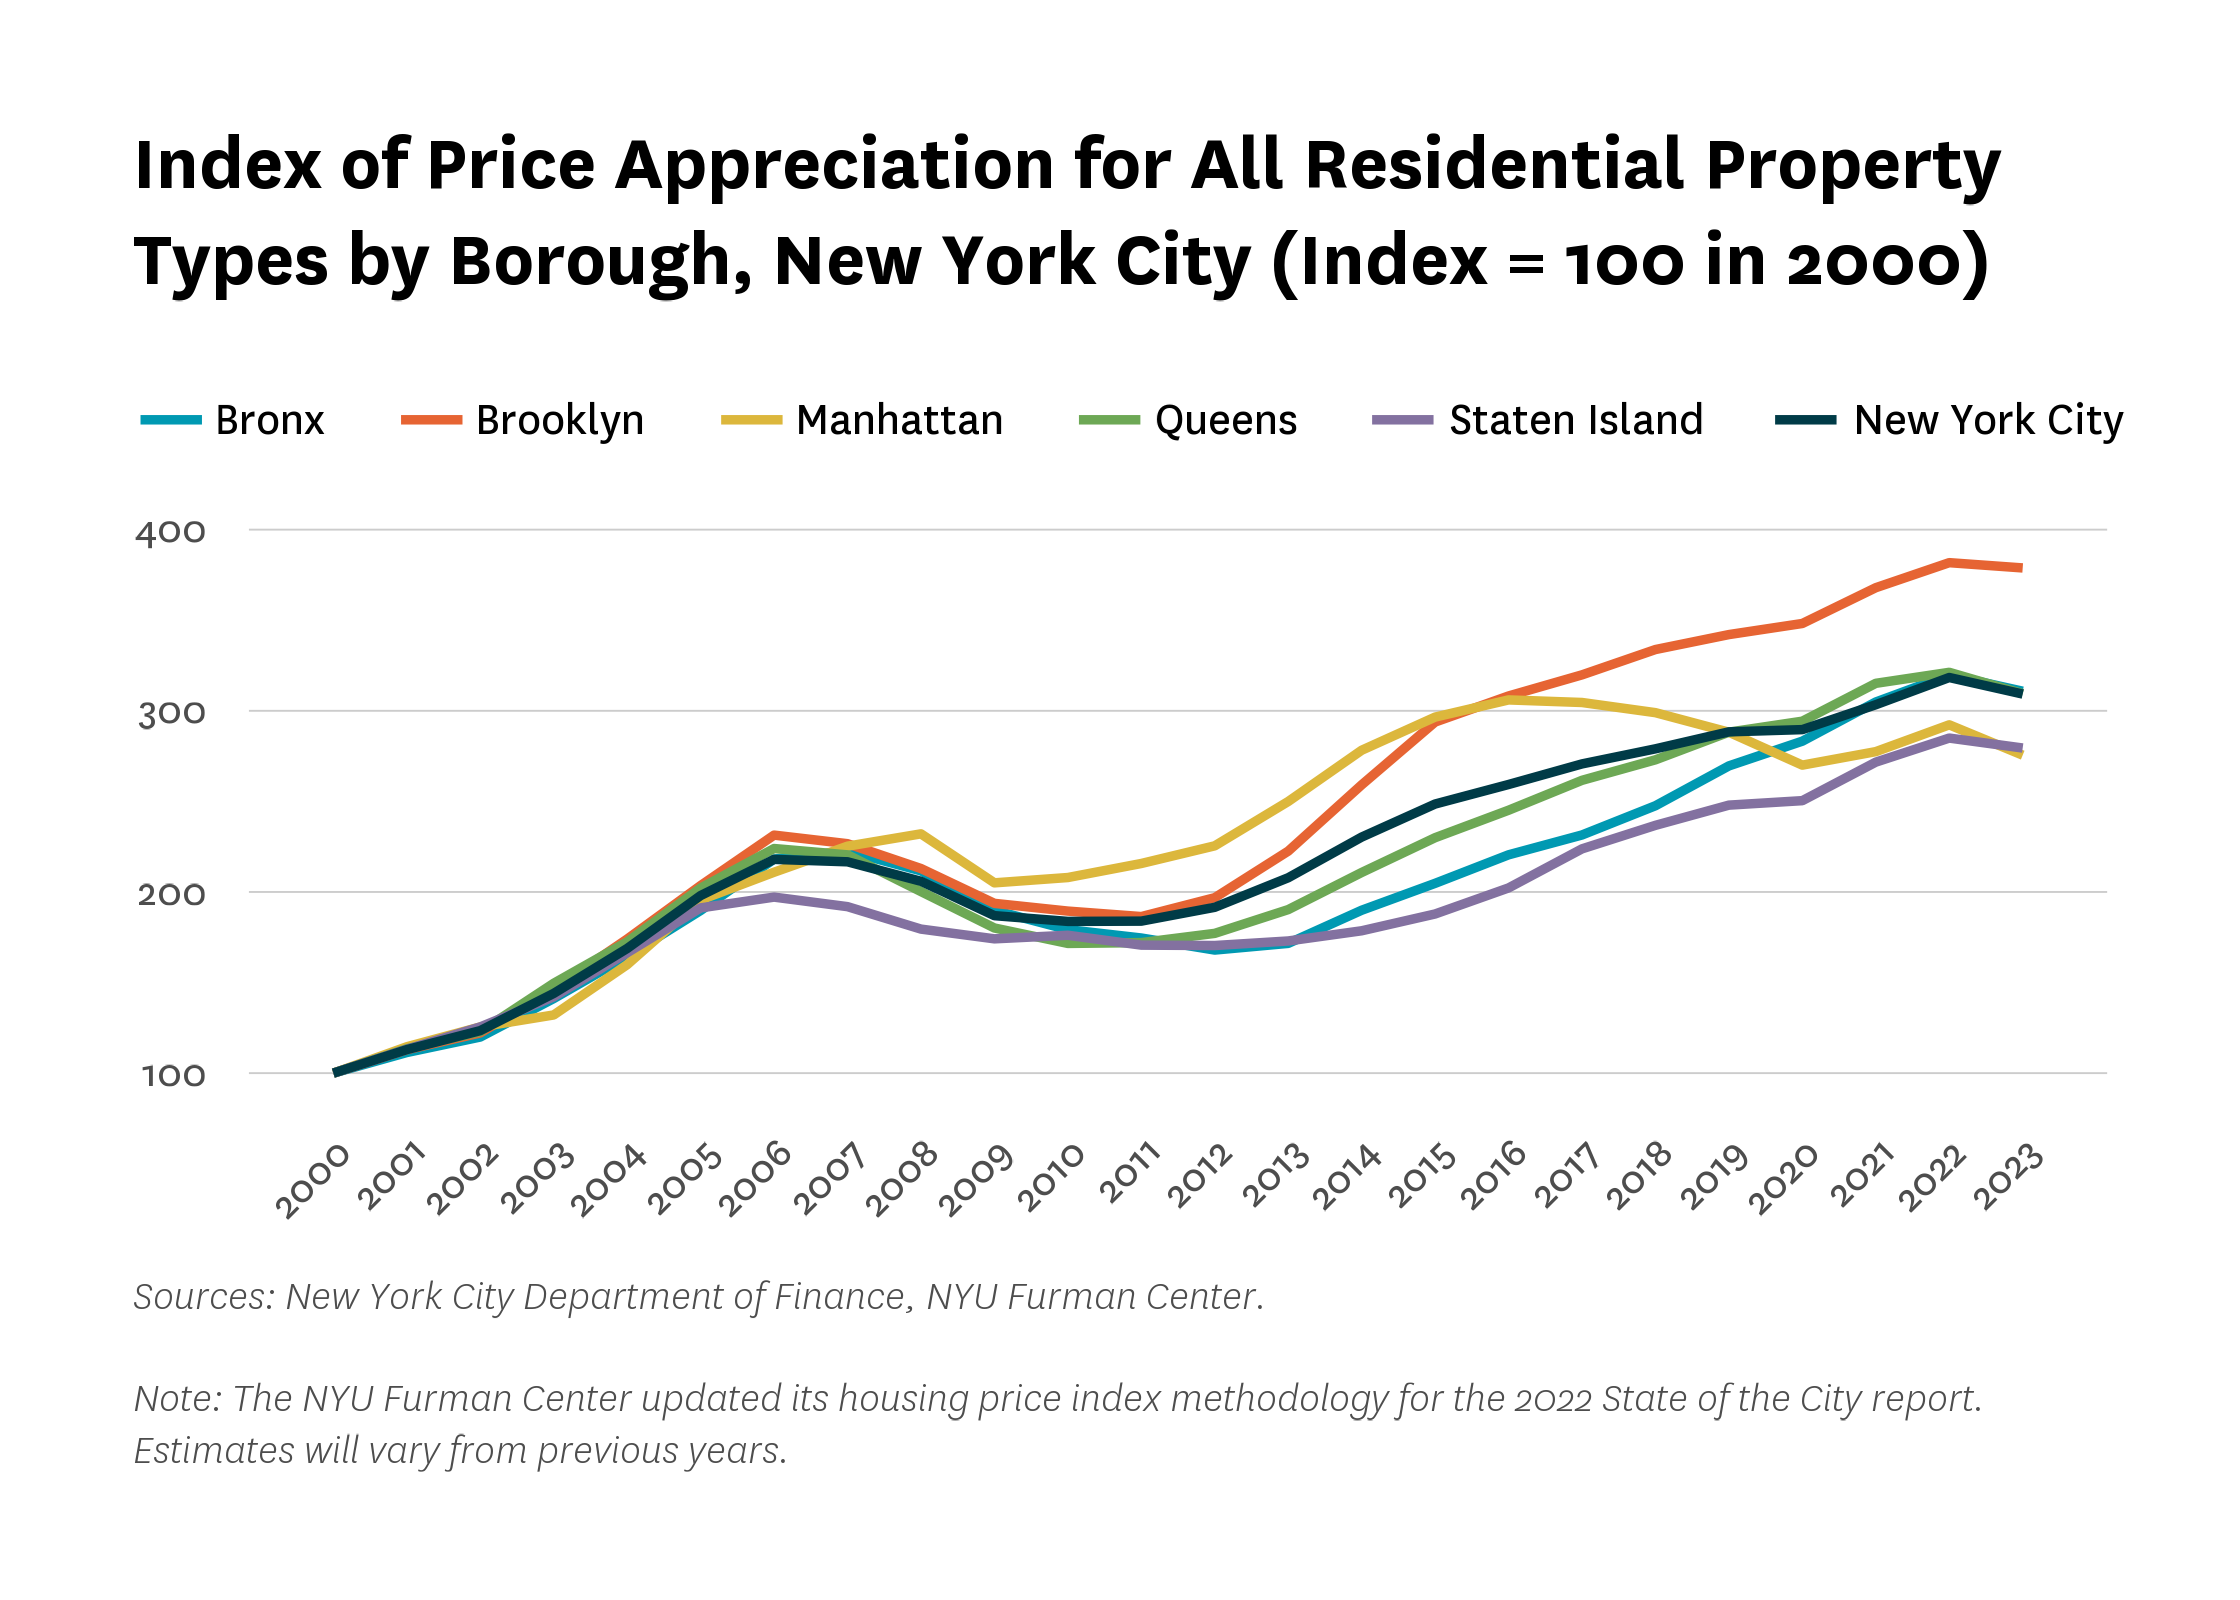
Despite a citywide dip in all residential property values in 2023, New York City’s real estate market has significantly appreciated since 2000.
Between 2022 and 2023, the indexed value for sales price of residential property (index = 100 in 2000) decreased by 9.1 percentage points across the city. Across the boroughs the index value decreased by 16.7 points in Manhattan, 9.0 percentage points in the Bronx, 2.9 percentage points in Brooklyn, 11.8 percentage points in Queens, and 5.5 percentage points in Staten Island. In aggregate, property values appreciated by an approximate factor of three since 2000, with the largest increase of all boroughs having occurred in Brooklyn (378.9% of the 2000 value in 2023). Brooklyn surpassed Manhattan in the middle part of the 2010-2020 decade, with Manhattan values actually declining and Brooklyn continuing to increase. In 2022, every borough except Manhattan experienced its highest property values since 2000. Despite the modest decreases in property values across the city in 2023, all four outer boroughs still have property values higher than any pre-2022 level. Since 2019, prior to the onset of COVID, the city overall experienced a 20.9 percentage point increase in index value, with the greatest increases in the Bronx and Brooklyn (41.2 and 36.9 percentage points), followed by Staten Island and Queens. (31.5 and 21.2 respectively). Manhattan’s property values in 2023 were 12.7 percentage points below pre-pandemic 2019 levels.
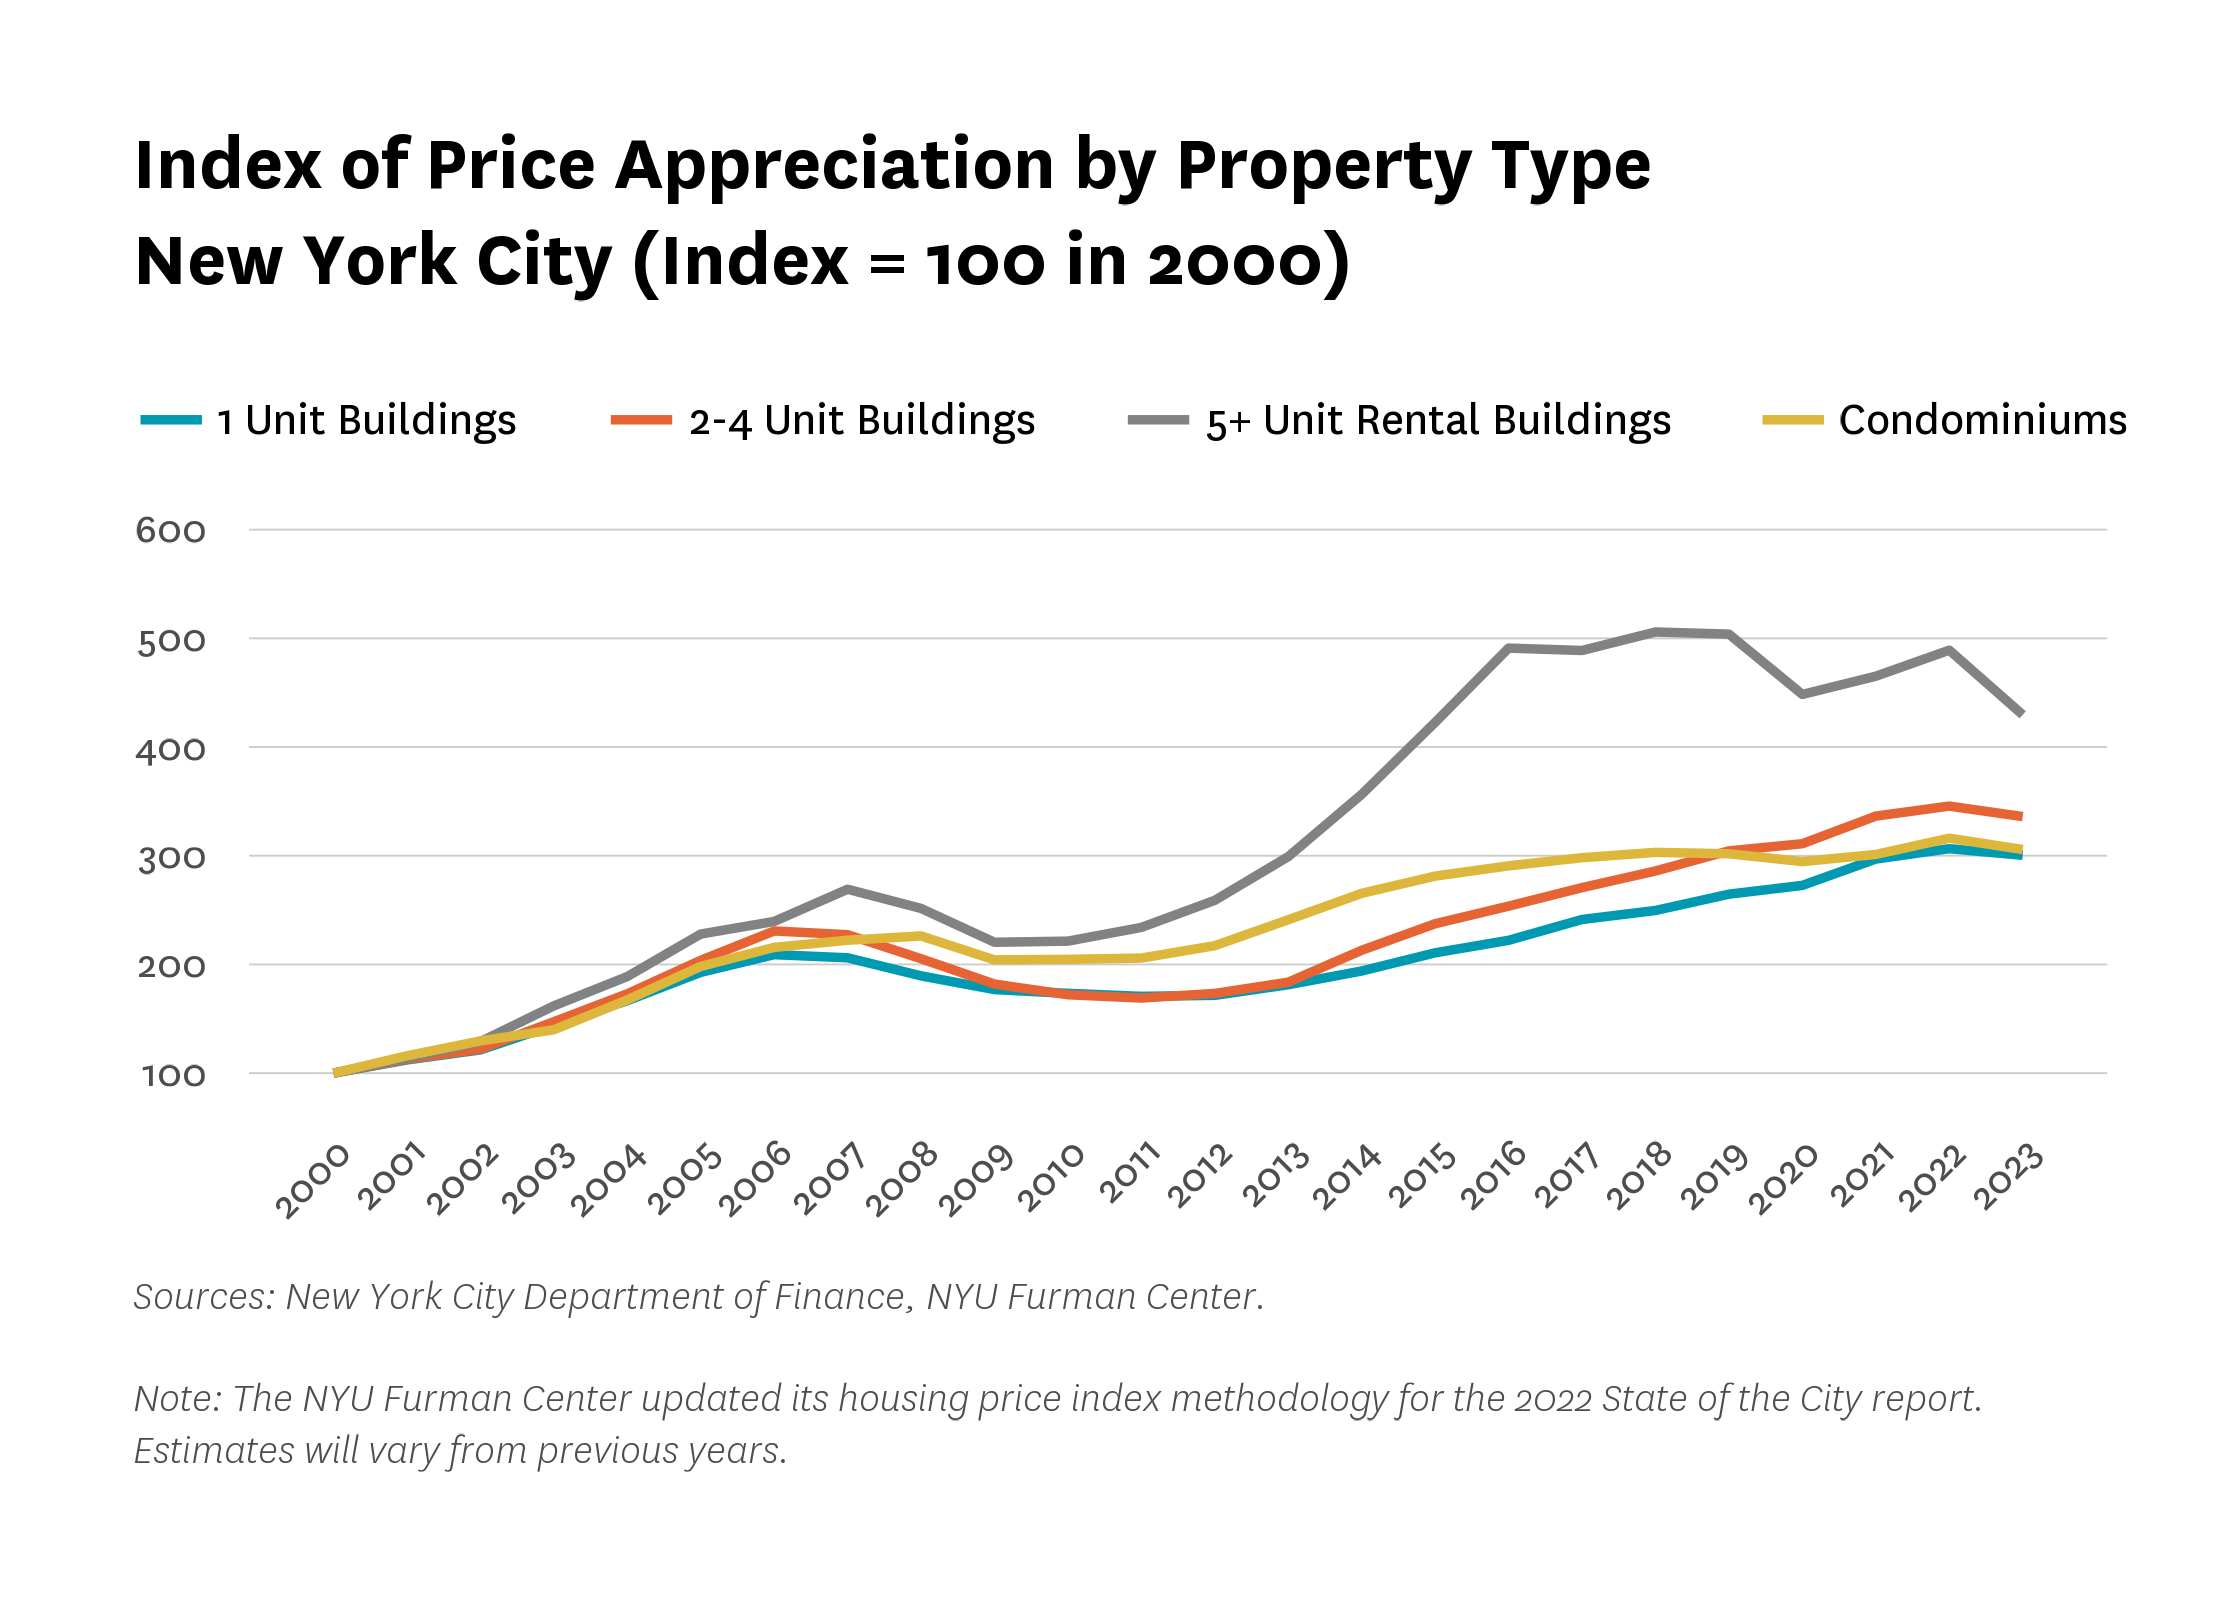
Rental buildings with 5 or more units experienced a relatively steep decline between 2022 and 2023, compared to other types of properties, but all sizes of rental buildings are up substantially since 2000.
Between 2022 and 2023, sales prices for properties with one unit, two to four units, and condominiums declined. This downturn broke a decade-long trend of fairly consistent price appreciation for smaller residential buildings. As for buildings with five or more units they saw a much sharper decrease in value in 2023 to the lowest relative level since 2015. Despite these more recent trends, between 2000 and 2023, buildings with one unit tripled in value, the smallest increase in value over that period, while buildings with five or more units more than quadrupled.
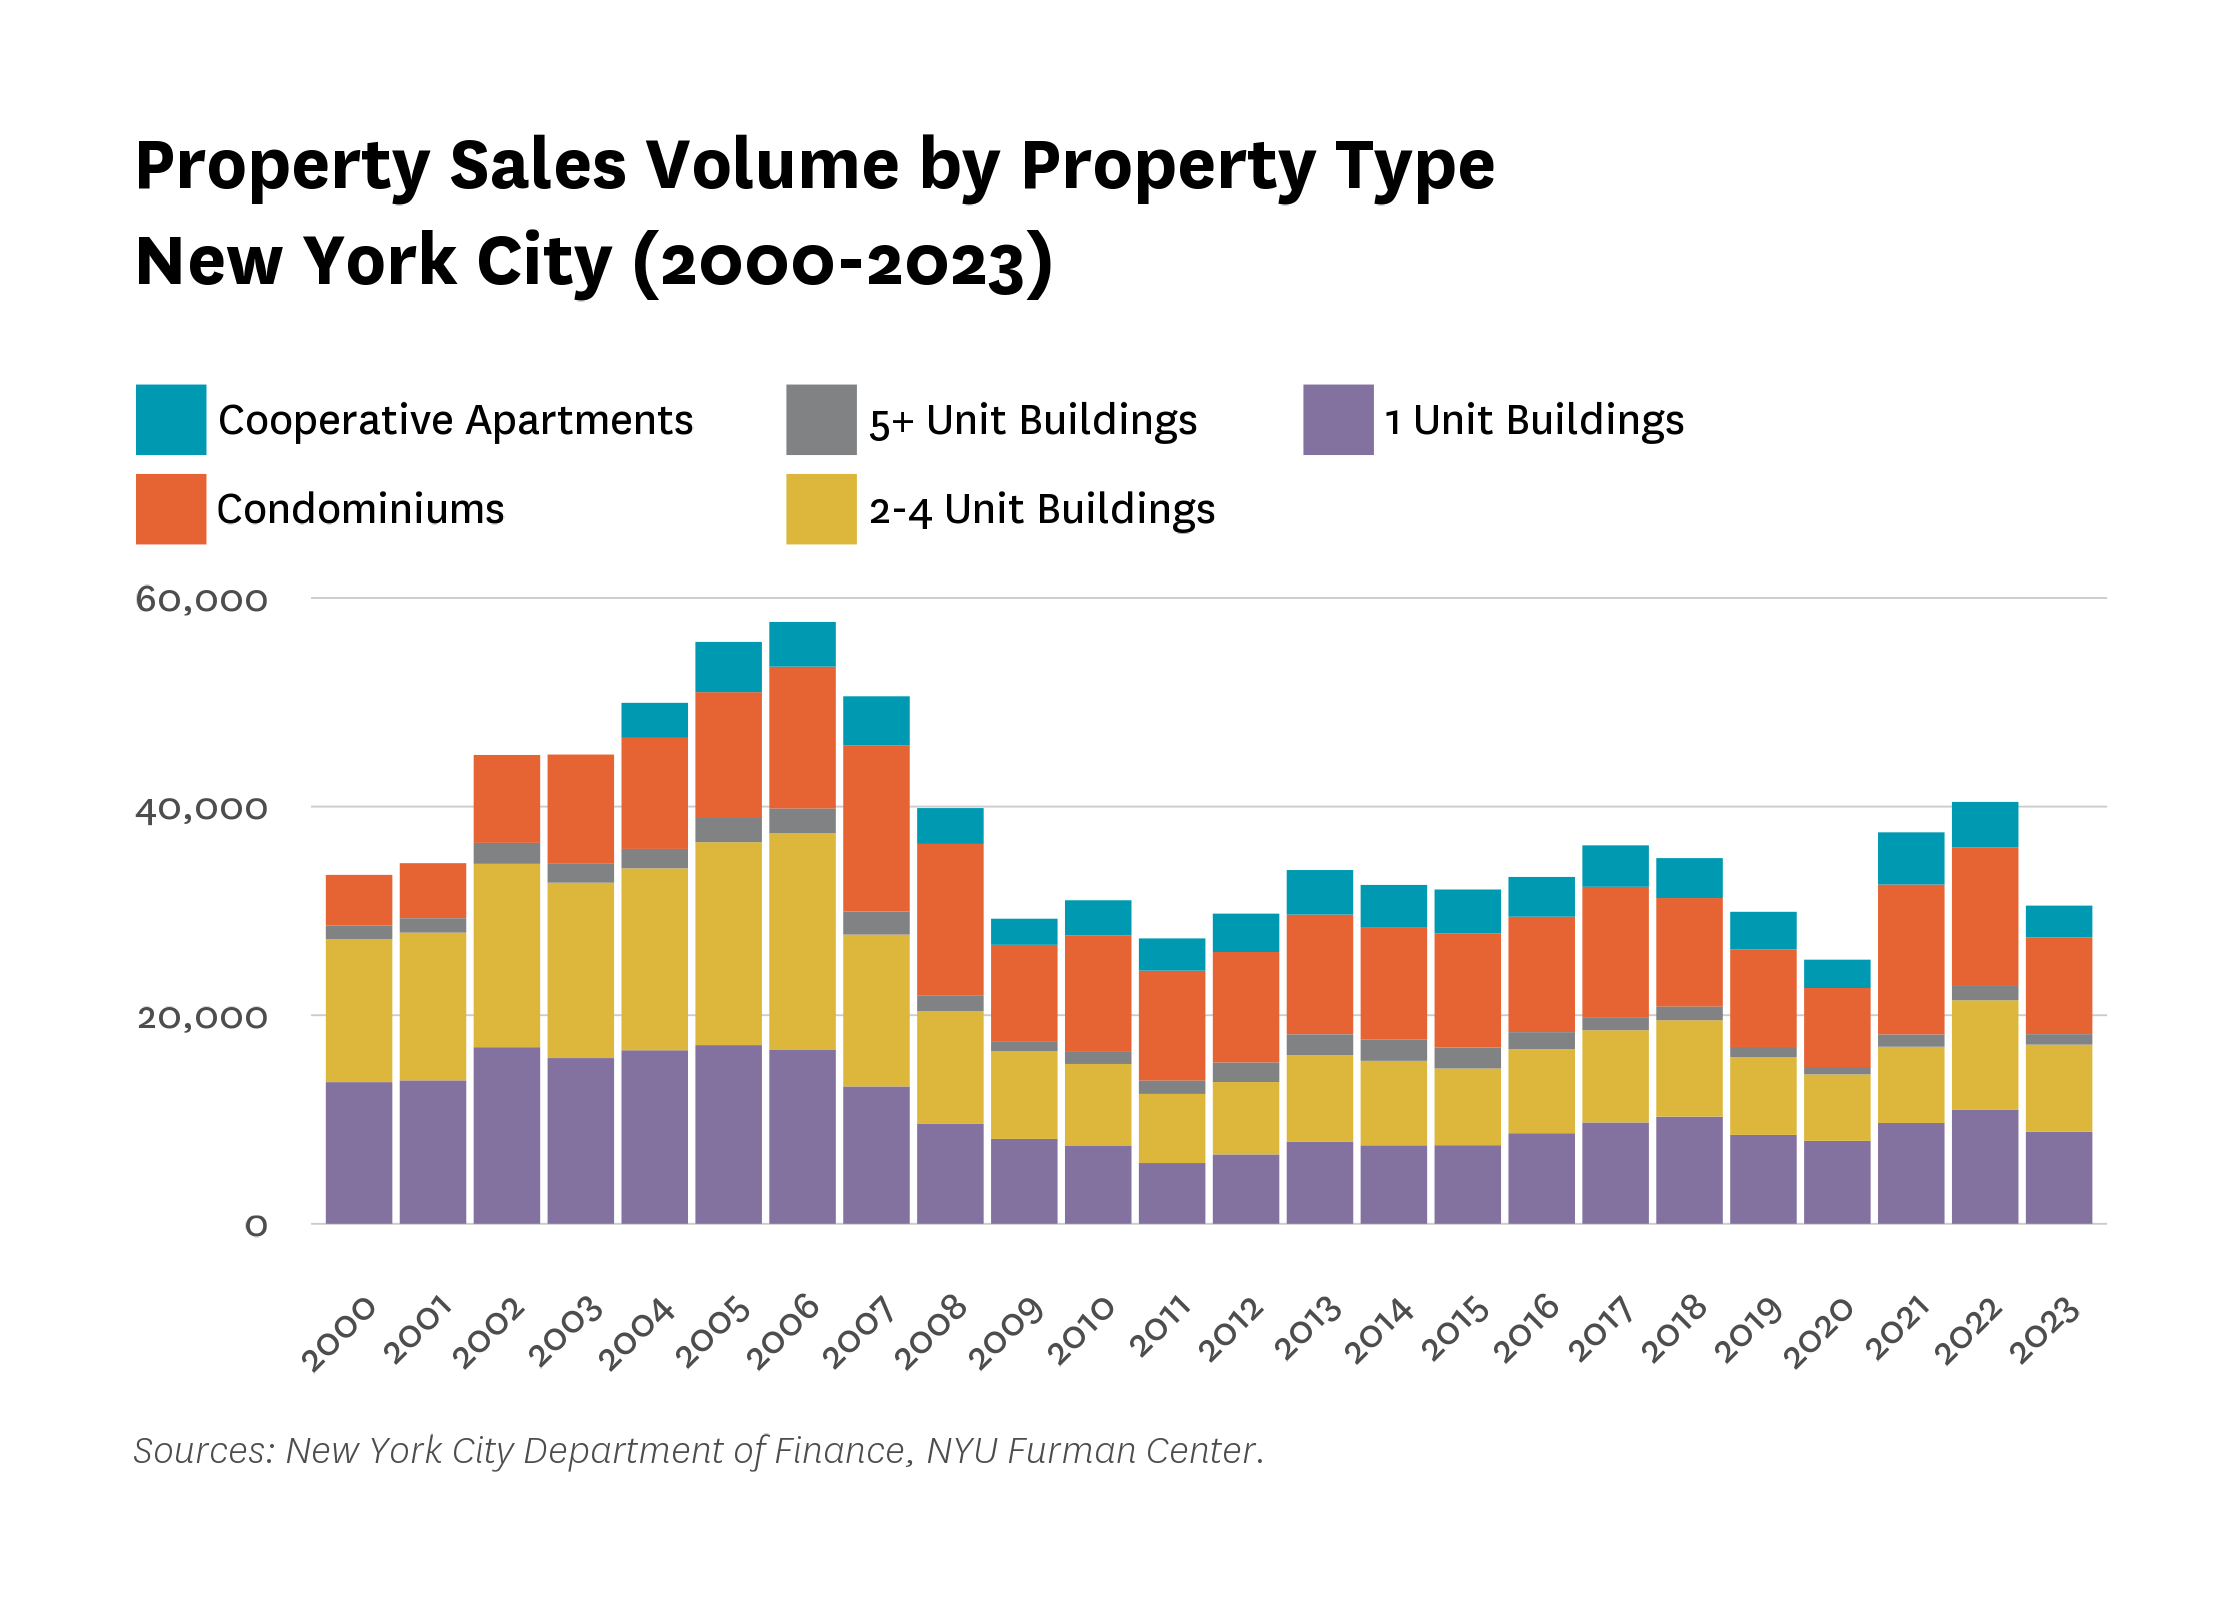
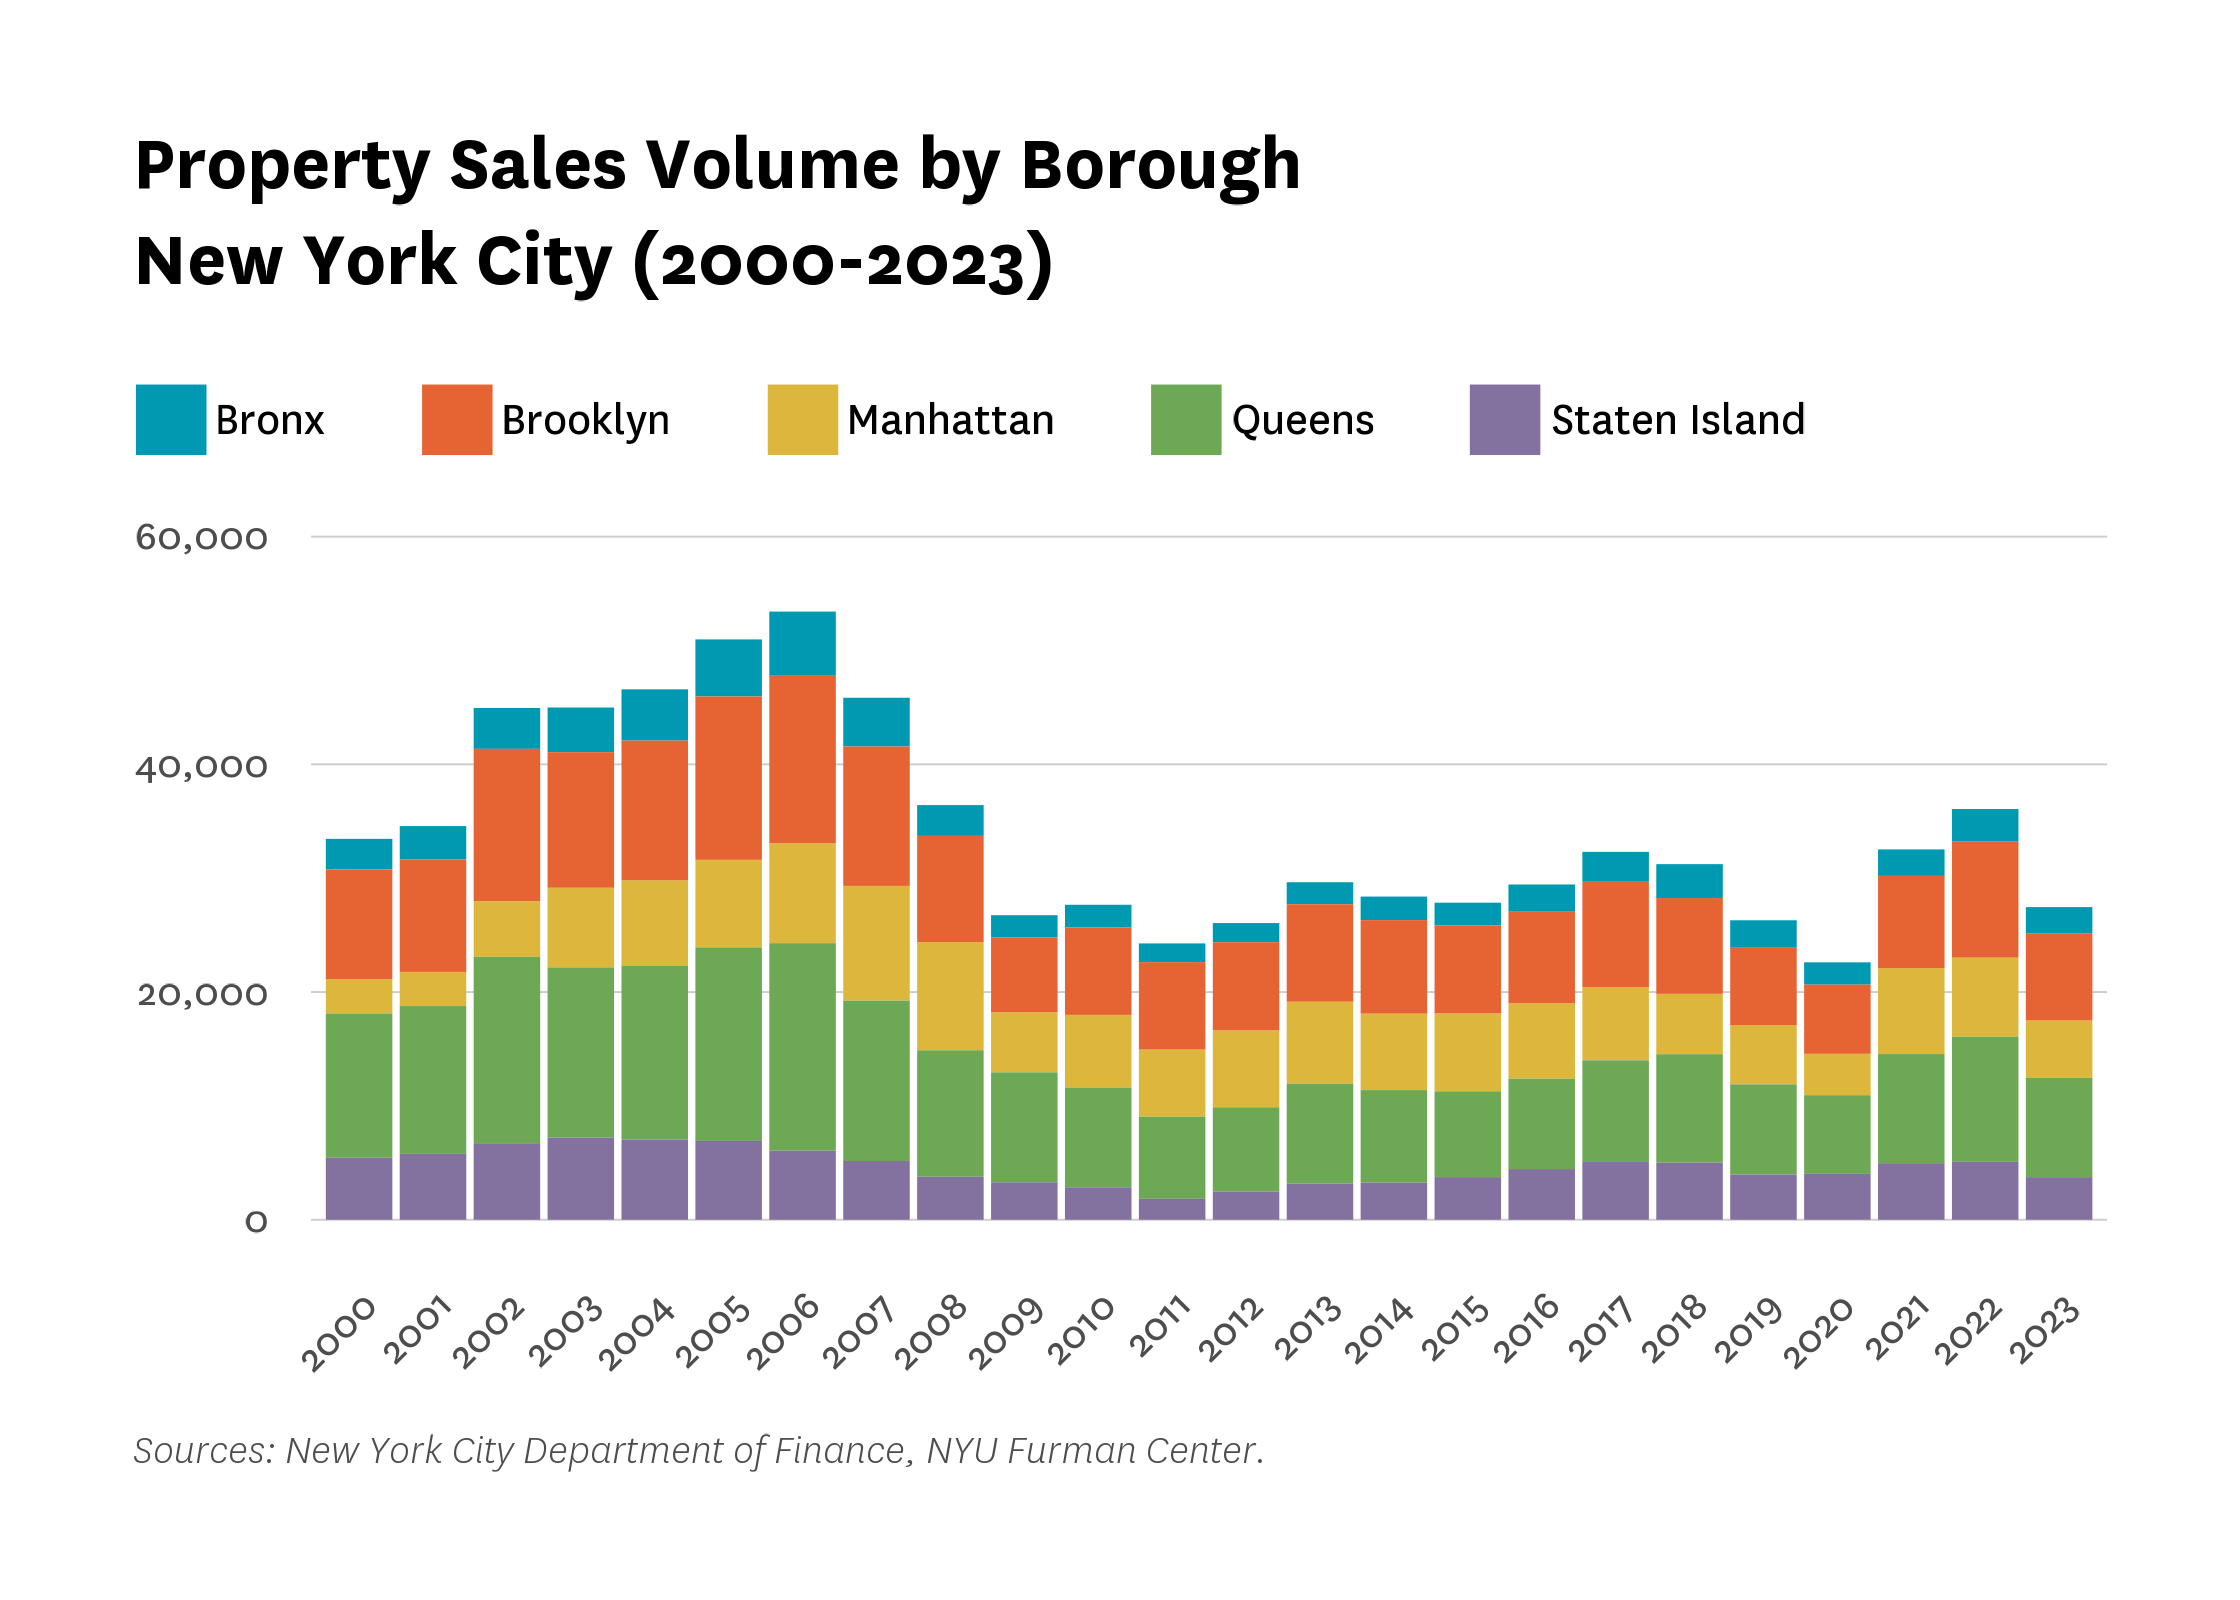
The volume of property sales fell back to the 2019 level, after dropping off across the city in 2020 and increasing in 2021 and 2022.
Citywide, the volume of sales decreased 23.9 percent between 2022 and 2023.
Of all boroughs, Manhattan experienced the greatest percent decrease in sales from the previous year (27.5%), from 6,942 to 5,036 units. Each of the five boroughs saw at least a 20 percent decrease in sales from 2022 to 2023. Since 2020, when sales across the city declined to the lowest level since the Furman Center started measuring this figure in 2000, sales increased over the next two years; 2022 saw the highest sales volume since 2008. The decrease in sales from 2022 to 2023 brought sales volume more in line with pre-pandemic 2019 numbers.
Between 2022 and 2023, the volume of residential property sales decreased for all types of units
The total volume of property sales for all property types declined between 2018 and 2020, increased year over year in both 2021 and 2022, and then decreased again in 2023. Between 2022 to 2023, cooperative apartments saw the sharpest decline in sales, declining from 4,374 to 3,047 (30.3%). One unit buildings saw the least severe decline, falling from 10,922 to 8,834 (19.1%).