
State of Renters and Their Homes
In this section, we explore what the most recent administrative and census data reveal about both long-term and short-term changes in New York City’s rental market. In most cases, administrative data goes through 2023 and census data through 2022. As of the end of 2023, eviction filings have steadily increased since the end of the eviction moratorium, yet they still remain below pre-pandemic levels. The rate of Housing Code Violations issued by the Department of Housing Preservation and Development has continued a persistent increase, with a 23 percent increase from 2022 to 2023. Other key housing metrics are delayed but still provide valuable insights into market trends. From 2007 to 2019, increases in median gross rent generally outpaced the growth of median renter household income (indexed to 2007). However, this gap began to close in the latter half of the 2010s. A decrease in renter incomes in 2021, coupled with a continued rise in rents, widened the gap again. This gap narrowed in 2022 due to an increase in median renter household income. These shifts in trends could be attributed to actual declines in renter household incomes or a shift in the composition of renter households, possibly due to higher-income households leaving the city during the pandemic. Overall, data indicate that 2022 was a year in which New York City’s rental market strengthened relative to the downturn in 2020 and 2021.
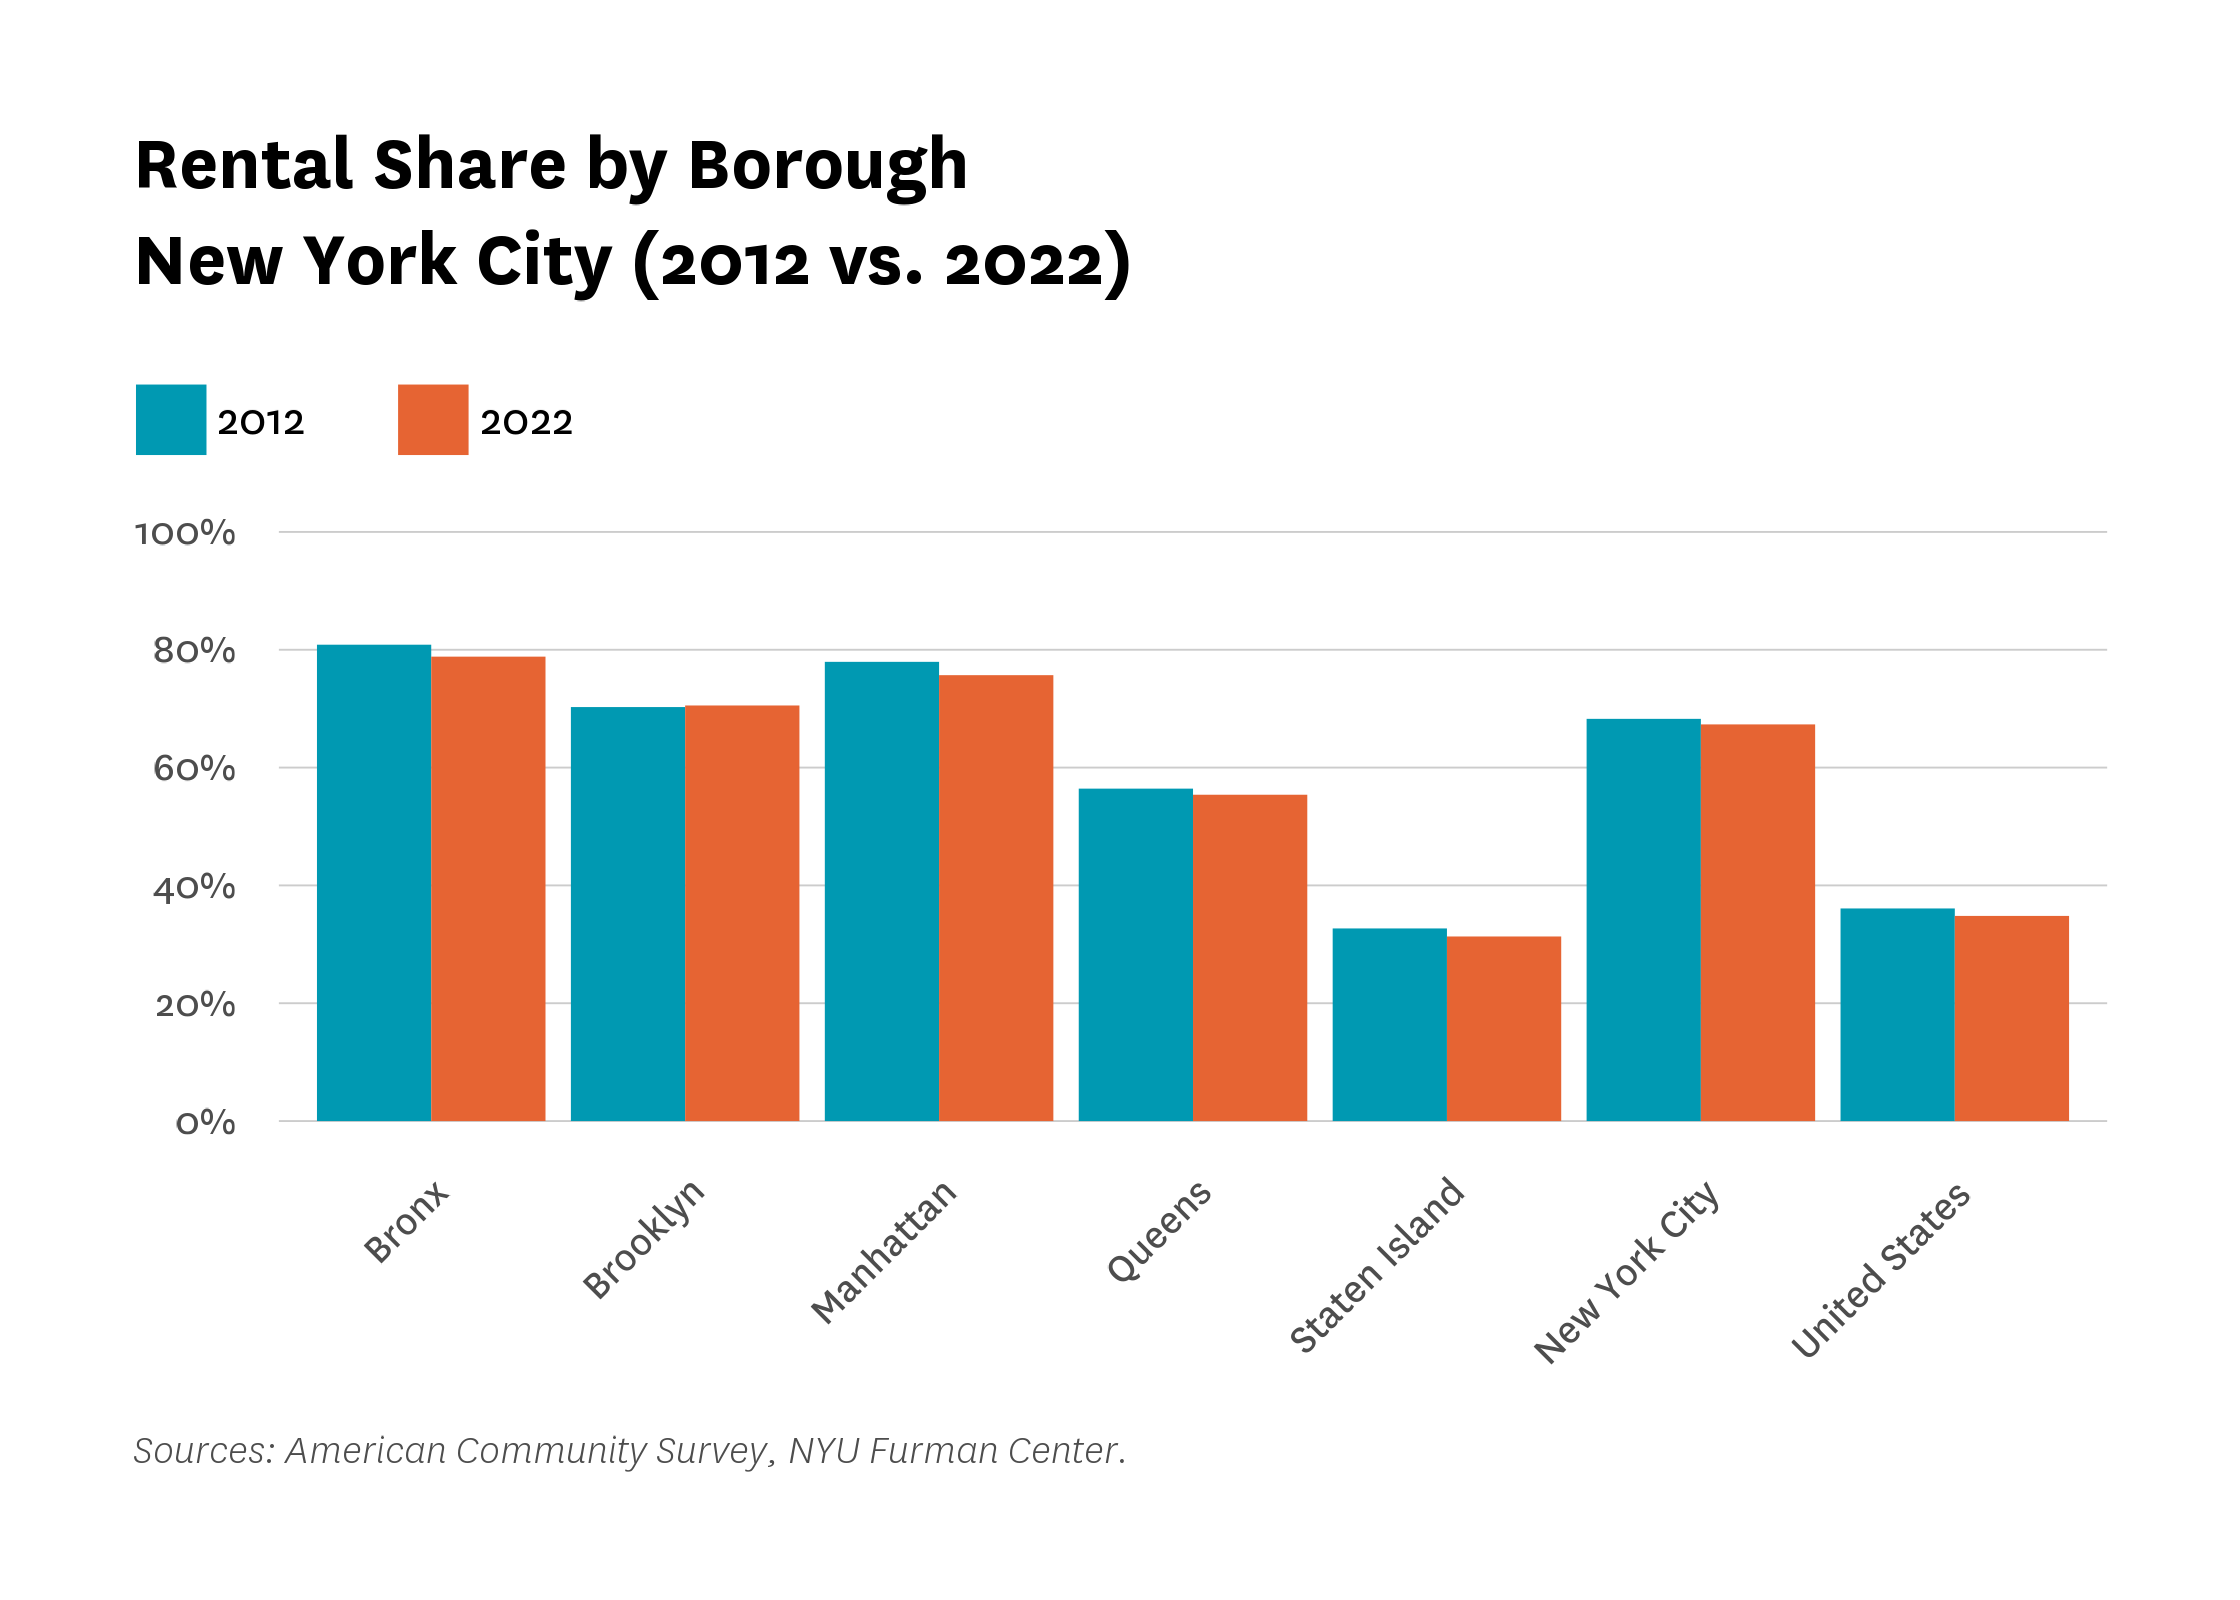
The overall share of New York City households who are renters declined between 2012 to 2022, three quarters of the national rate decline.
The share of households that live in rental units in New York City decreased by 1.0 percentage point from 2012 to 2022 (from 68.3% to 67.3%, respectively). This trend mirrors the nationwide one, albeit at a slightly smaller magnitude. The Bronx, the borough with the highest share of renters, had the second largest decrease in rental share (from 80.9% to 78.8%). Meanwhile, Staten Island, the borough with the lowest share of renters, experienced a decline in rental share in line with the national average (with a decrease of 1.4 percentage points). The borough that experienced the largest decline in the share of rental households was Manhattan, where the rate of households in rental units declined from 77.9 percent in 2012 to 75.7 percent in 2022. While these trends show that a slightly lower share of households were renters in 2022 compared to 2012, the movement has not been dramatic. New York City remains a majority-renter city: two-thirds of households in New York City are renter households.
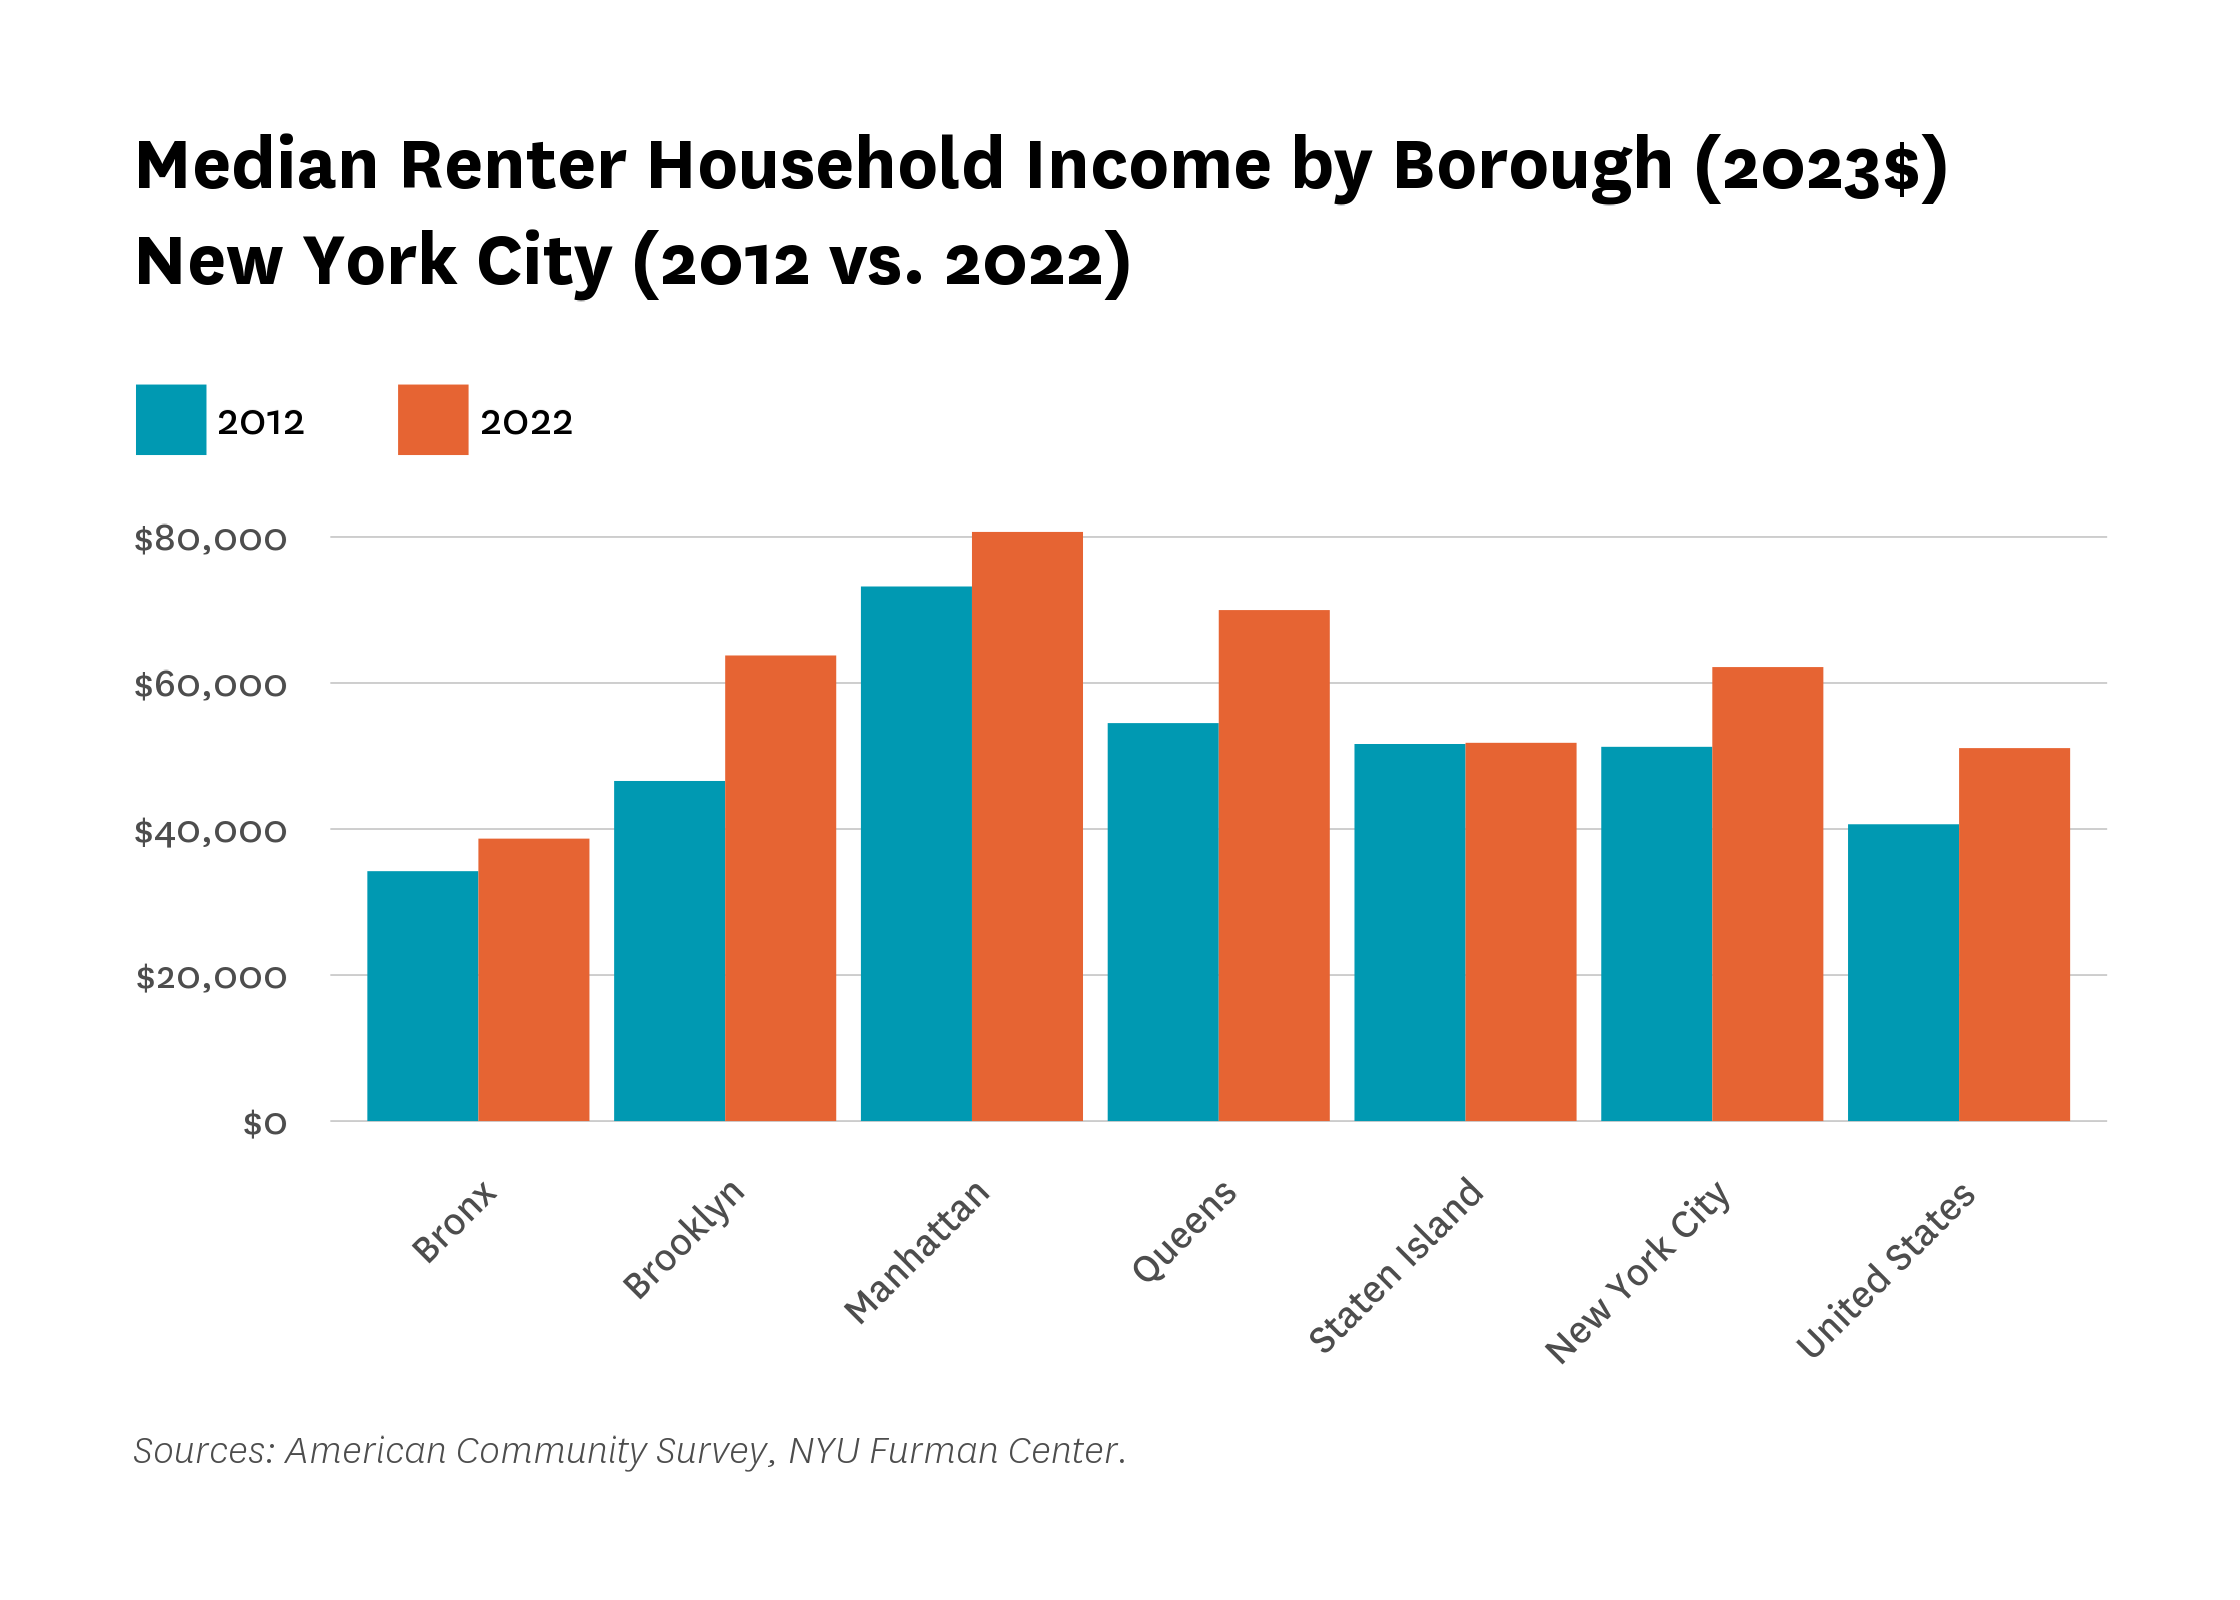
New York City’s median renter household income increased 21.3 percent in real terms between 2012 and 2022, with the largest increase of all boroughs taking place in Brooklyn.
The median New York City renter household income was $62,181 in 2022. In a 10-year period, median income increased by 21.3 percent ($10,922) since 2012, after adjusting for inflation. This is a smaller percent change than on the national level: from 2012 to 2022, the national median renter household income increased by 25.7 percent. Among New York City boroughs, Brooklyn experienced the largest percent change while Staten Island experienced the smallest (36.9% and 0.31%, respectively). The increase in median renter household income might reflect higher income renters being left out of the homeownership market due to high home prices, or it might also be a signal that the economy has strengthened since 2012. Regardless of the underlying reasons, renter households today have higher incomes than they did a decade ago, both throughout the city and in each borough.
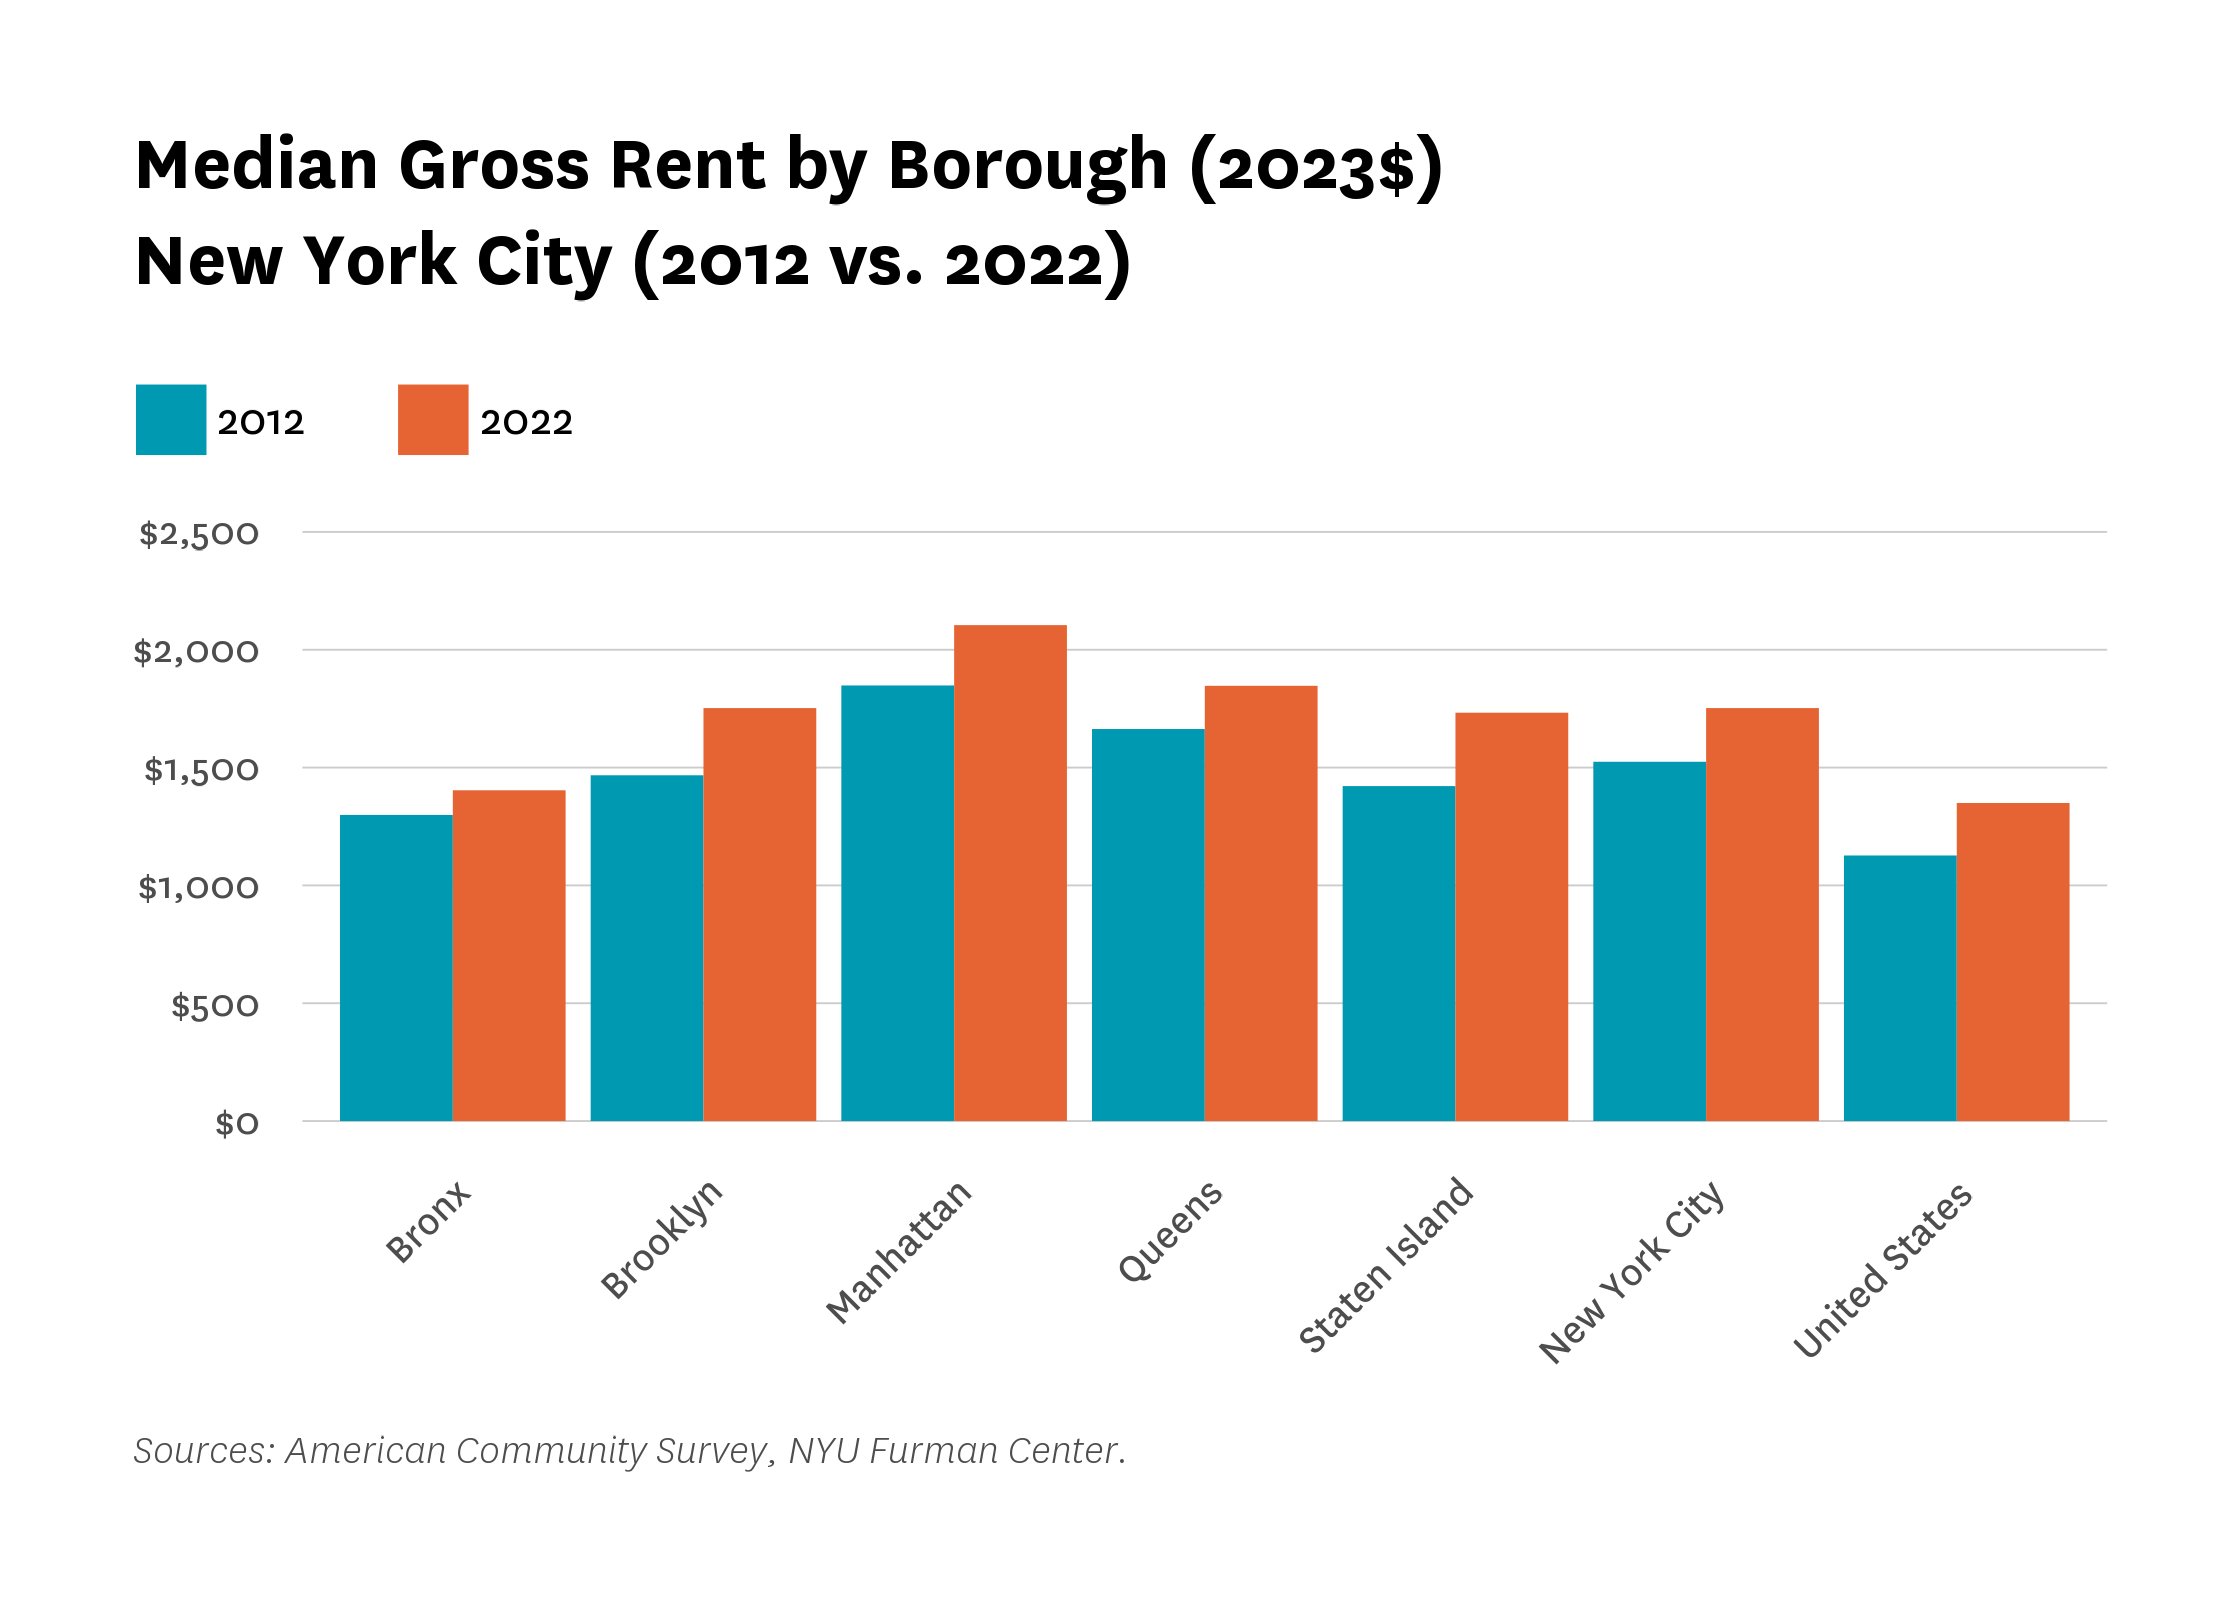
Between 2012 and 2022, the increase in New York City’s median gross rent was lower than at the national level after adjusting for inflation.
“Gross rent” refers to the legal rent charged on a lease prior to any concessions, plus estimated electricity and heating costs. In New York City, the median gross rent, after adjusting for inflation, increased by 15.0 percent between 2012 and 2022, compared to 19.8 percent nationwide. Manhattan remains the borough with the highest median gross rent, but Staten Island saw the highest rate of increase: median rents increased from $1,421 in 2012 to $1,733 in 2022 (22%). The Bronx remains the borough with the lowest median gross rent, and experienced a rate of increase similar to that in Queens over the past decade (8.1 percent and 11.0 percent, respectively).
Between 2021 and 2022, building owners reported that collected rent in buildings with at least one rent regulated unit decreased in some parts of the Bronx, but increased in many areas of the other boroughs.
The pandemic and economic shutdown dramatically impacted New York City’s rental market in 2020 and 2021. Data from the recently released 2024 Rent Guidelines Board Income and Expense study (which examines 2022 data) shows that between 2021 and 2022, collected rent in buildings with at least one rent regulated unit decreased across some areas in the Bronx and increased across many areas in Manhattan, Brooklyn, the Bronx, Queens, and Staten Island. These comparisons are not adjusted for inflation and reflect a combination of year-over-year changes in rent levels, vacancy levels, and in arrears that accrue due to the non-payment of rent. This differs from trends identified in last year’s report (which was based on data from 2020 to 2021). The RGB looks at trends in buildings with at least one rent regulated unit. Perhaps confusingly, this includes buildings in which the share of rent regulated units is so low that the building operates like a fully market rate rental, as well as newly constructed buildings with rent levels at the market rate. As a result, these geographic differences are more likely indications of where the market experienced varying levels of recovery after the pandemic’s greatest effects. With collected rents decreasing by 5.8 percent between 2021 and 2022, Belmont/East Tremont saw the greatest decrease in collected rents within buildings with at least one rent regulated unit. Greenwich Village/Soho, Stuyvesant Town/Turtle Bay, and the Upper East Side saw the highest increases in collected rent (16.3%, 15.9% and 15.2%, respectively).
Change in Rent Collection for Buildings with Rent Regulated Units By Community District, New York City (2021-2022)
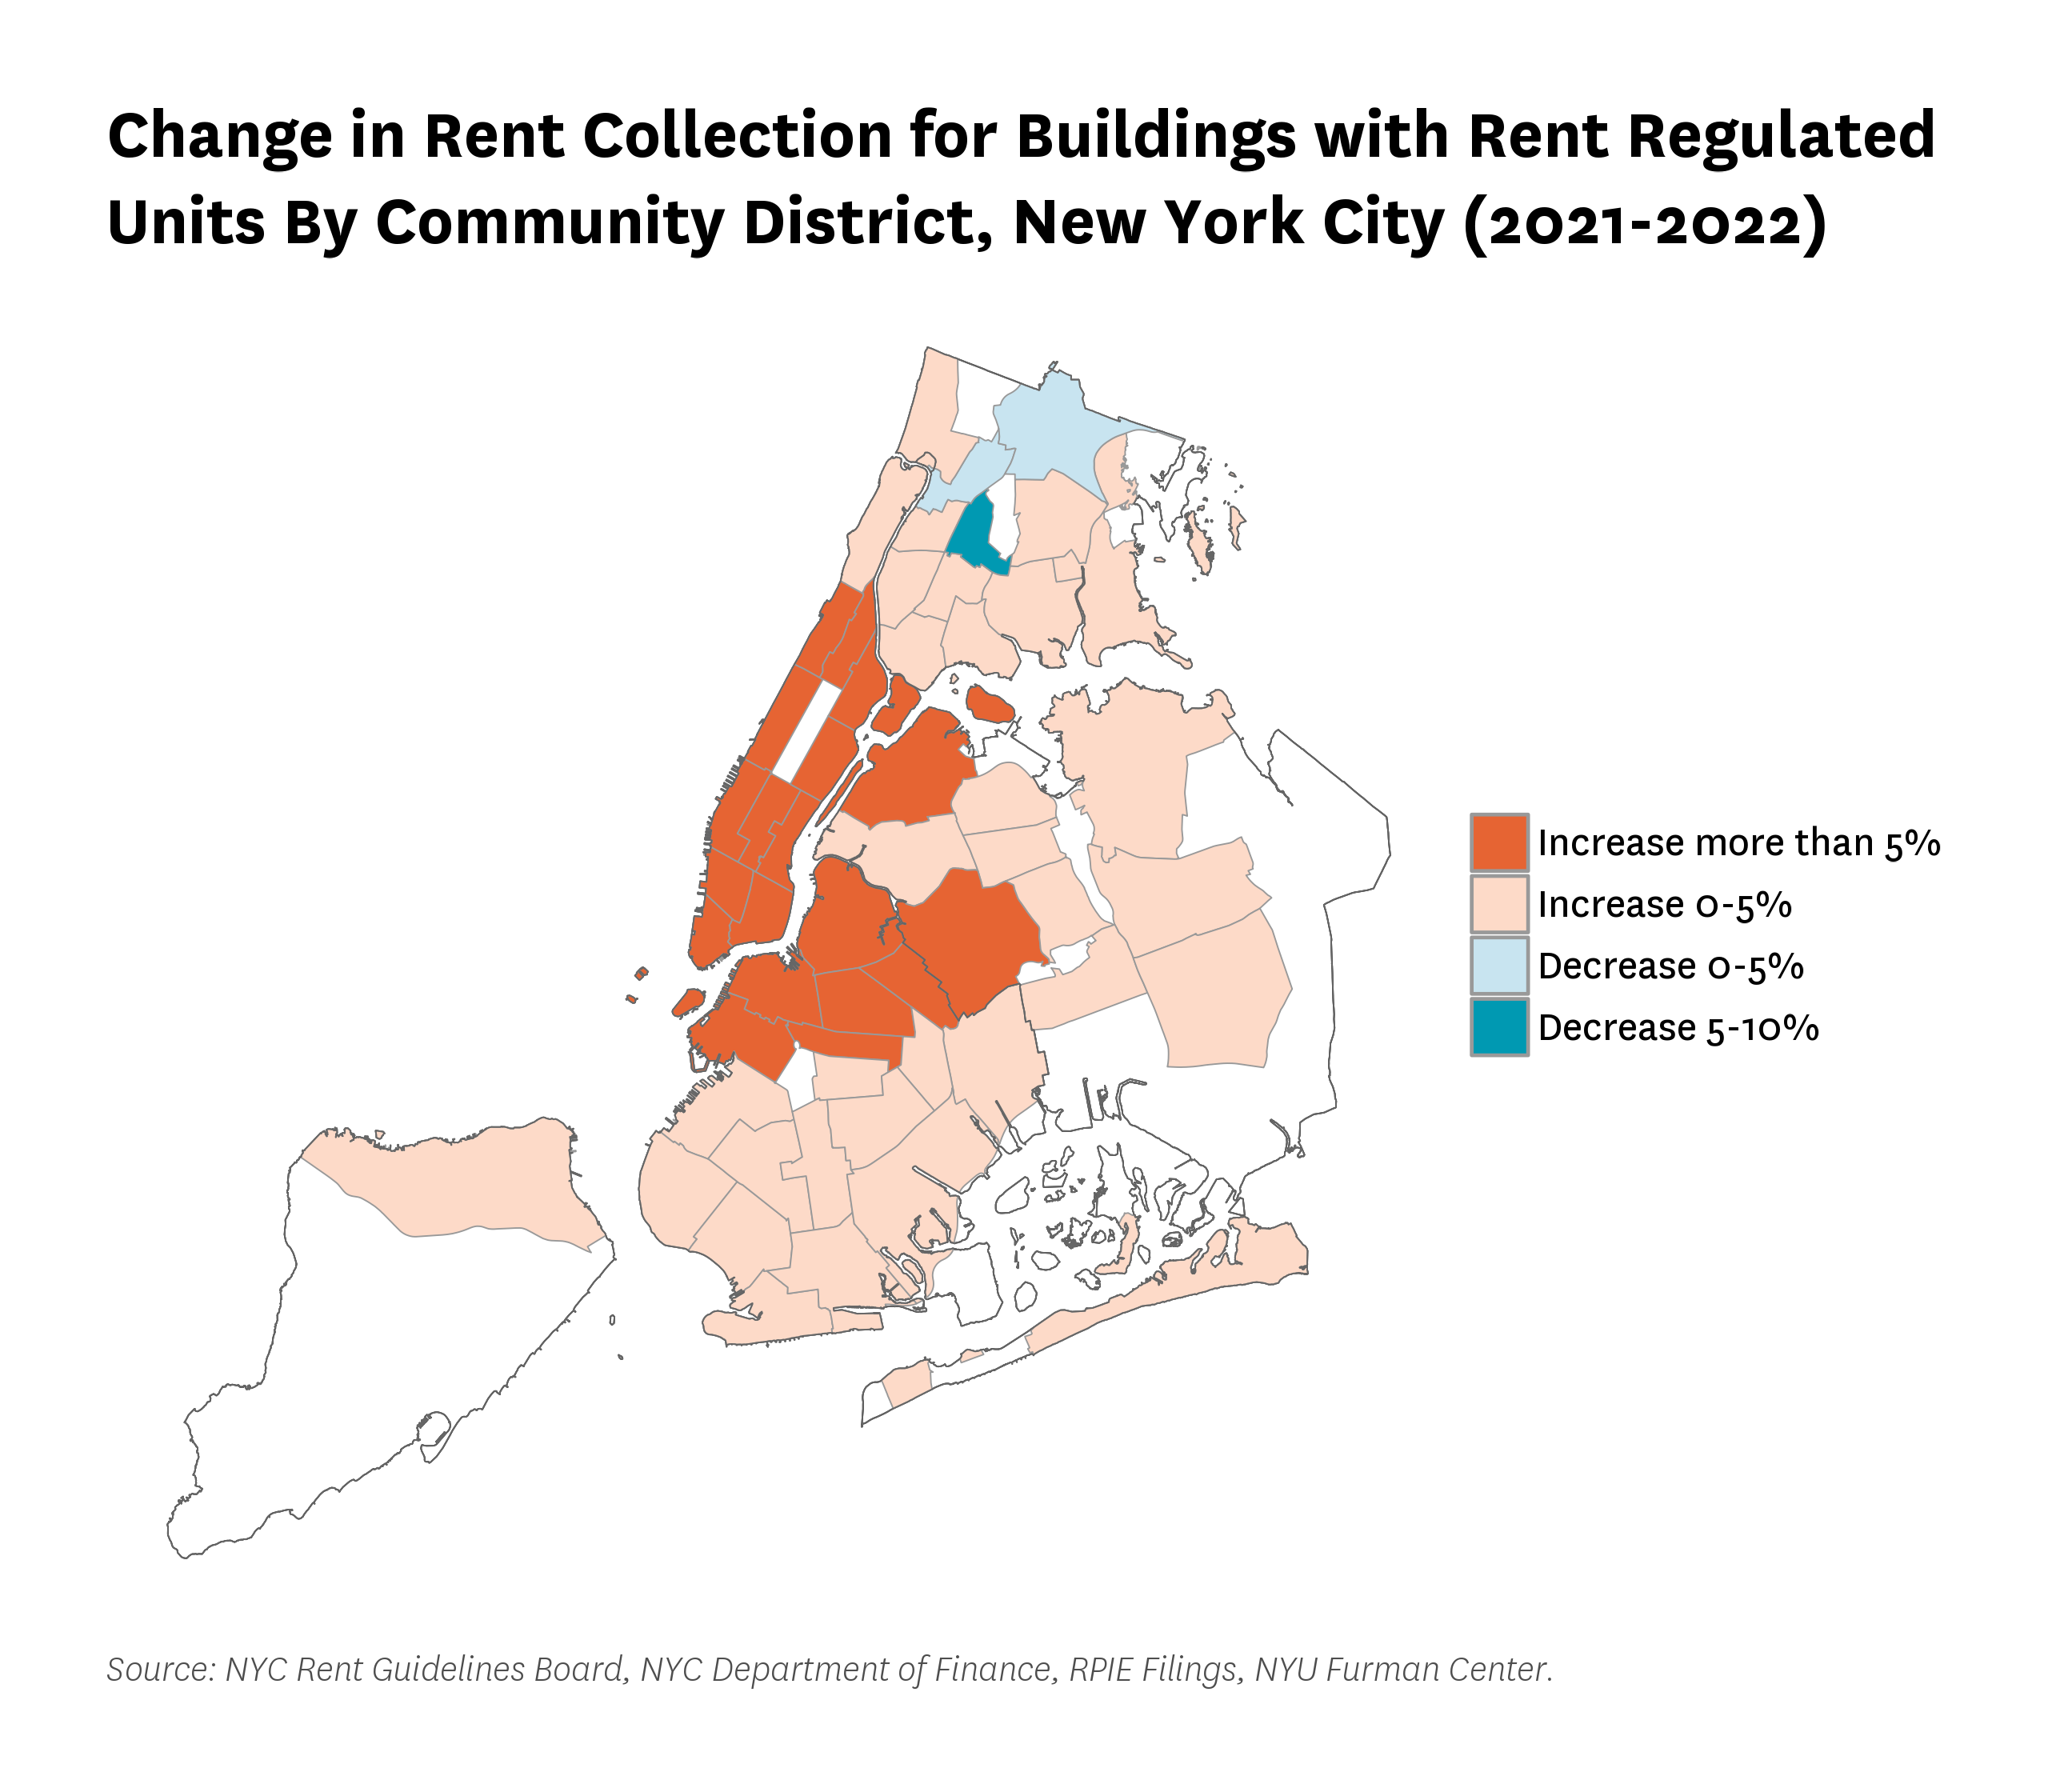
Sources: NYC Rent Guidelines Board, NYC Department of Finance, RPIE Filings, NYU Furman Center.
According to StreetEasy data, the median asking rent increased in most community districts between 2021 and 2022, with a notable cluster of community districts in the Bronx that experienced a decrease in median asking rent.
“Asking rent” refers to the rent building owners quote when advertising units available on the market. Among New York City’s 59 community districts, only 11 experienced decreases in median asking rents between 2021 to 2022. Of these 11, nine are located in the Bronx. The community districts with the three greatest increases in median asking rent from 2021 to 2022 are located in Manhattan and Brooklyn: Lower East Side/Chinatown, Greenwich Village/Soho, and Greenpoint/Williamsburg (with increases of 30%, 29%, and 29% each). These data are not necessarily representative of the full range of New York City’s market because they only cover the types of apartments listed on StreetEasy. For that reason they should be interpreted with caution.
Change in Median Asking Rent (2023$) By Community District, New York City (2021-2022)
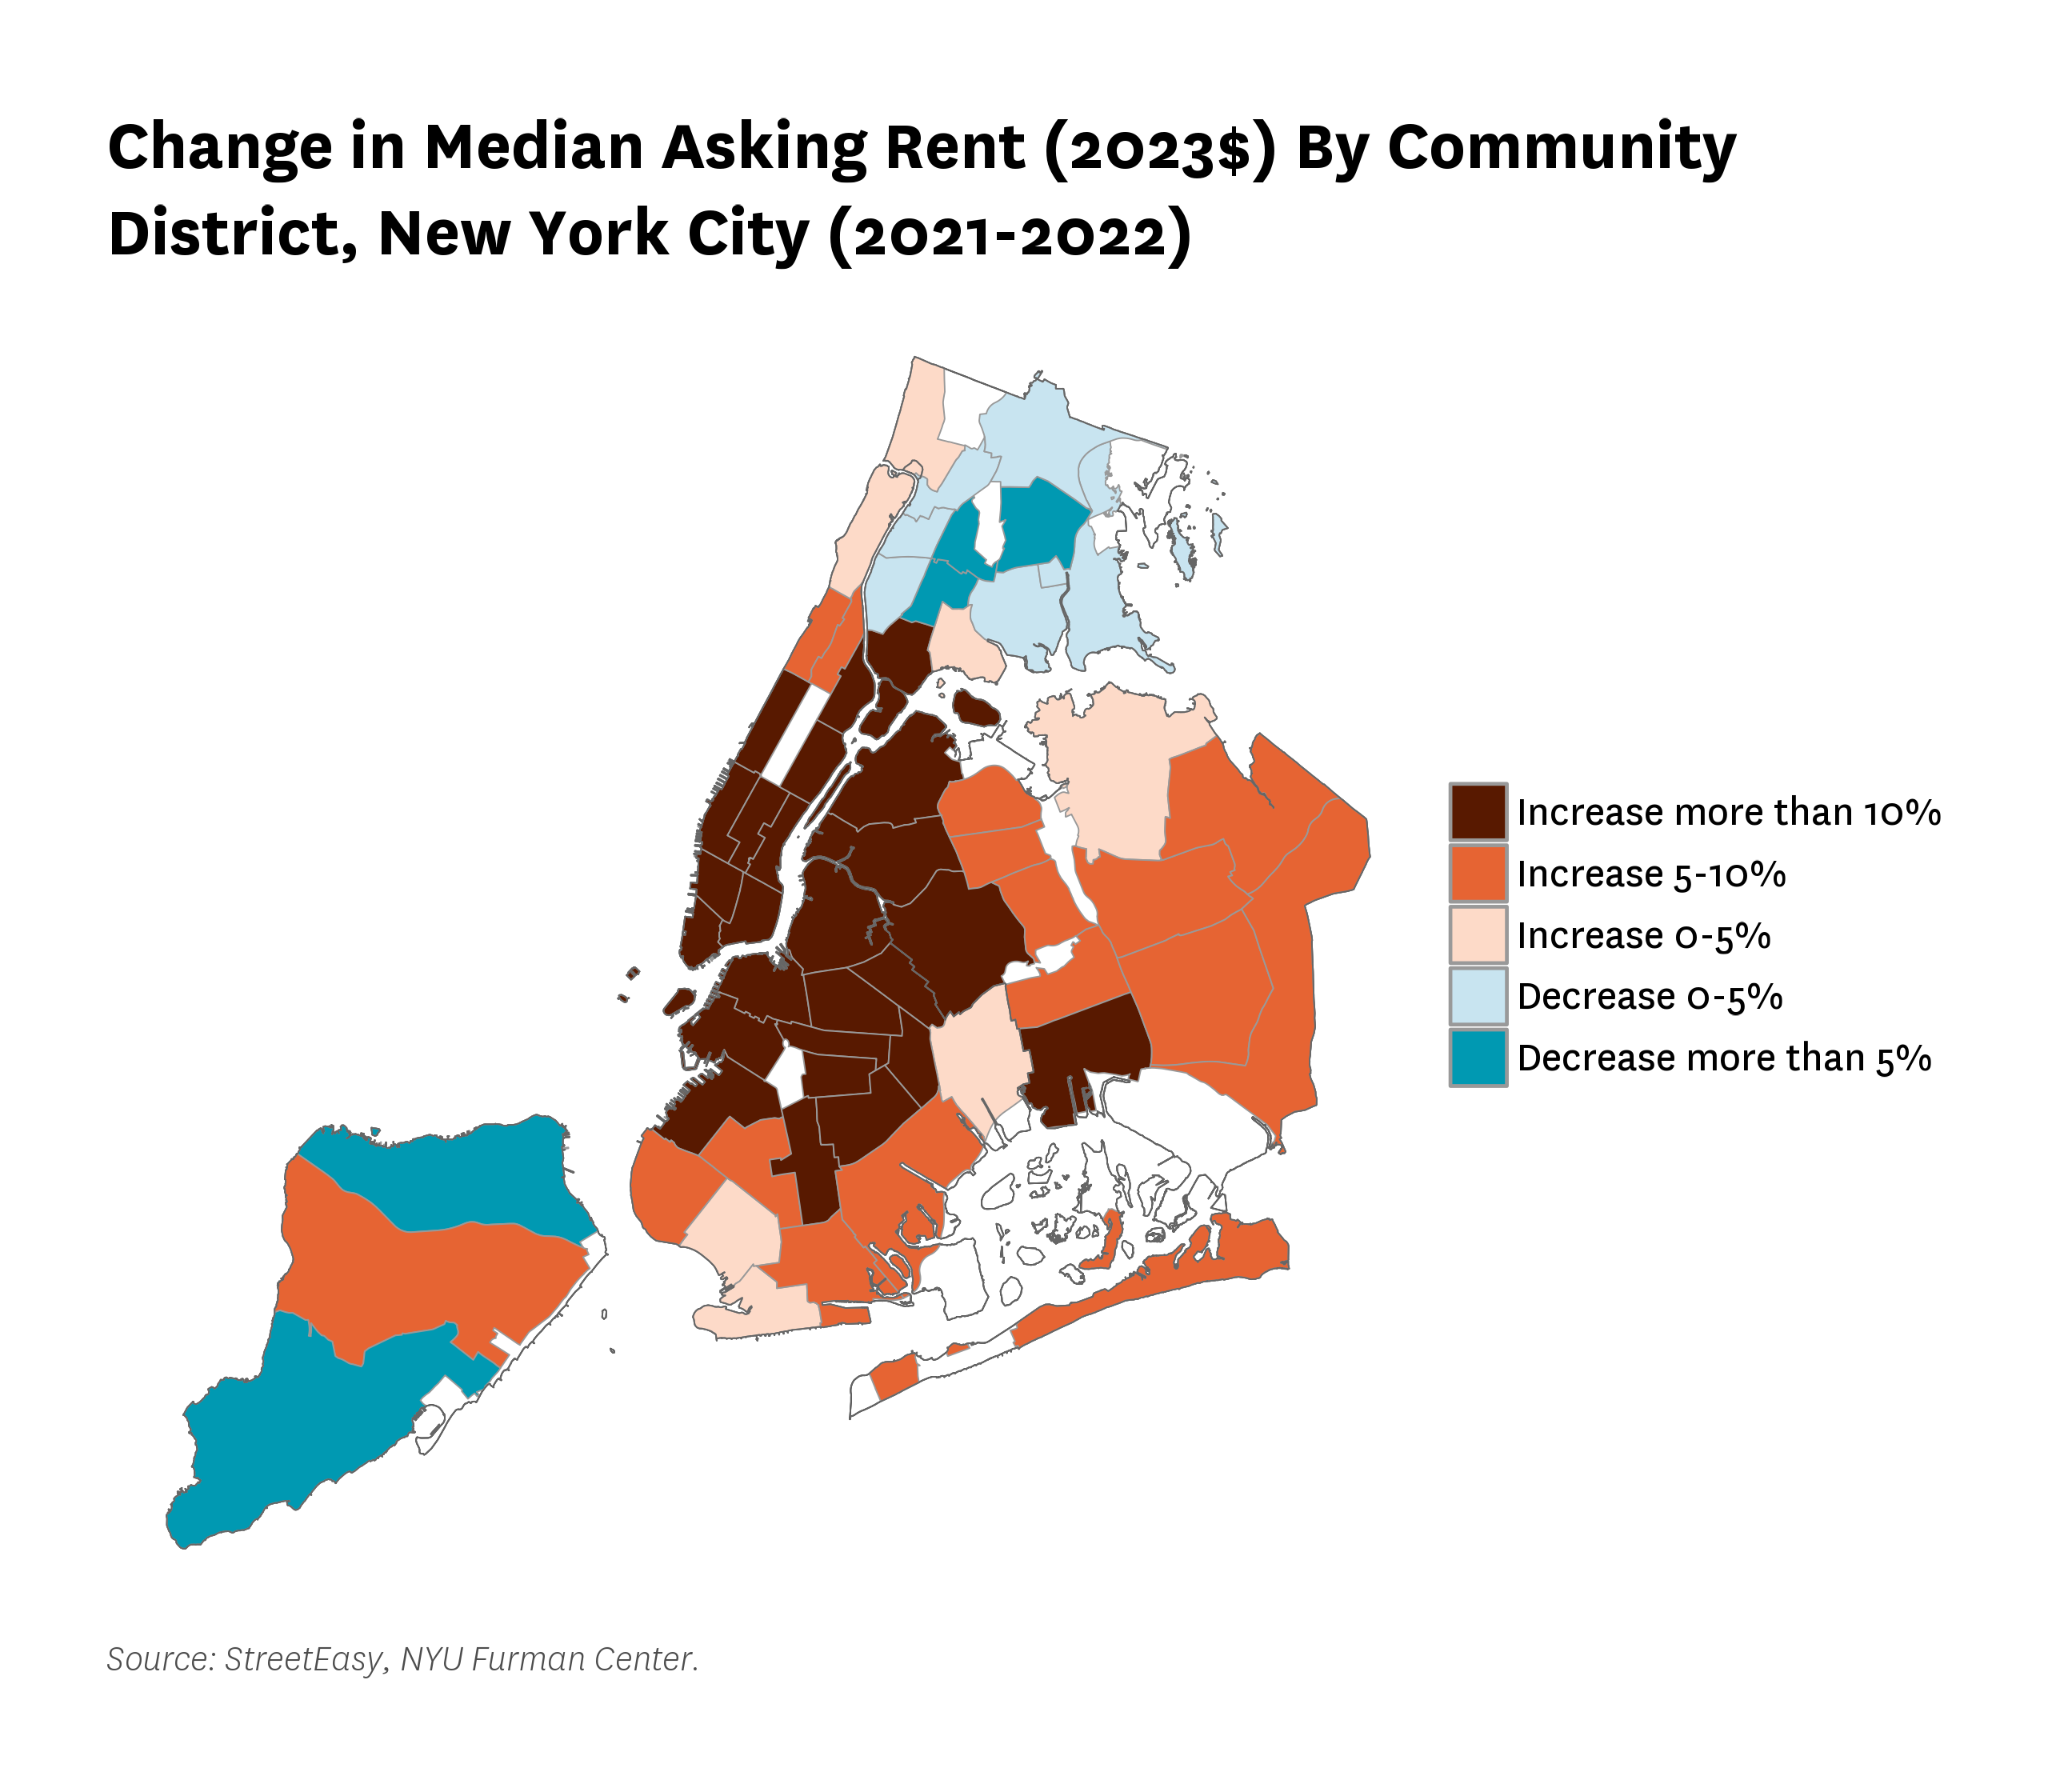
Sources: StreetEasy, NYU Furman Center.
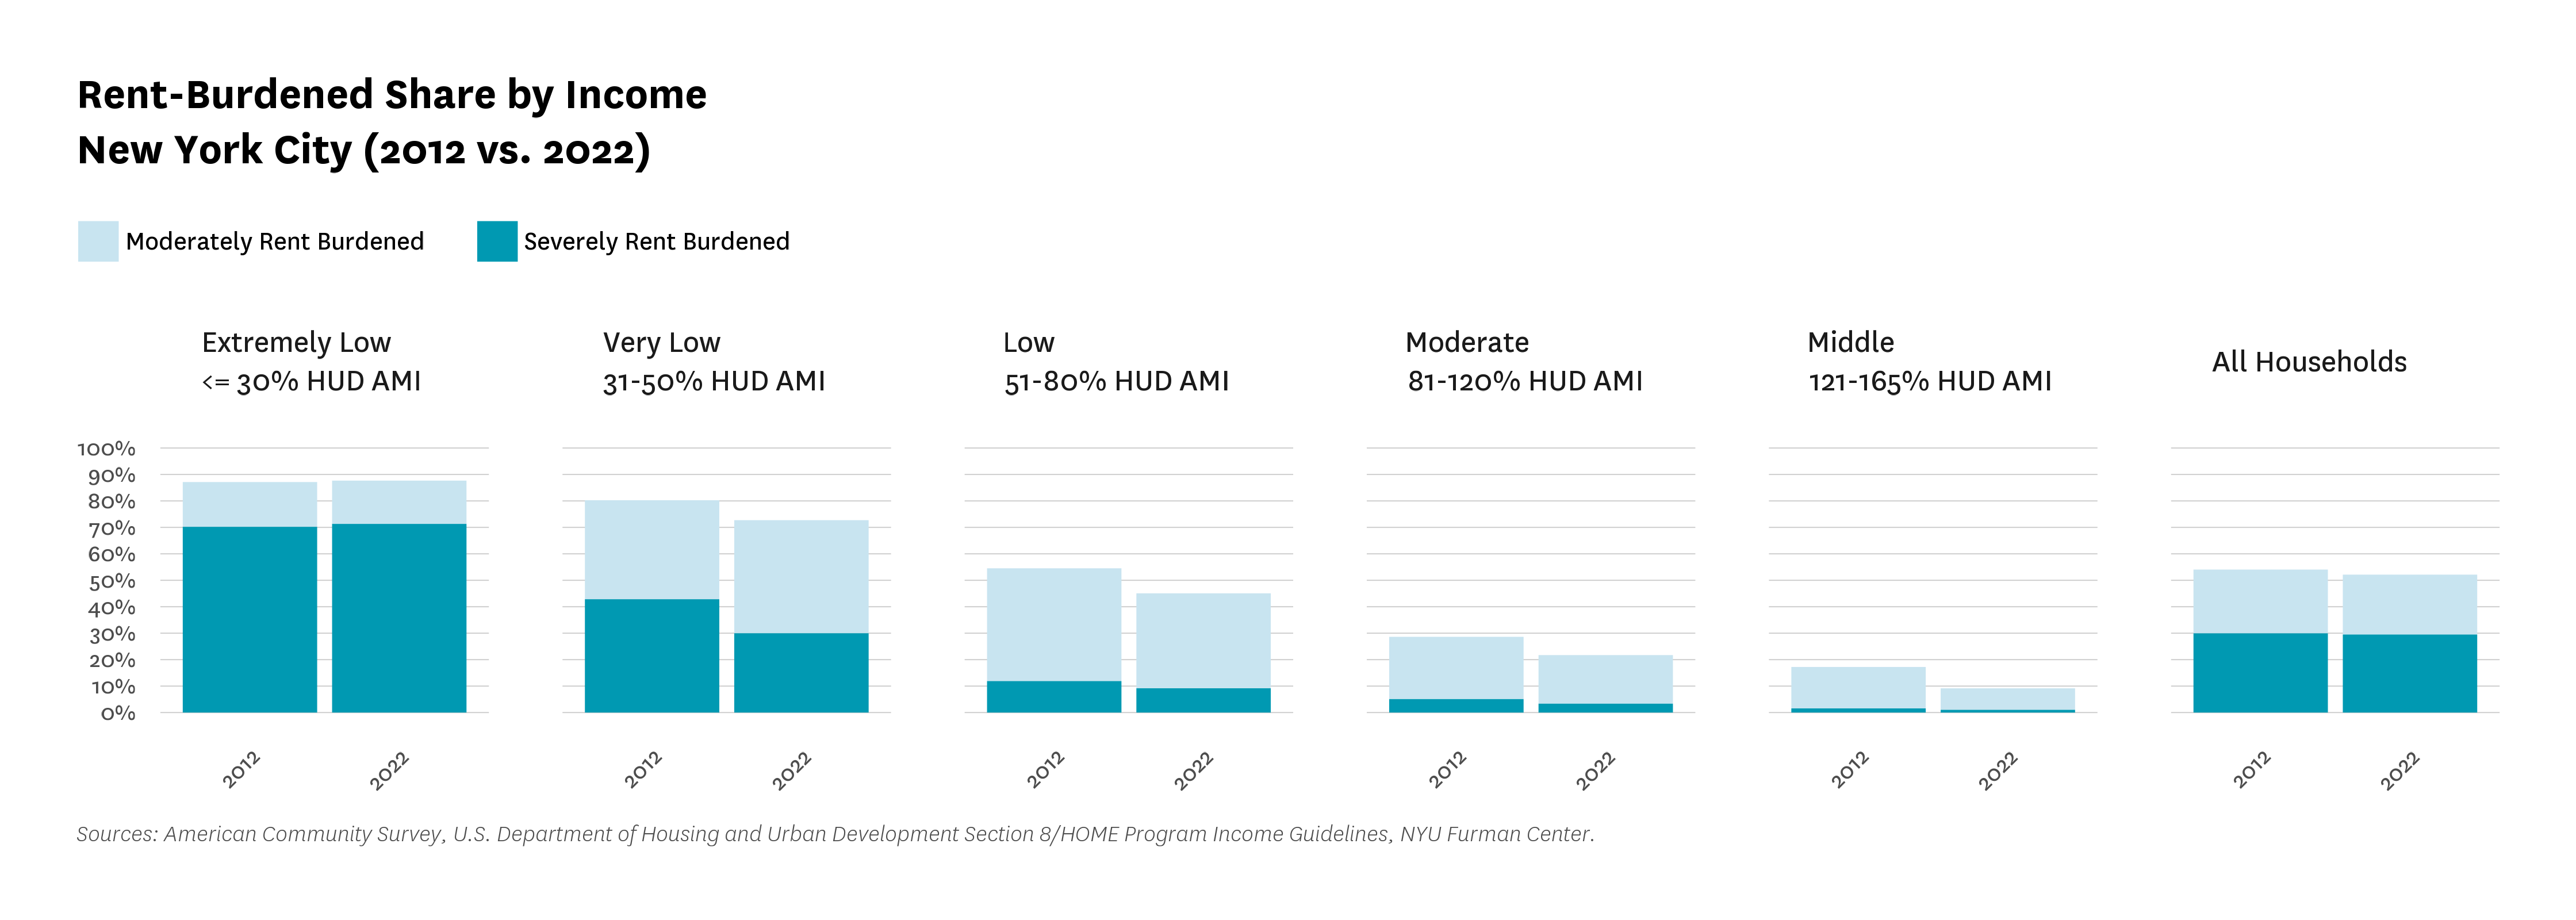
The share of New York City households that were rent burdened remained fairly constant between 2012 and 2022.
A household is considered “moderately rent burdened” if the household spends thirty percent or more of their income on rent, and “severely rent burdened” if the household spends fifty percent or more of their income on rent. The share of New York City households that were rent burdened stayed fairly constant between 2012 and 2022, declining slightly from 54.1 percent to 52.1 percent. When we break out households by income, we find that extremely low-income households consistently make up the highest share of households that experience rent burden, while middle-income households have the lowest share of the groups measured. Low-income households (51-80% AMI) saw the largest percentage point drop in rent burden from 2012 to 2022, with a 6.8 percentage point decrease in the share of those with moderate rent burden and a 2.72 percentage point decrease in the share of those experiencing severe rent burden.
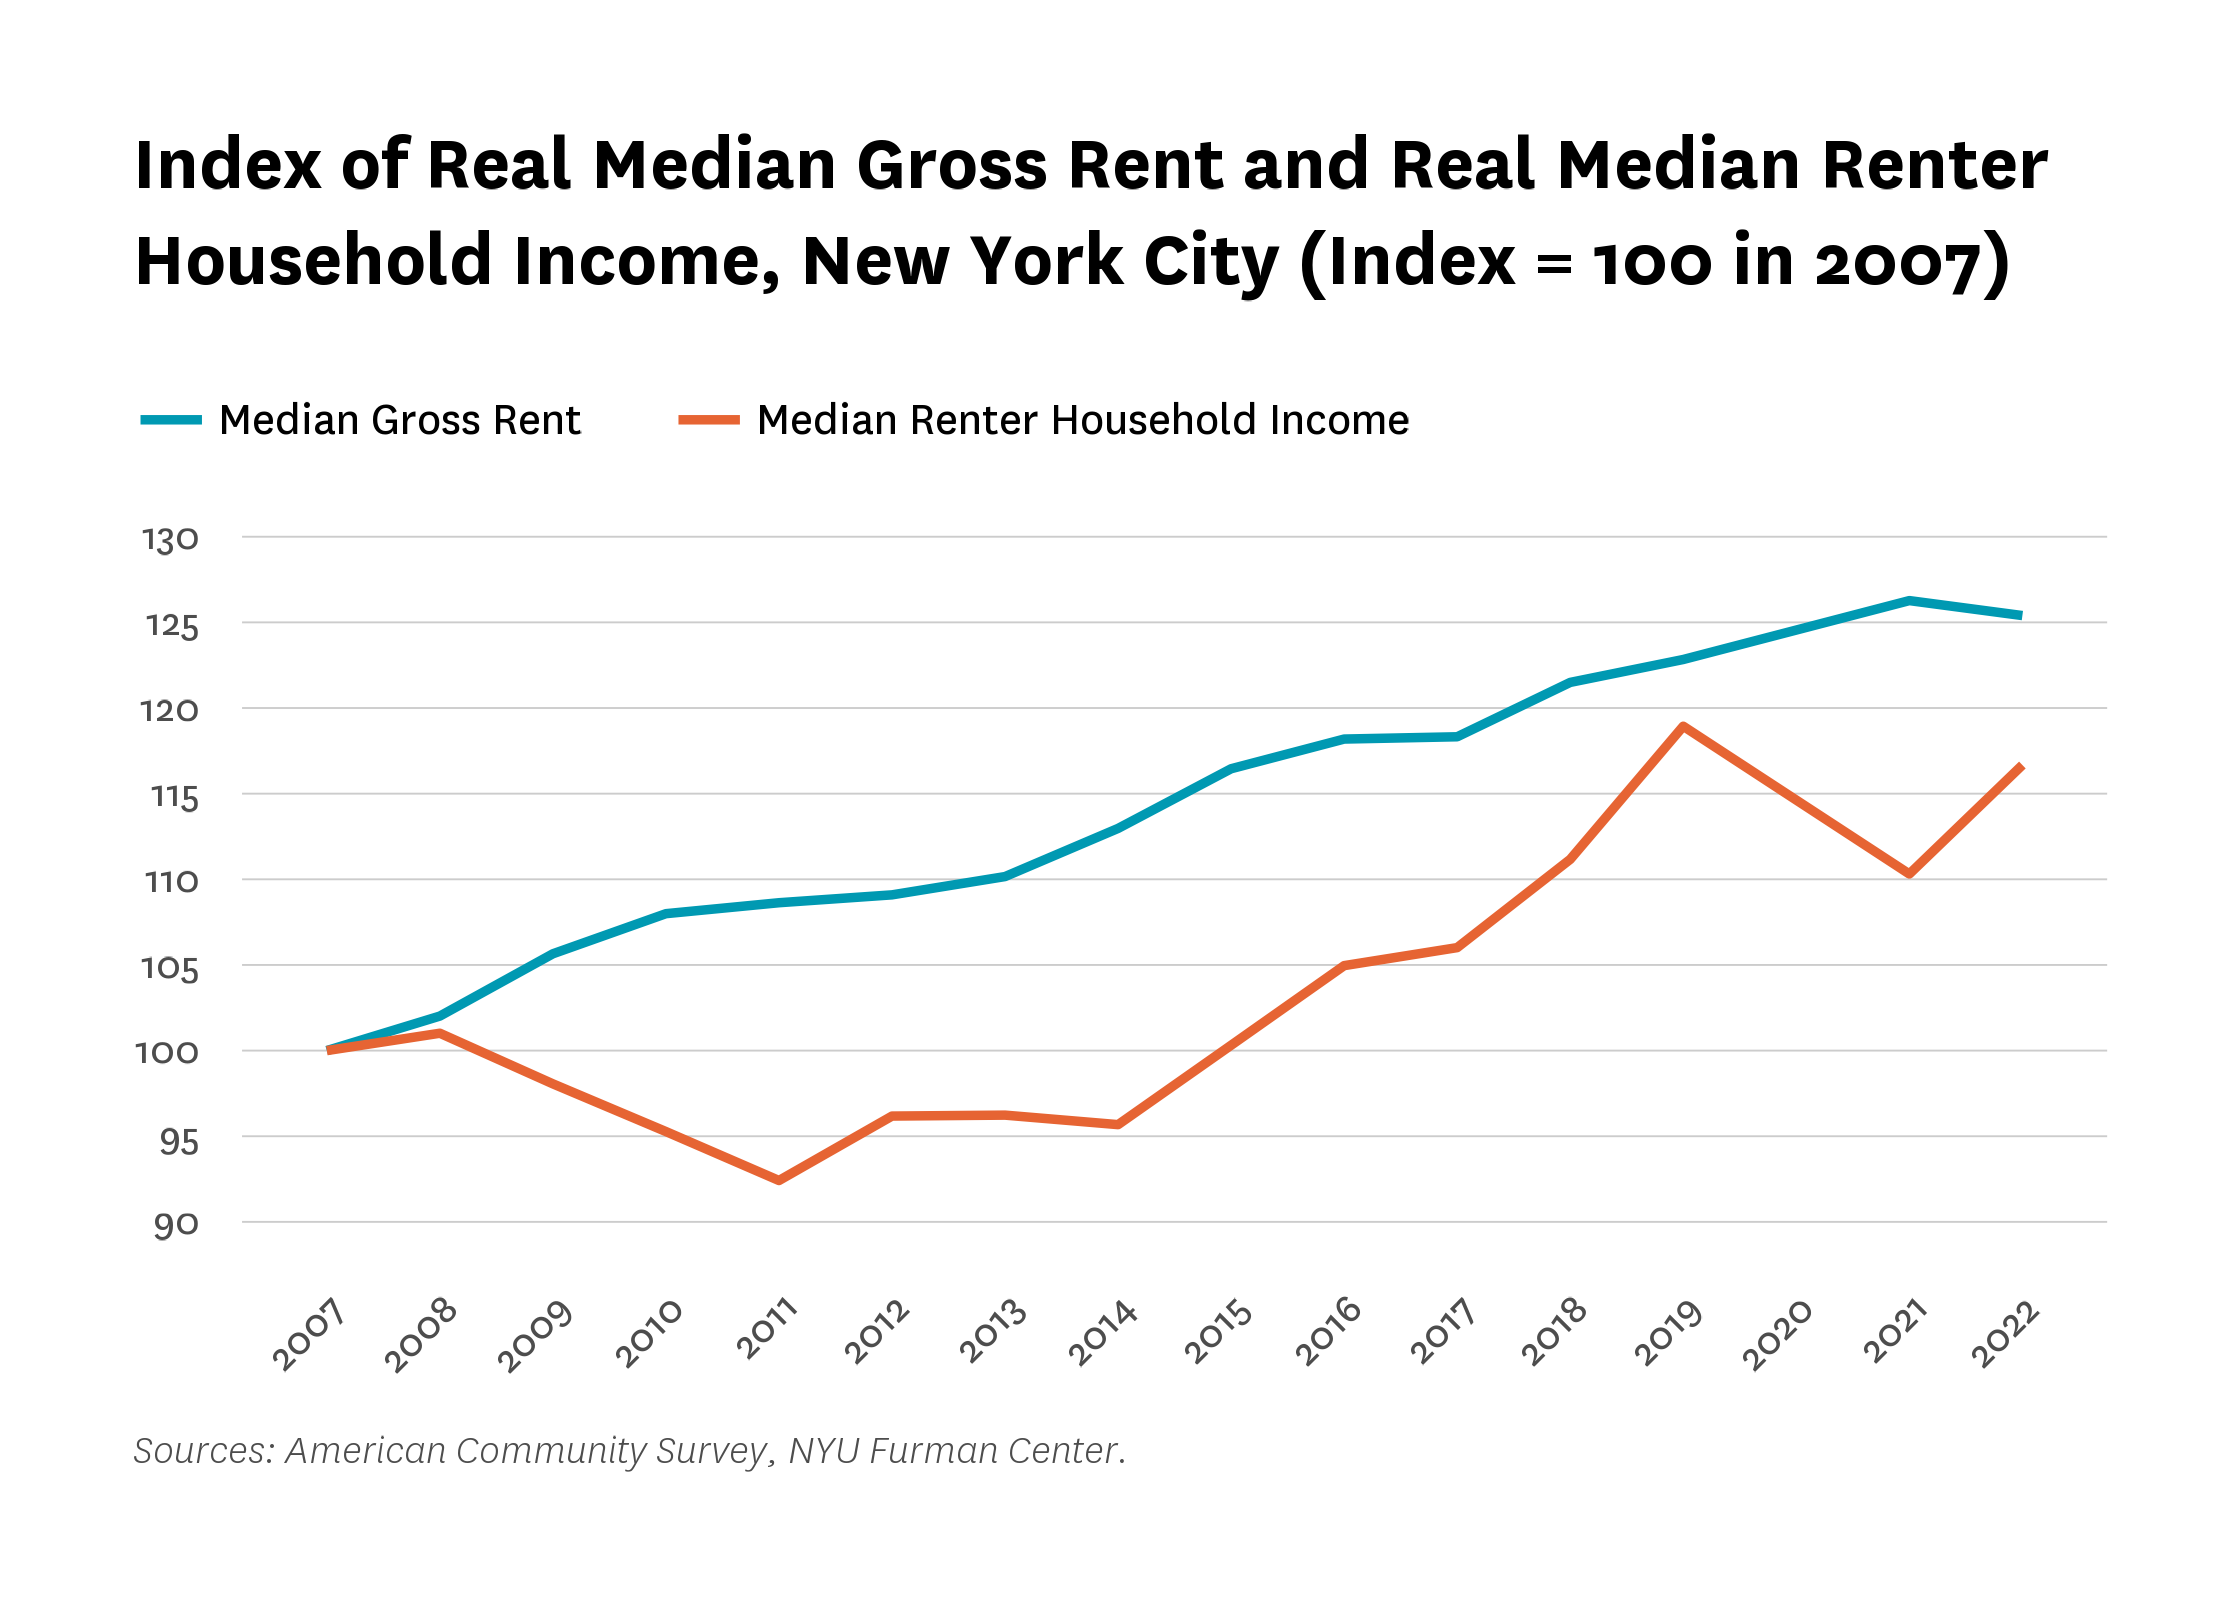
After adjusting for inflation, median renter household income plummeted between 2019 and 2021, reversing a five-year trend of real median renter household income growing faster than median gross rent. While median renter household income increased between 2021 and 2022, it has declined in real terms since 2019.
Between 2014 and 2019, the gap in growth between median gross rent and median renter household income gradually closed, with the growth of median renter household income having outpaced the rent growth. This trend broke after 2019. Real median renter household income decreased from 119 percent of its 2007 level in 2019 to 110 percent of its 2007 level in 2021. During the same period, median gross rent rose at a similar rate as that of the previous decade. The reason for steep income declines could be a shift in the composition of renters (with incomes declining because of higher income renters leaving the city during the pandemic), or, it could be that incomes for renters uniformly declined overall during that period. For 2022, real median renter household income jumped back up to 117 percent of its 2007 level, while real median gross rent declined from 126 percent to 125 percent of its 2007 level.
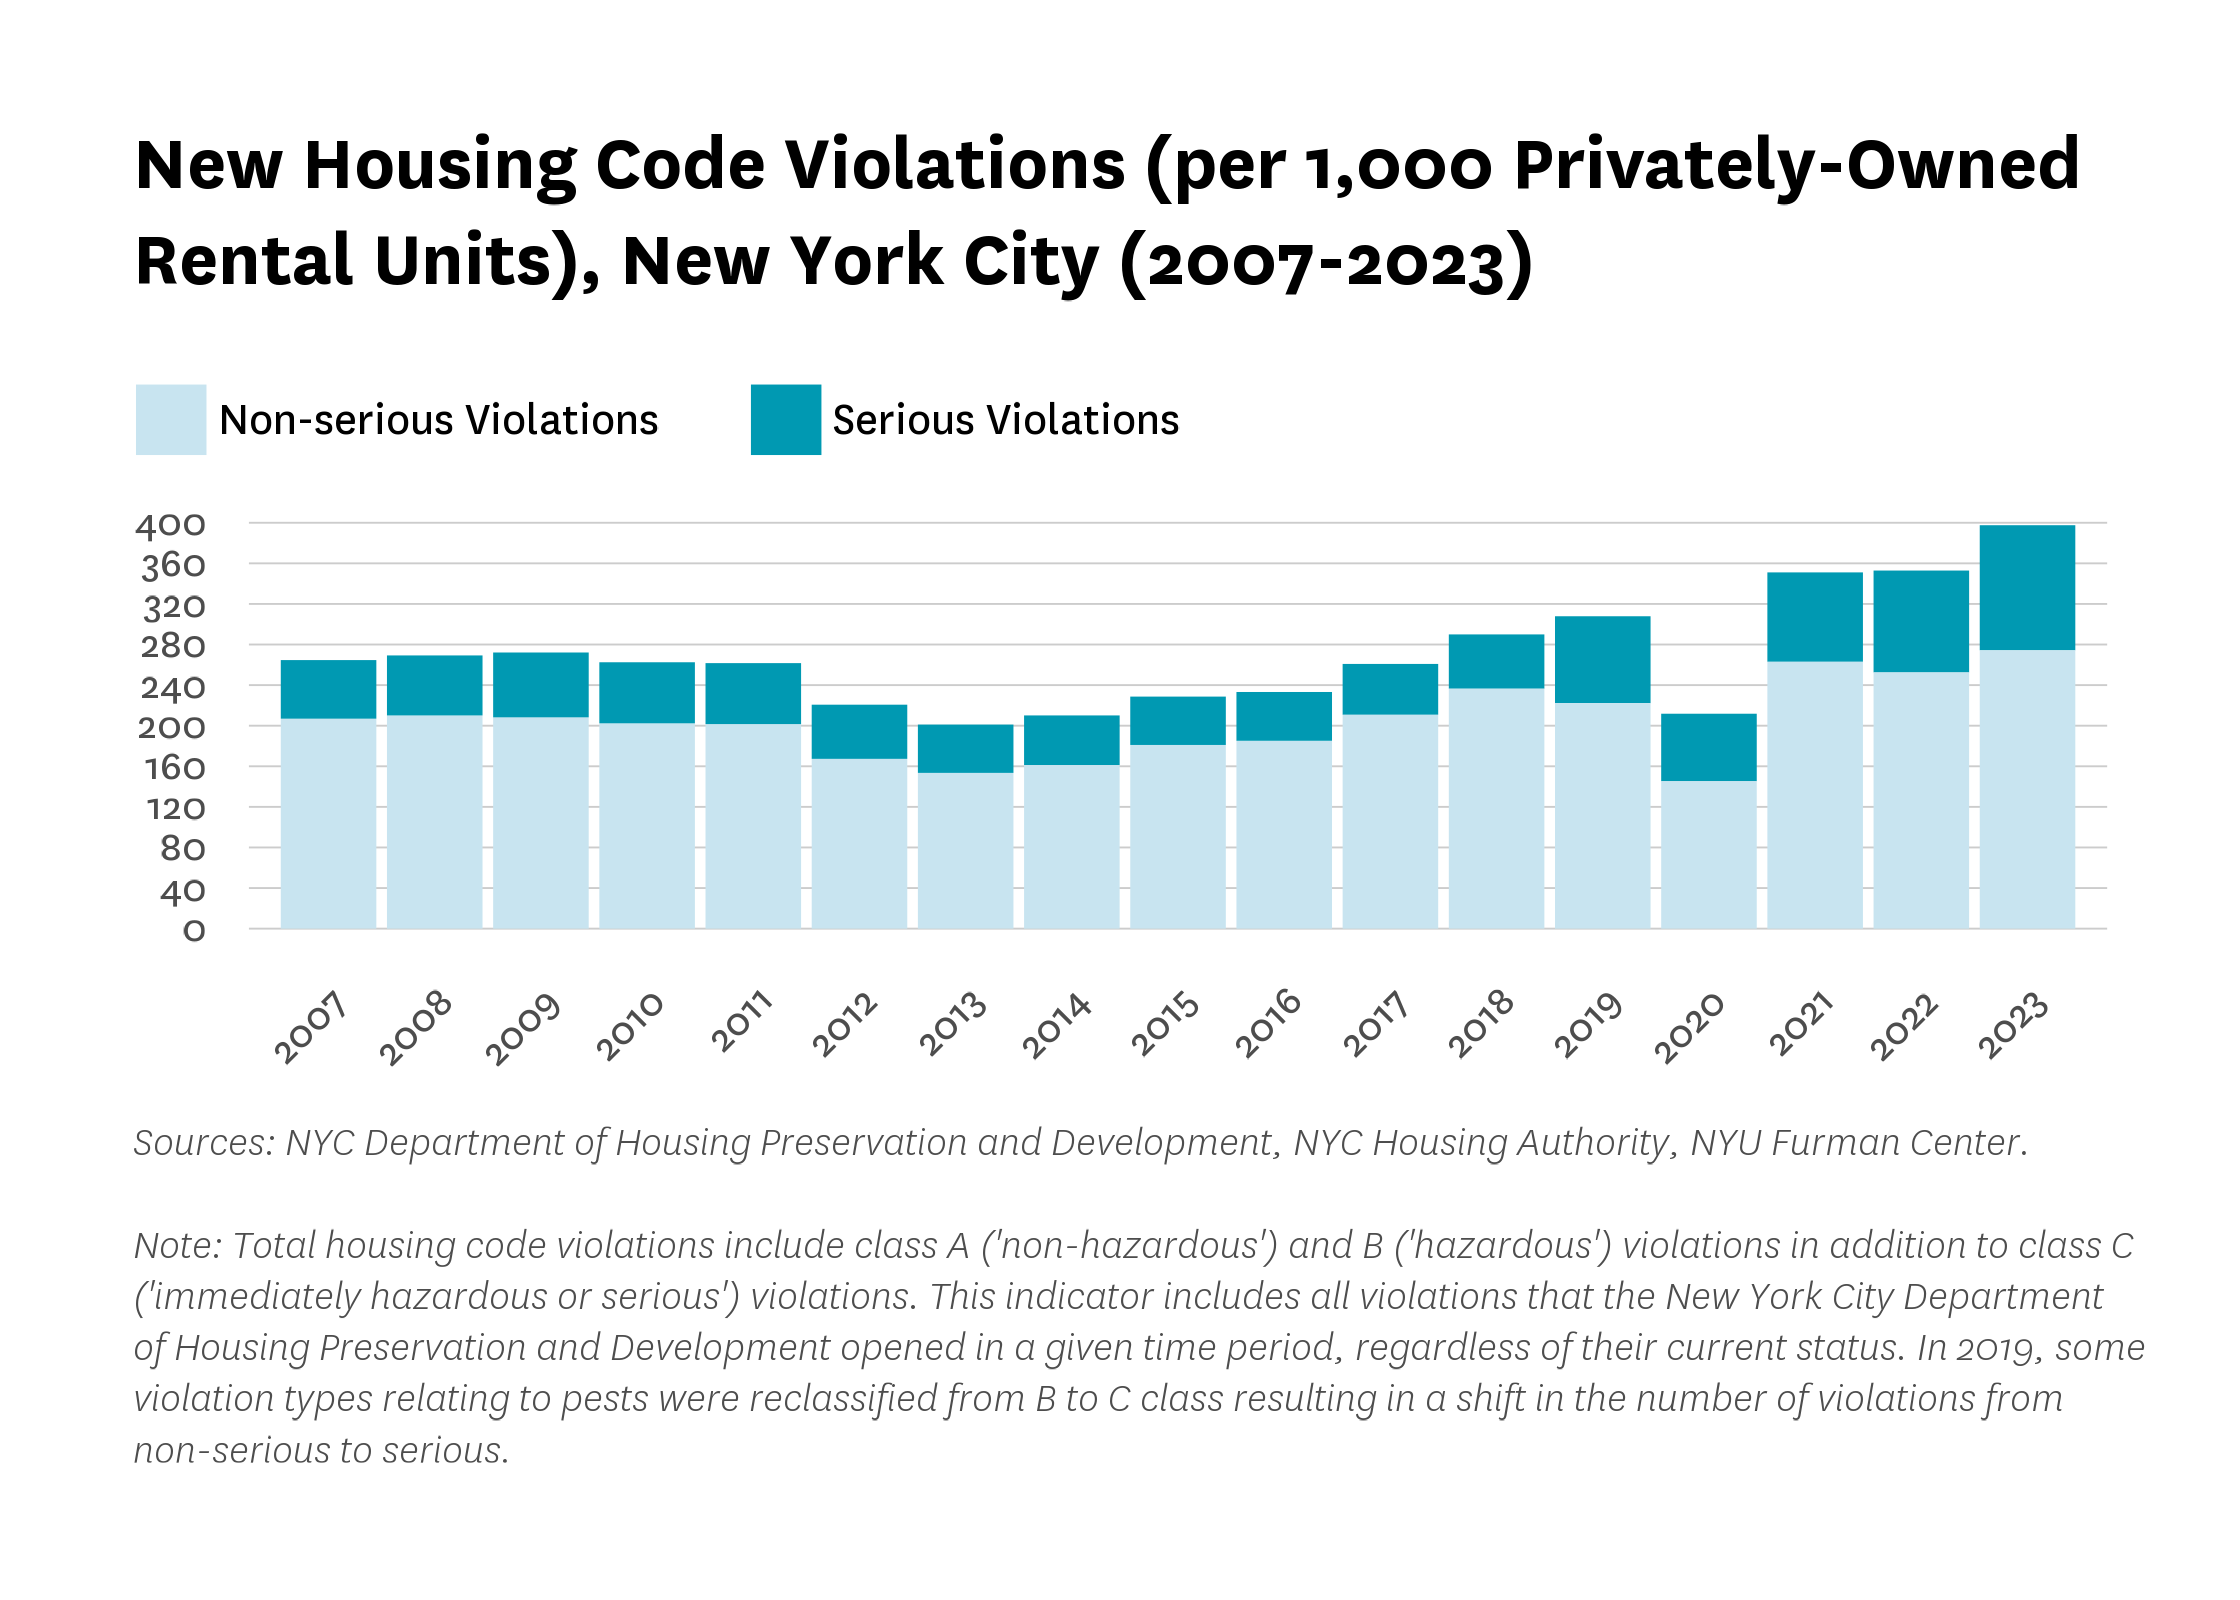
The rate of housing code violations issued by the Department of Housing Preservation and Development rose between 2022 to 2023, continuing a long-term upward trend that began in 2014 but was briefly interrupted during the first year of the pandemic.
The rate of new housing code violations increased between 2022 and 2023, increasing from 352.9 violations per 1,000 privately-owned rental units in 2022 to 397.6 violations per 1,000 privately-owned rental units in 2023. Serious housing code violations, defined as violations that are immediately hazardous or serious, increased at a faster rate between 2022 to 2023 (22.8%) than non-serious violations (8.6%).
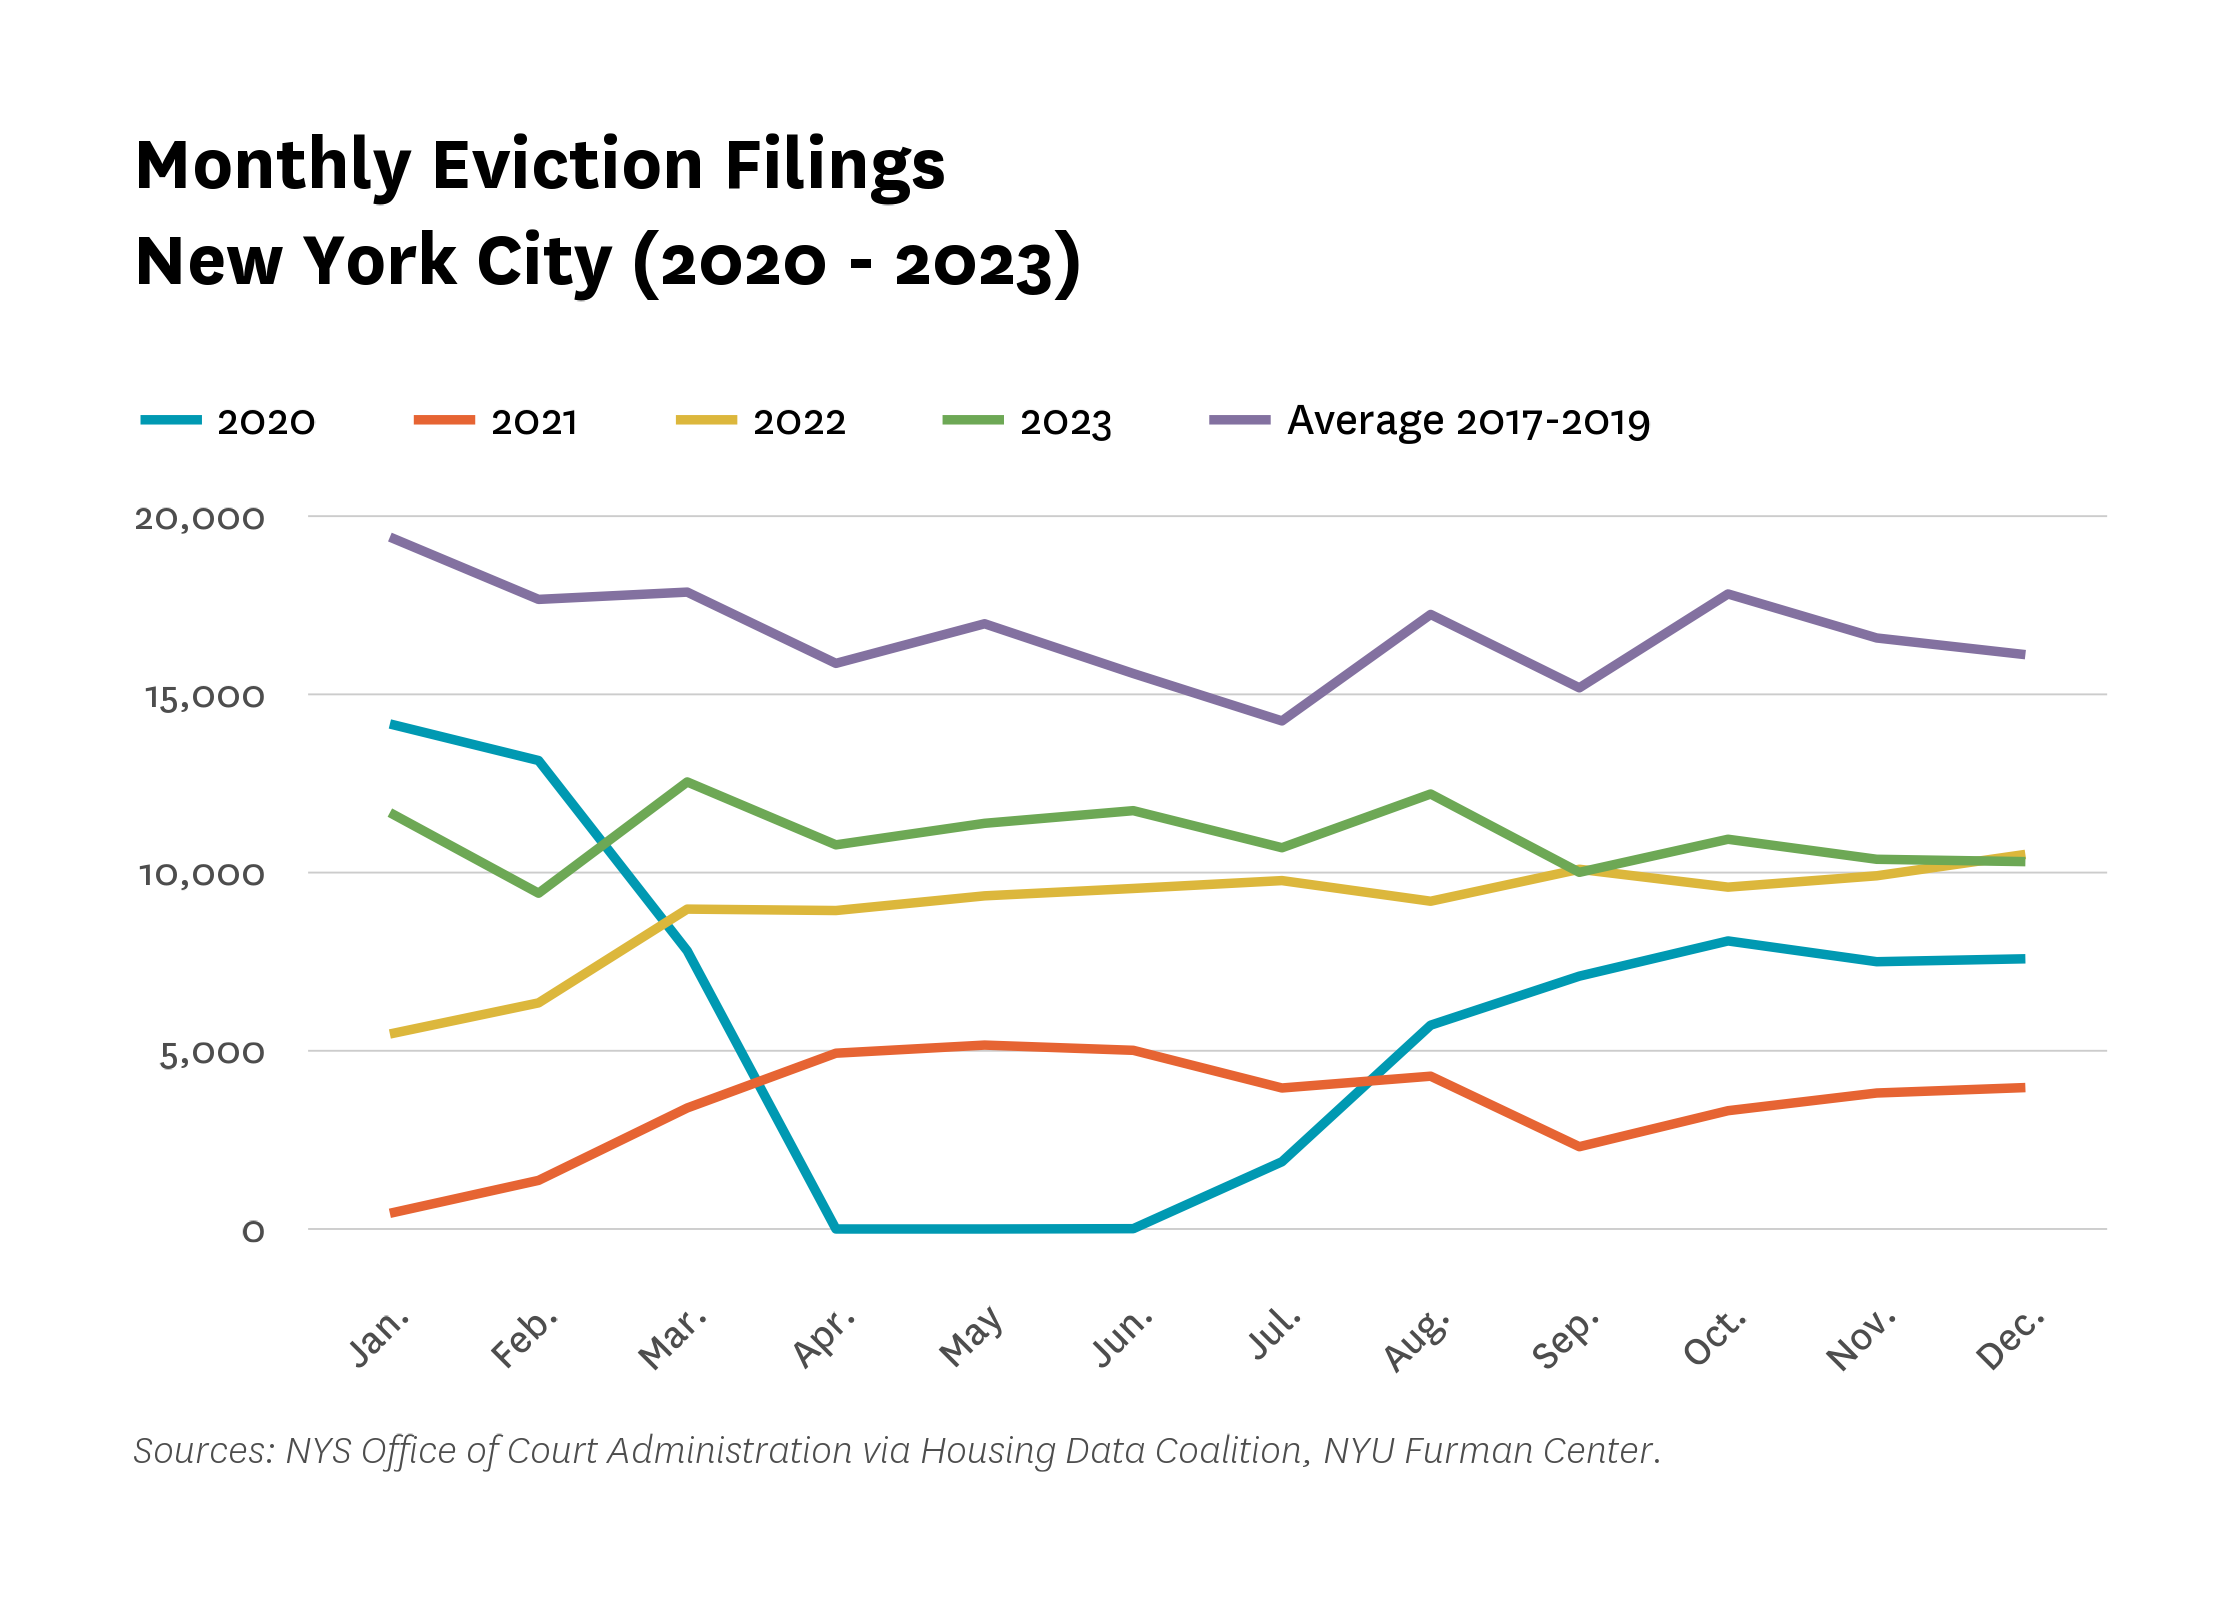
Monthly eviction filings in 2023 remained below pre-pandemic levels, but were above 2021 and 2022 levels
By the end of January 2022, COVID-era eviction moratoria from state and federal sources such as the Governor’s Executive Order 202.8, New York’s COVID-19 Emergency Eviction and Foreclosure Prevention Act, and the nationwide eviction moratorium mandated by the Centers for Disease Control had ended. Monthly eviction filings have increased since that period. The count of monthly eviction filings in 2023 was higher than in 2021 and most of 2022. Still, 2023 monthly eviction filings remain consistently lower than the average monthly eviction filing counts that occurred between 2017 and 2019. For a detailed timeline of the various eviction moratoria affecting eviction in New York City, see our eviction tracker.
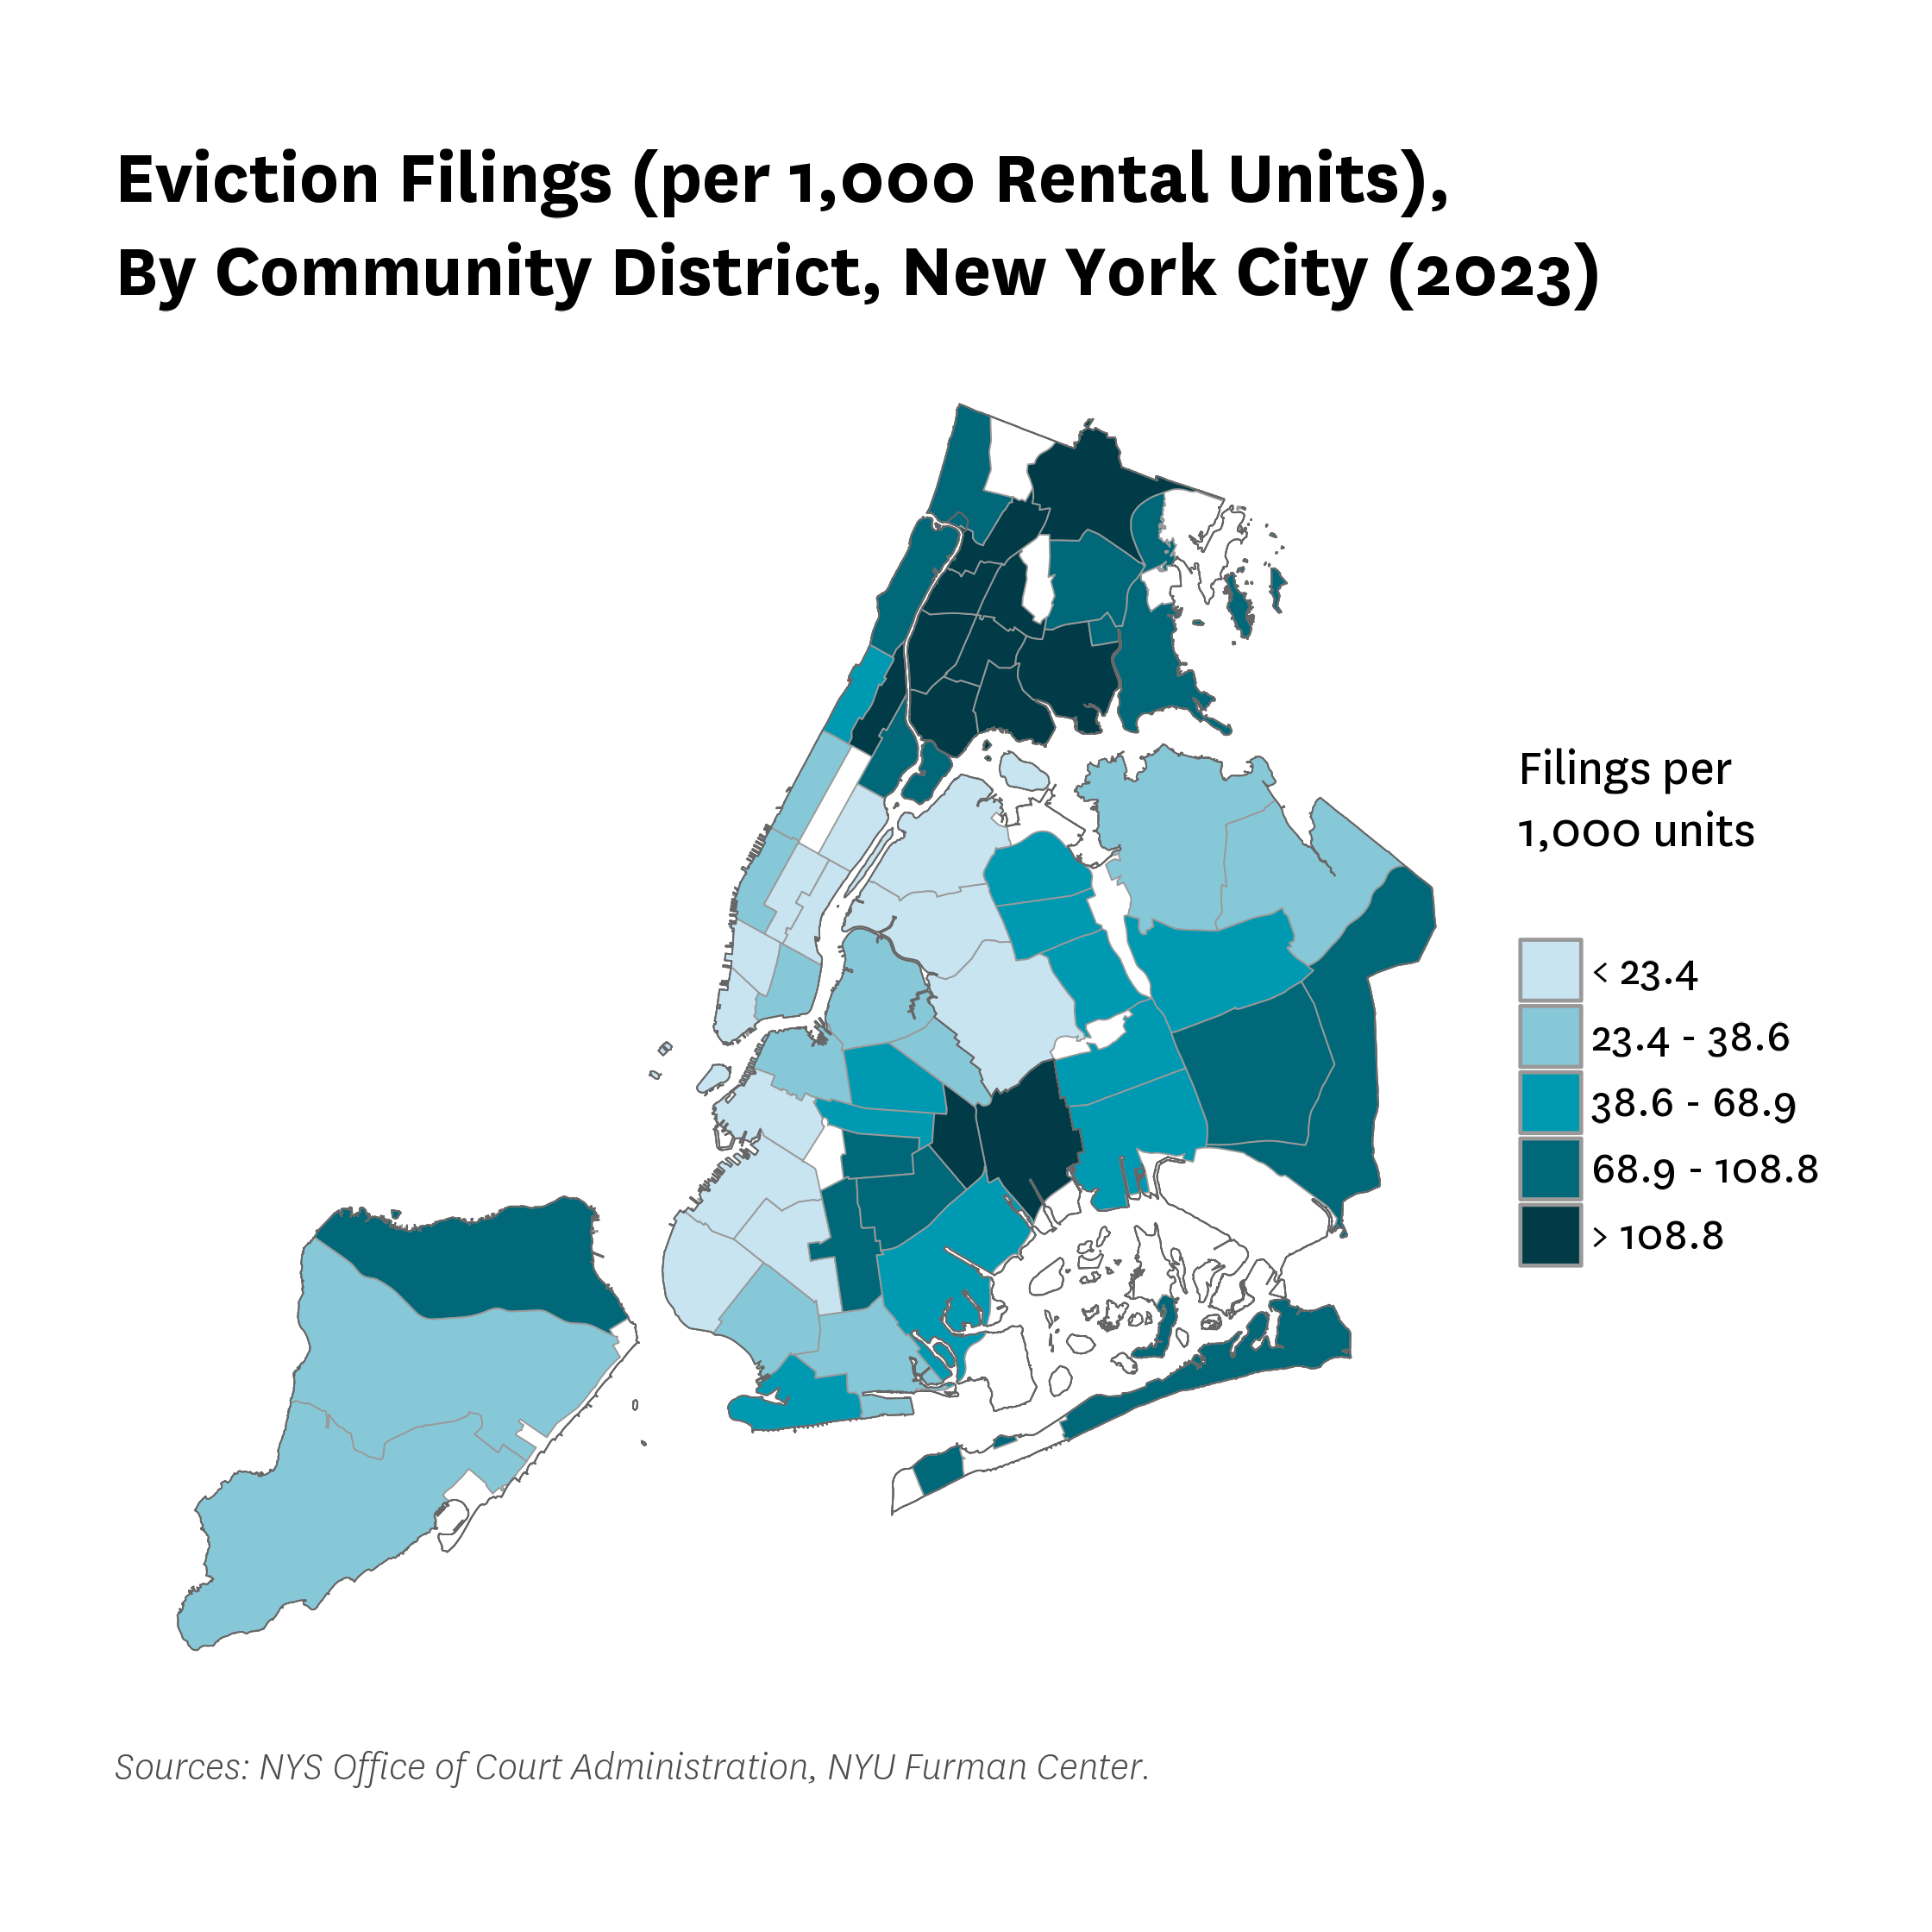
Neighborhoods in the Bronx, eastern Queens, and central Brooklyn experienced the highest eviction filing rate during 2023.
Rates of eviction filing ranged widely throughout New York City in 2023, from rates as low as 12.6 eviction filings per 1,000 units in Stuyvesant Town/Turtle Bay to 159.7 eviction filings per 1,000 units in Morrisania/Crotona. Large portions of the Bronx experienced relatively high rates of eviction filings, as well as Brooklyn neighborhoods in and near East New York/Starrett City and Brownsville.
Eviction Filings (per 1,000 Rental Units), By Community District, New York City (2023)
Sources: NYS Office of Court Administration, NYU Furman Center.