State of New Yorkers and Neighborhoods 2023
In this section we describe high-level trends on the economic recovery from the COVID-19 pandemic, the city’s homeless shelter population, and how the composition of New Yorkers by income has changed since 2000. We examined American Community Survey and U.S. Bureau of Labor and Statistics data to understand recent trends in unemployment. Unemployment reached a peak in Q2 2020, steadily declined into 2022, and stayed relatively stable through 2023. Additionally, while subway ridership marginally increased between 2022 and 2023, turnstile entries remain well below pre-pandemic counts. New York saw a record-breaking spike in the number of families staying in homeless shelters in 2023 which coincides with the city’s struggles to provide services for the large numbers of asylum seekers who continue to arrive in New York from abroad. A noticeable trend is the rising share of relatively high income renters. Between 2000 and 2022, there was a notable increase in the share of renter households with annual incomes between $100,000 and $250,000, along with a rise in the share of renters earning over $250,000. Concurrently, the share of renter households earning between $40,000 and $60,000 decreased.
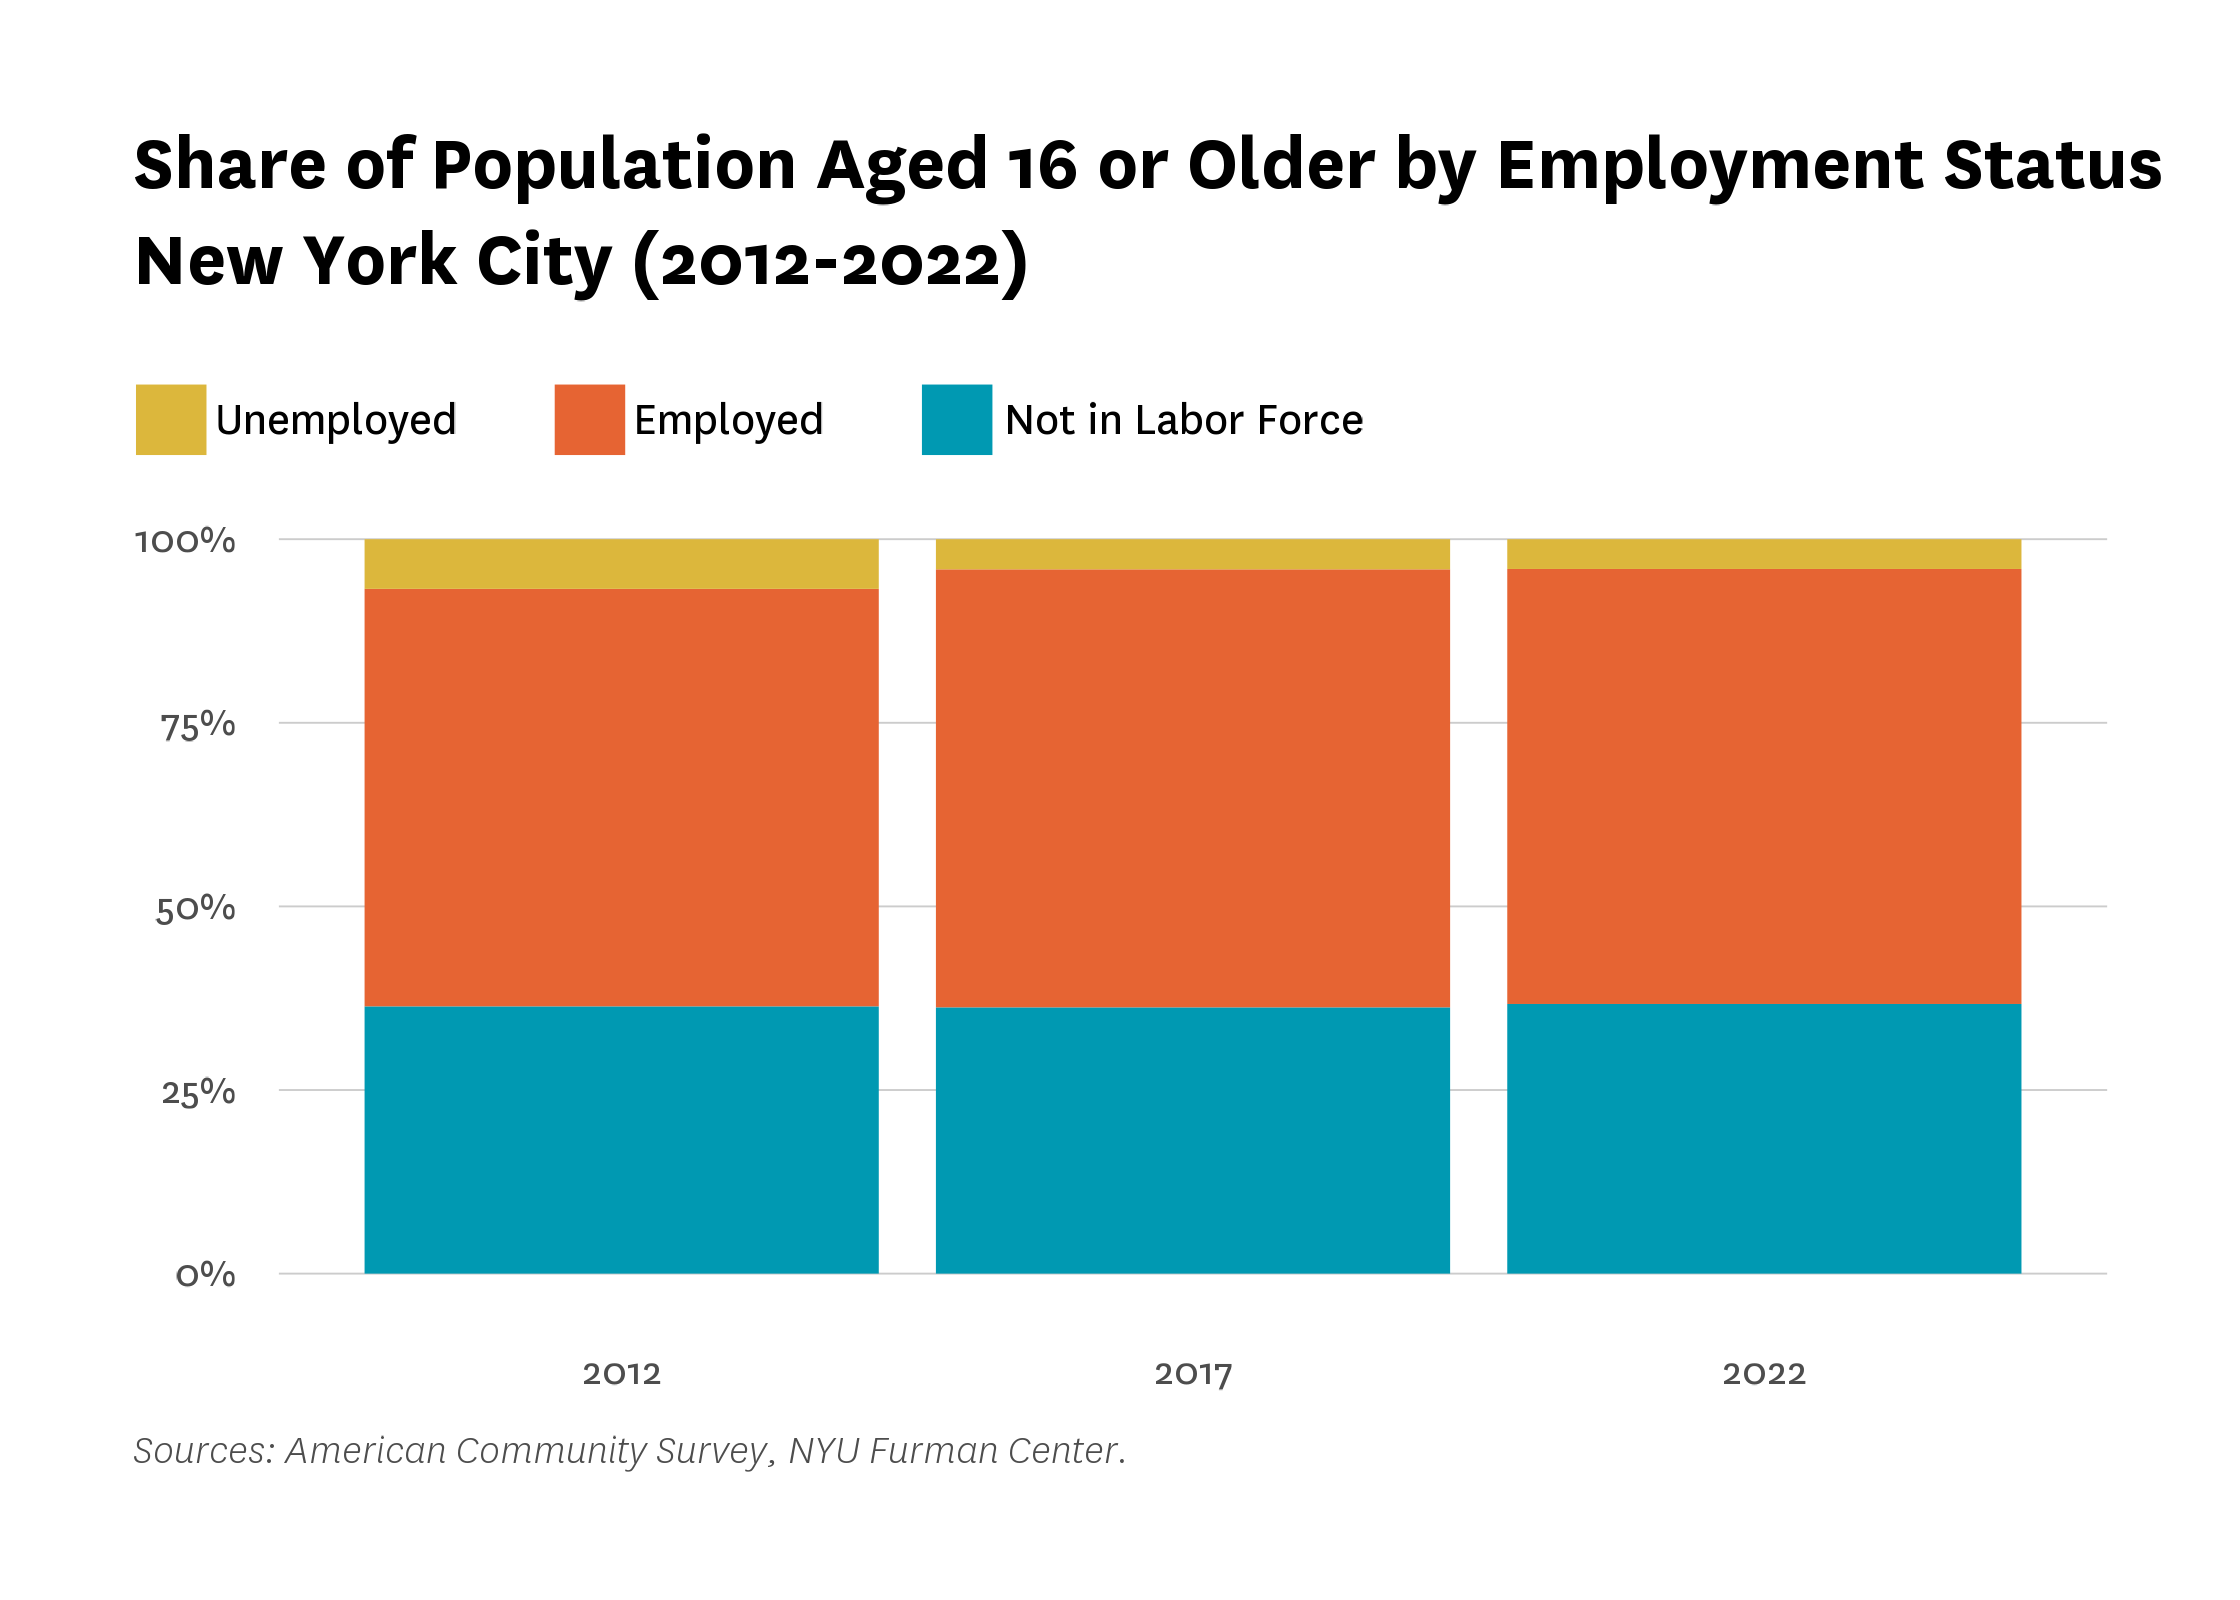
The share of unemployed New York City residents stayed steady in 2022.
In 2022, 4.1 percent of New Yorkers aged 16 or older were unemployed, the same rate as 2017 and a decrease of 2.7 percentage points from 2012. (2012 included an initial period of economic recovery after the Great Recession). According to 2022 ACS data, 59.2 percent of New Yorkers were employed in 2022, which was a 0.4 percentage point decrease from 2017 and a 2.4 percentage point increase from 2012. The share of the population not in the labor force in 2022 was 36.7 percent, an increase of 0.5 percentage points from 2017 and 0.4 percentage points from 2012.
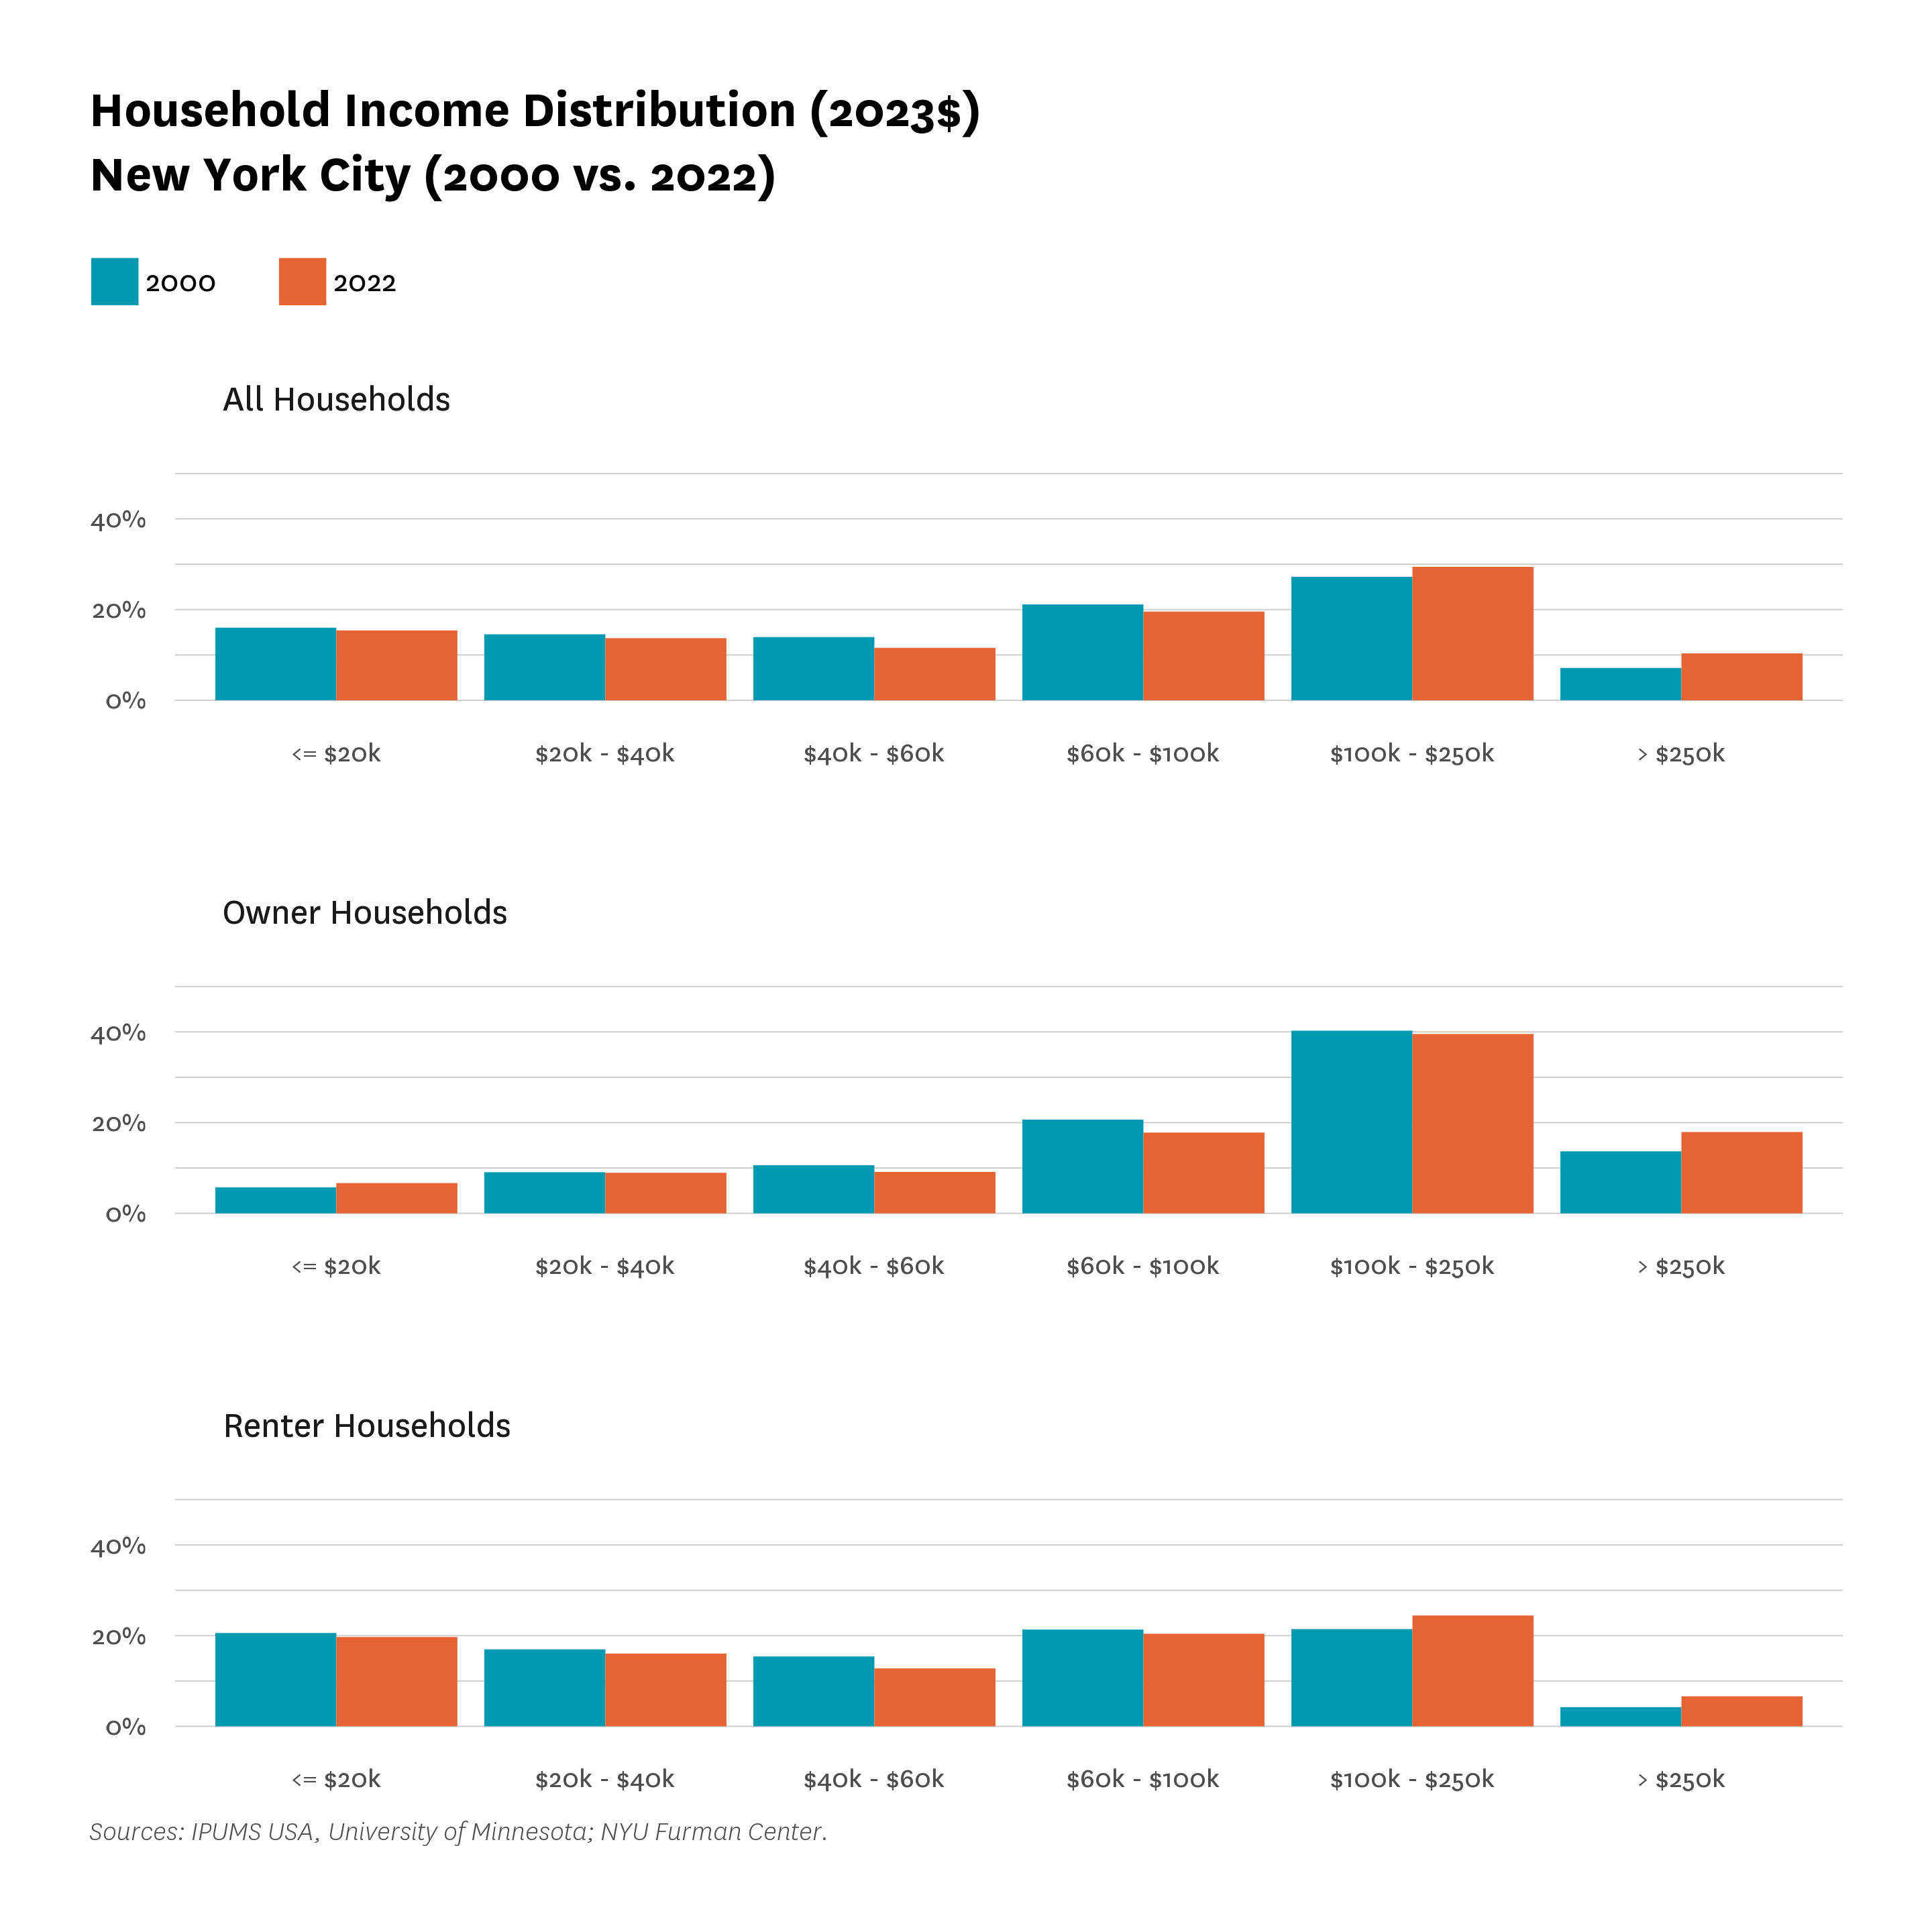
From 2000 to 2022, the proportion of homeowner households earning between $100,000 and $250,000 declined, whereas renter households in this income bracket saw an increase. Additionally, both owner and renter households experienced a rise in the share earning above $250,000 and a decrease in those earning between $40,000 and $60,000.
When controlling for inflation, we find that the composition of households by income has slightly changed since 2000. This compositional shift occurred during a period when New York City’s population grew from 8,008,278 in 2000 to 8,335,897 in 2022. The share of owner households with earnings between $100,000 to $250,000 decreased by 0.8 percentage points between 2000 and 2022, while the share of renter households in the same income bracket increased by 3.0 percentage points. The shares of both owner and renter households with annual incomes over $250,000 increased by 4.2 percentage points and 2.4 percentage points, respectively. On the other end of the income spectrum, the share of owner households with an annual income lower than or equal to $20,000 increased slightly by 1.0 percentage points, while it decreased for renter households by 0.9 percentage points. The share of all households with earnings between $40,000 to $60,000 and $60,000 to $100,000 decreased by 2.3 percentage points and 0.5 percentage points, respectively.
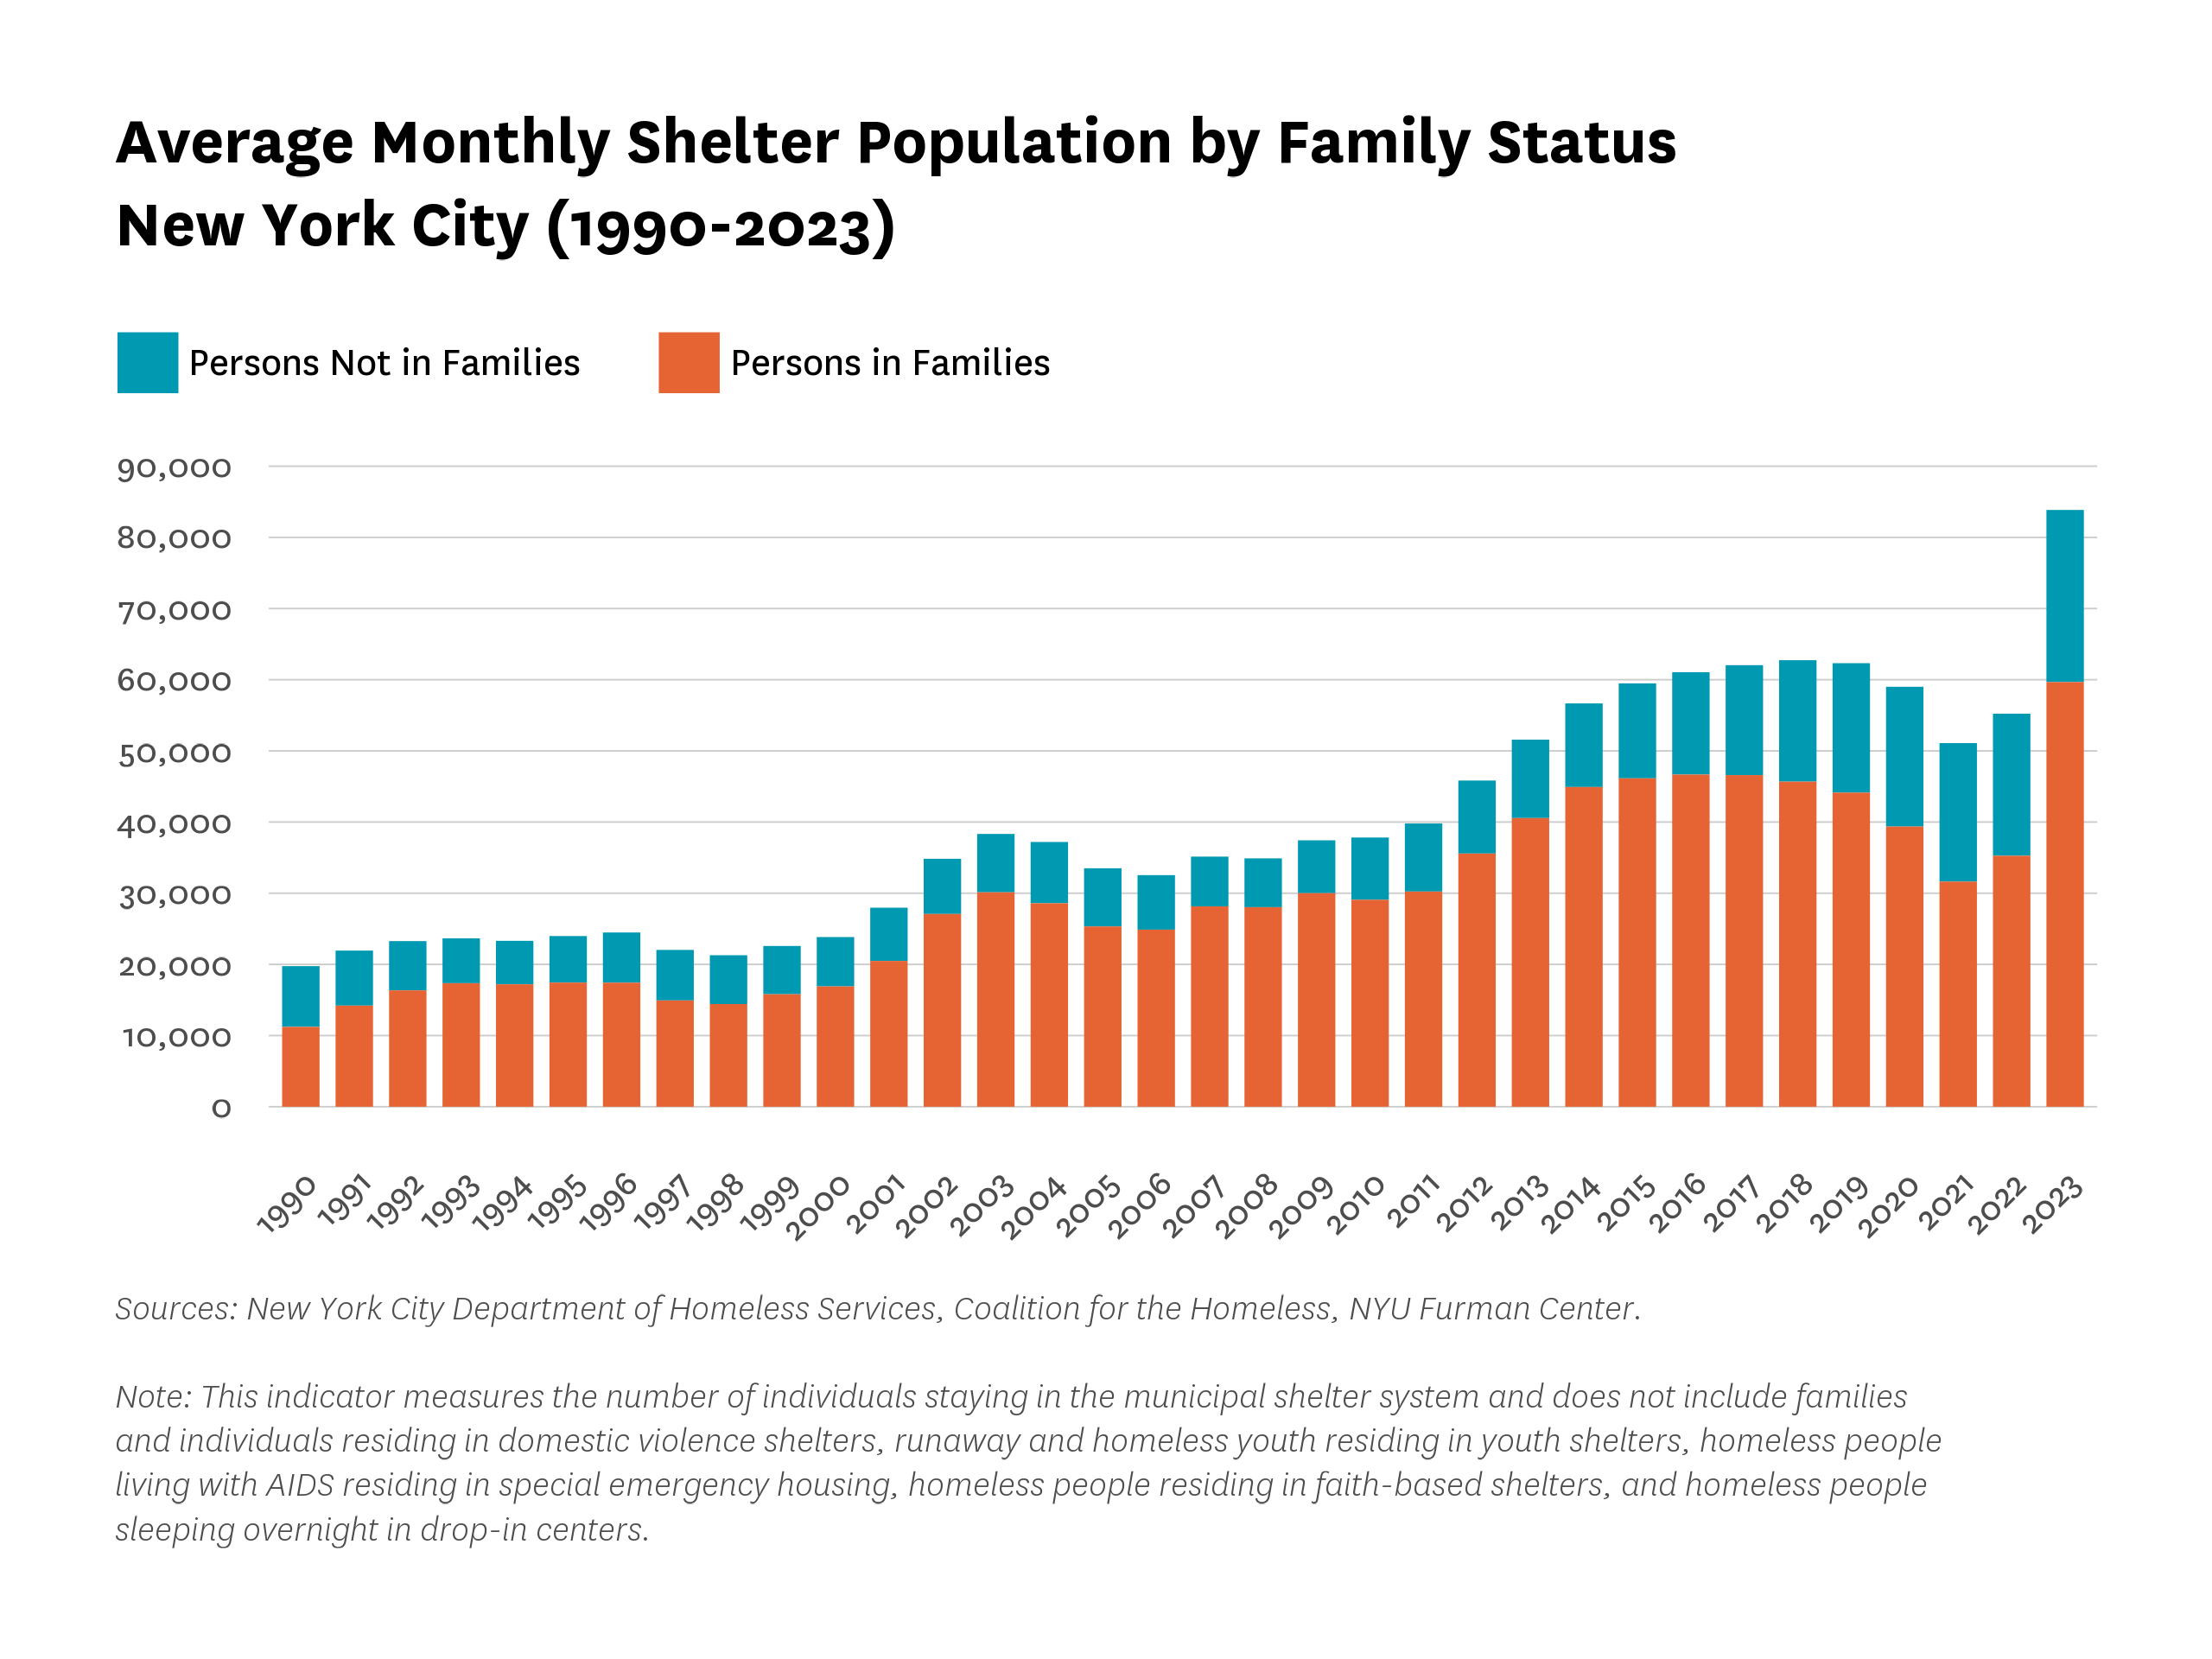
New York City experienced a record breaking surge in the number of people staying in homeless shelters. The overall number of people who lived in homeless shelters increased dramatically between 2022 and 2023.
The total homeless shelter population increased by about 51.8 percent between 2022 and 2023, from 55,227 to 83,852. The rise coincides with New York’s continued struggle to provide services for hundreds of thousands of asylum seekers arriving in the United States. The overall increase was largely driven by a 62.9 percent increase in the number of families who lived in homeless shelters. In contrast, the number of single adults increased by 21.1 percent to 24,183 individuals. The total homeless shelter population, number of families in shelters, and number of individuals in shelters were all the highest since New York began recording the data in 1990. It is important to note that the data from the New York City Department of Homeless Services only accounts for the sheltered homeless population, which does not capture the total number of individuals experiencing homelessness. It also does not include families and individuals in other types of shelters as noted in the footnote accompanying the figure.
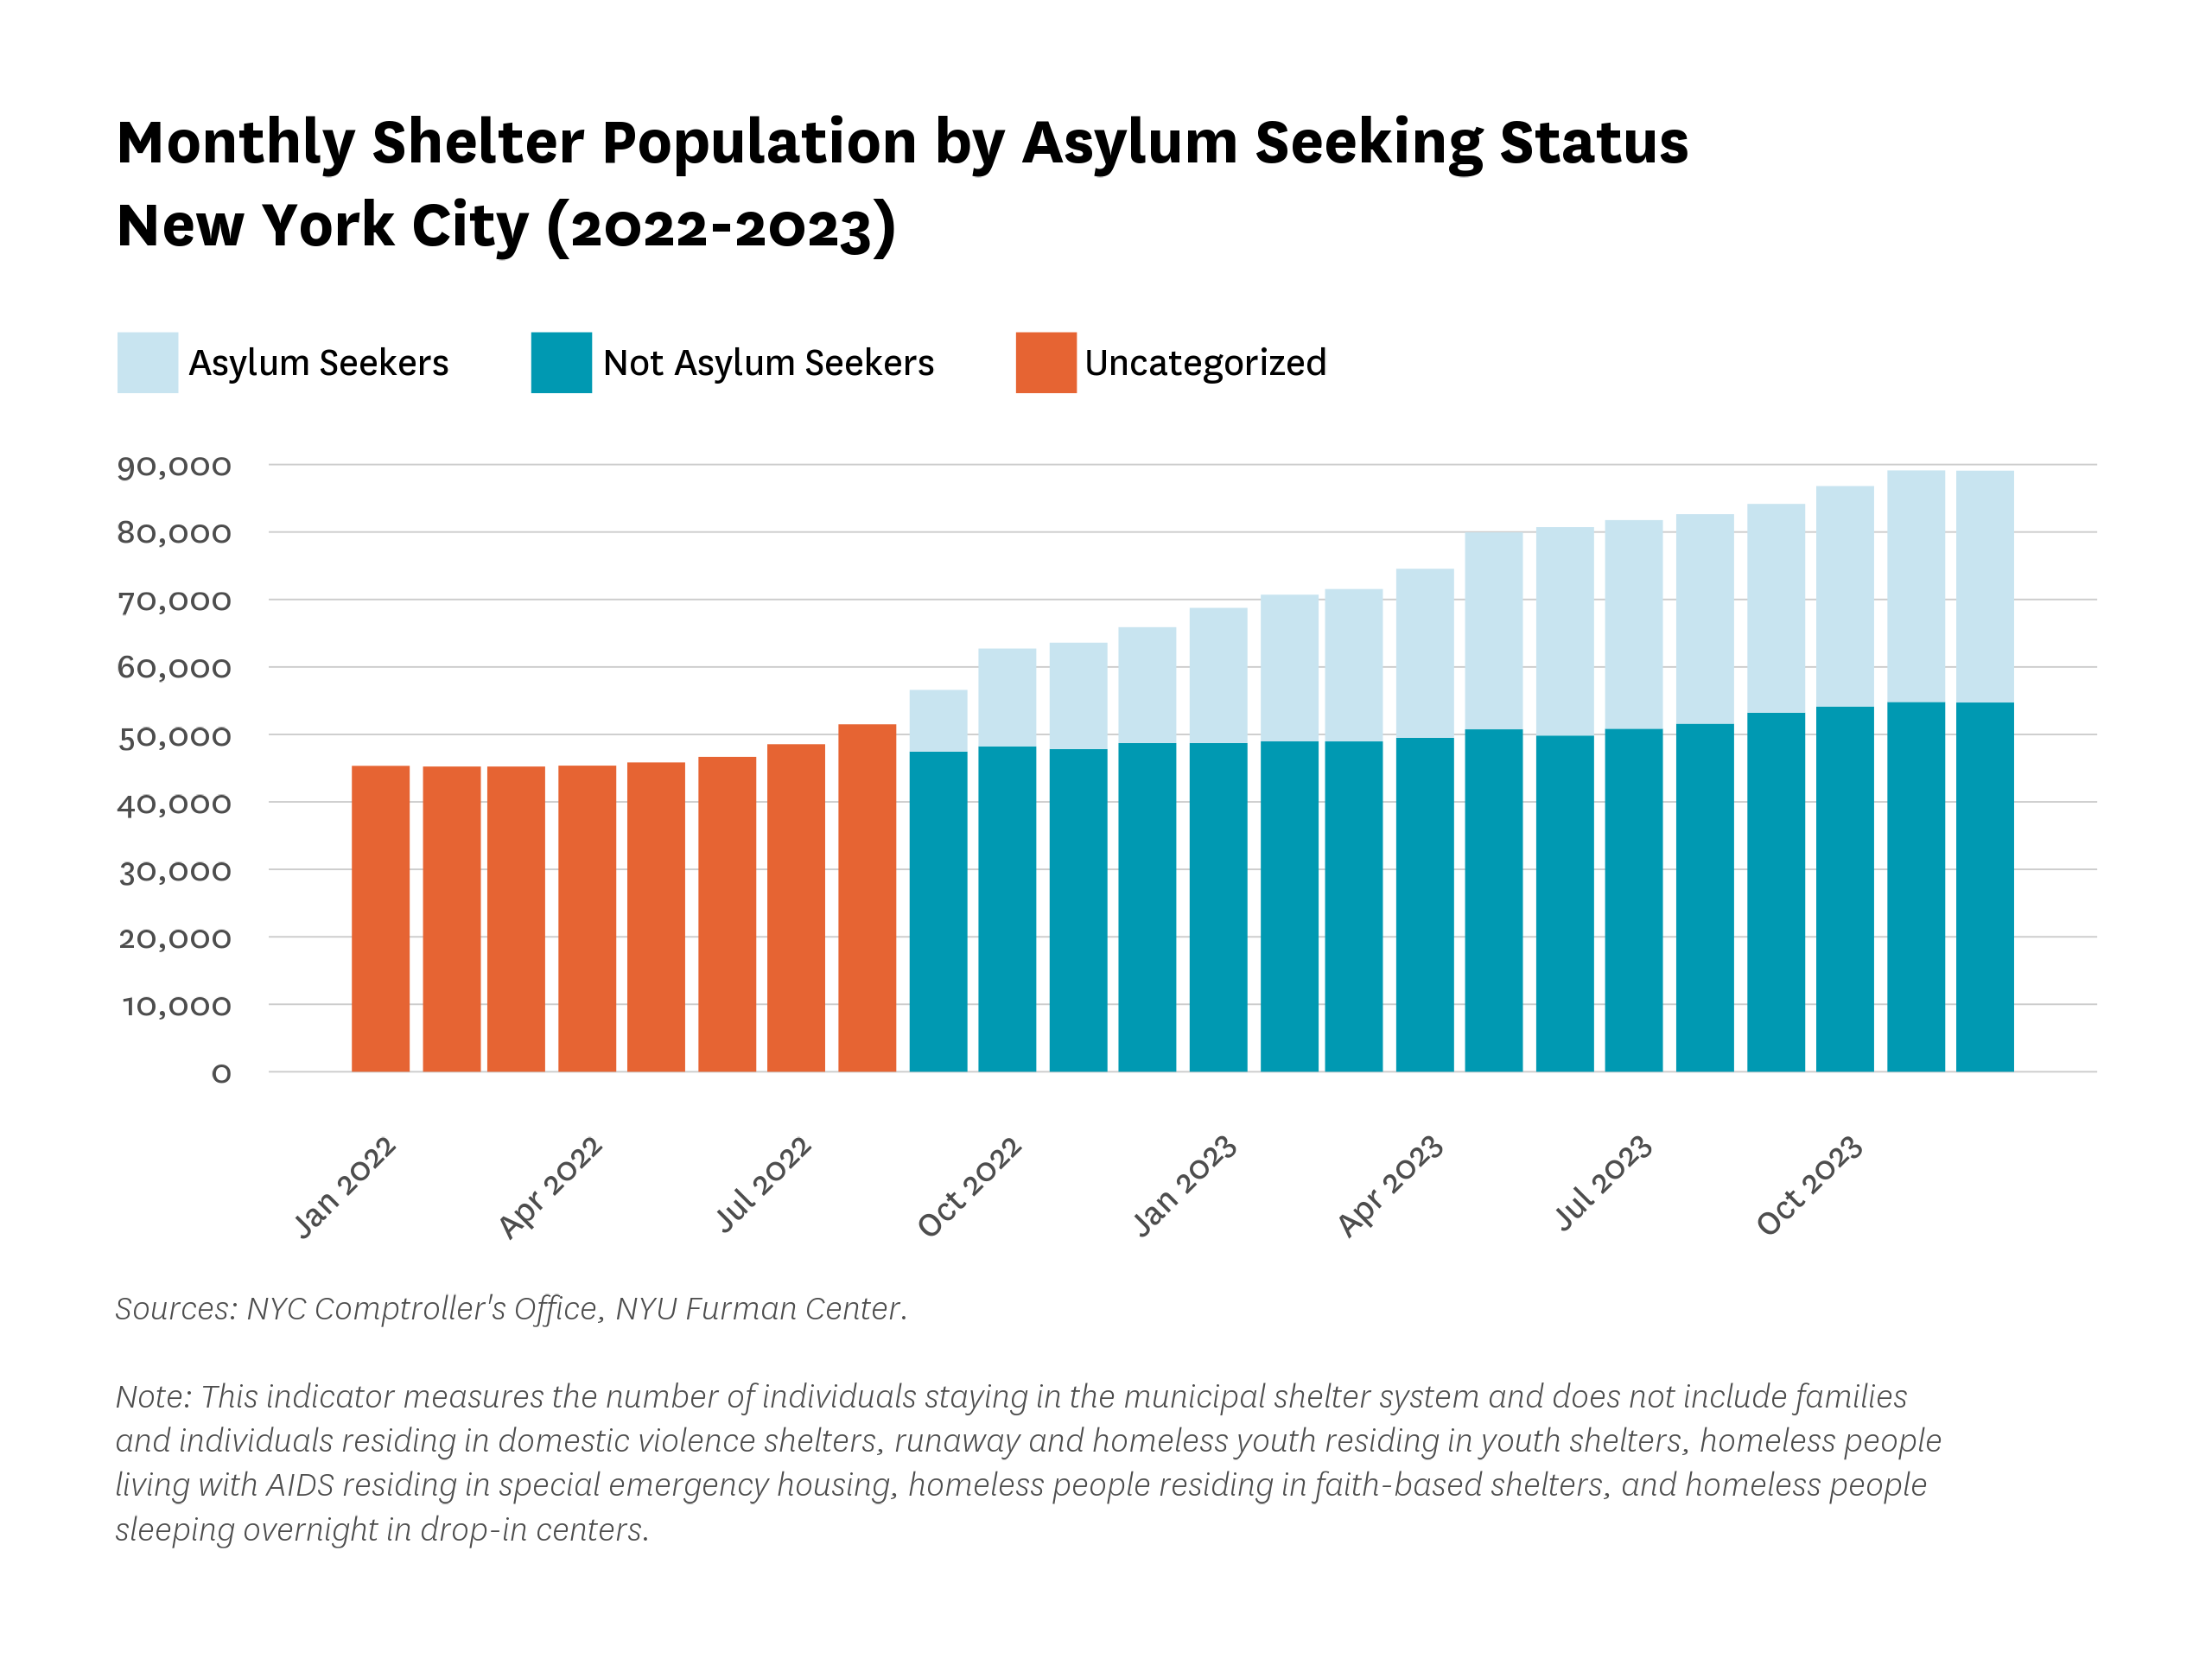
An increase in asylum seekers staying in homeless shelters drove most of the increase in the number of people staying in homeless shelters between 2022 and 2023, though less than 40 percent of the people staying in homeless shelters are asylum seekers.
In response to the large influx of asylum seekers arriving in the city, the New York City Comptroller’s Office started monitoring the count of asylum seekers in Department of Homeless Services shelters. Before this data was separated by asylum-seeking status in September 2022, asylum seekers were likely included in the total shelter counts, as the city has long been a destination for those seeking asylum. The count of non-asylum seekers in homeless shelters increased slightly (from around 48,000 in September 2022 to around 55,000 in December 2023) while the count of asylum seekers surged by 276 percent. While asylum seekers still make up less than 40 percent of the total shelter population, the sharp increase in their population was the primary driver of the overall rise in the shelter population between 2022 and 2023.
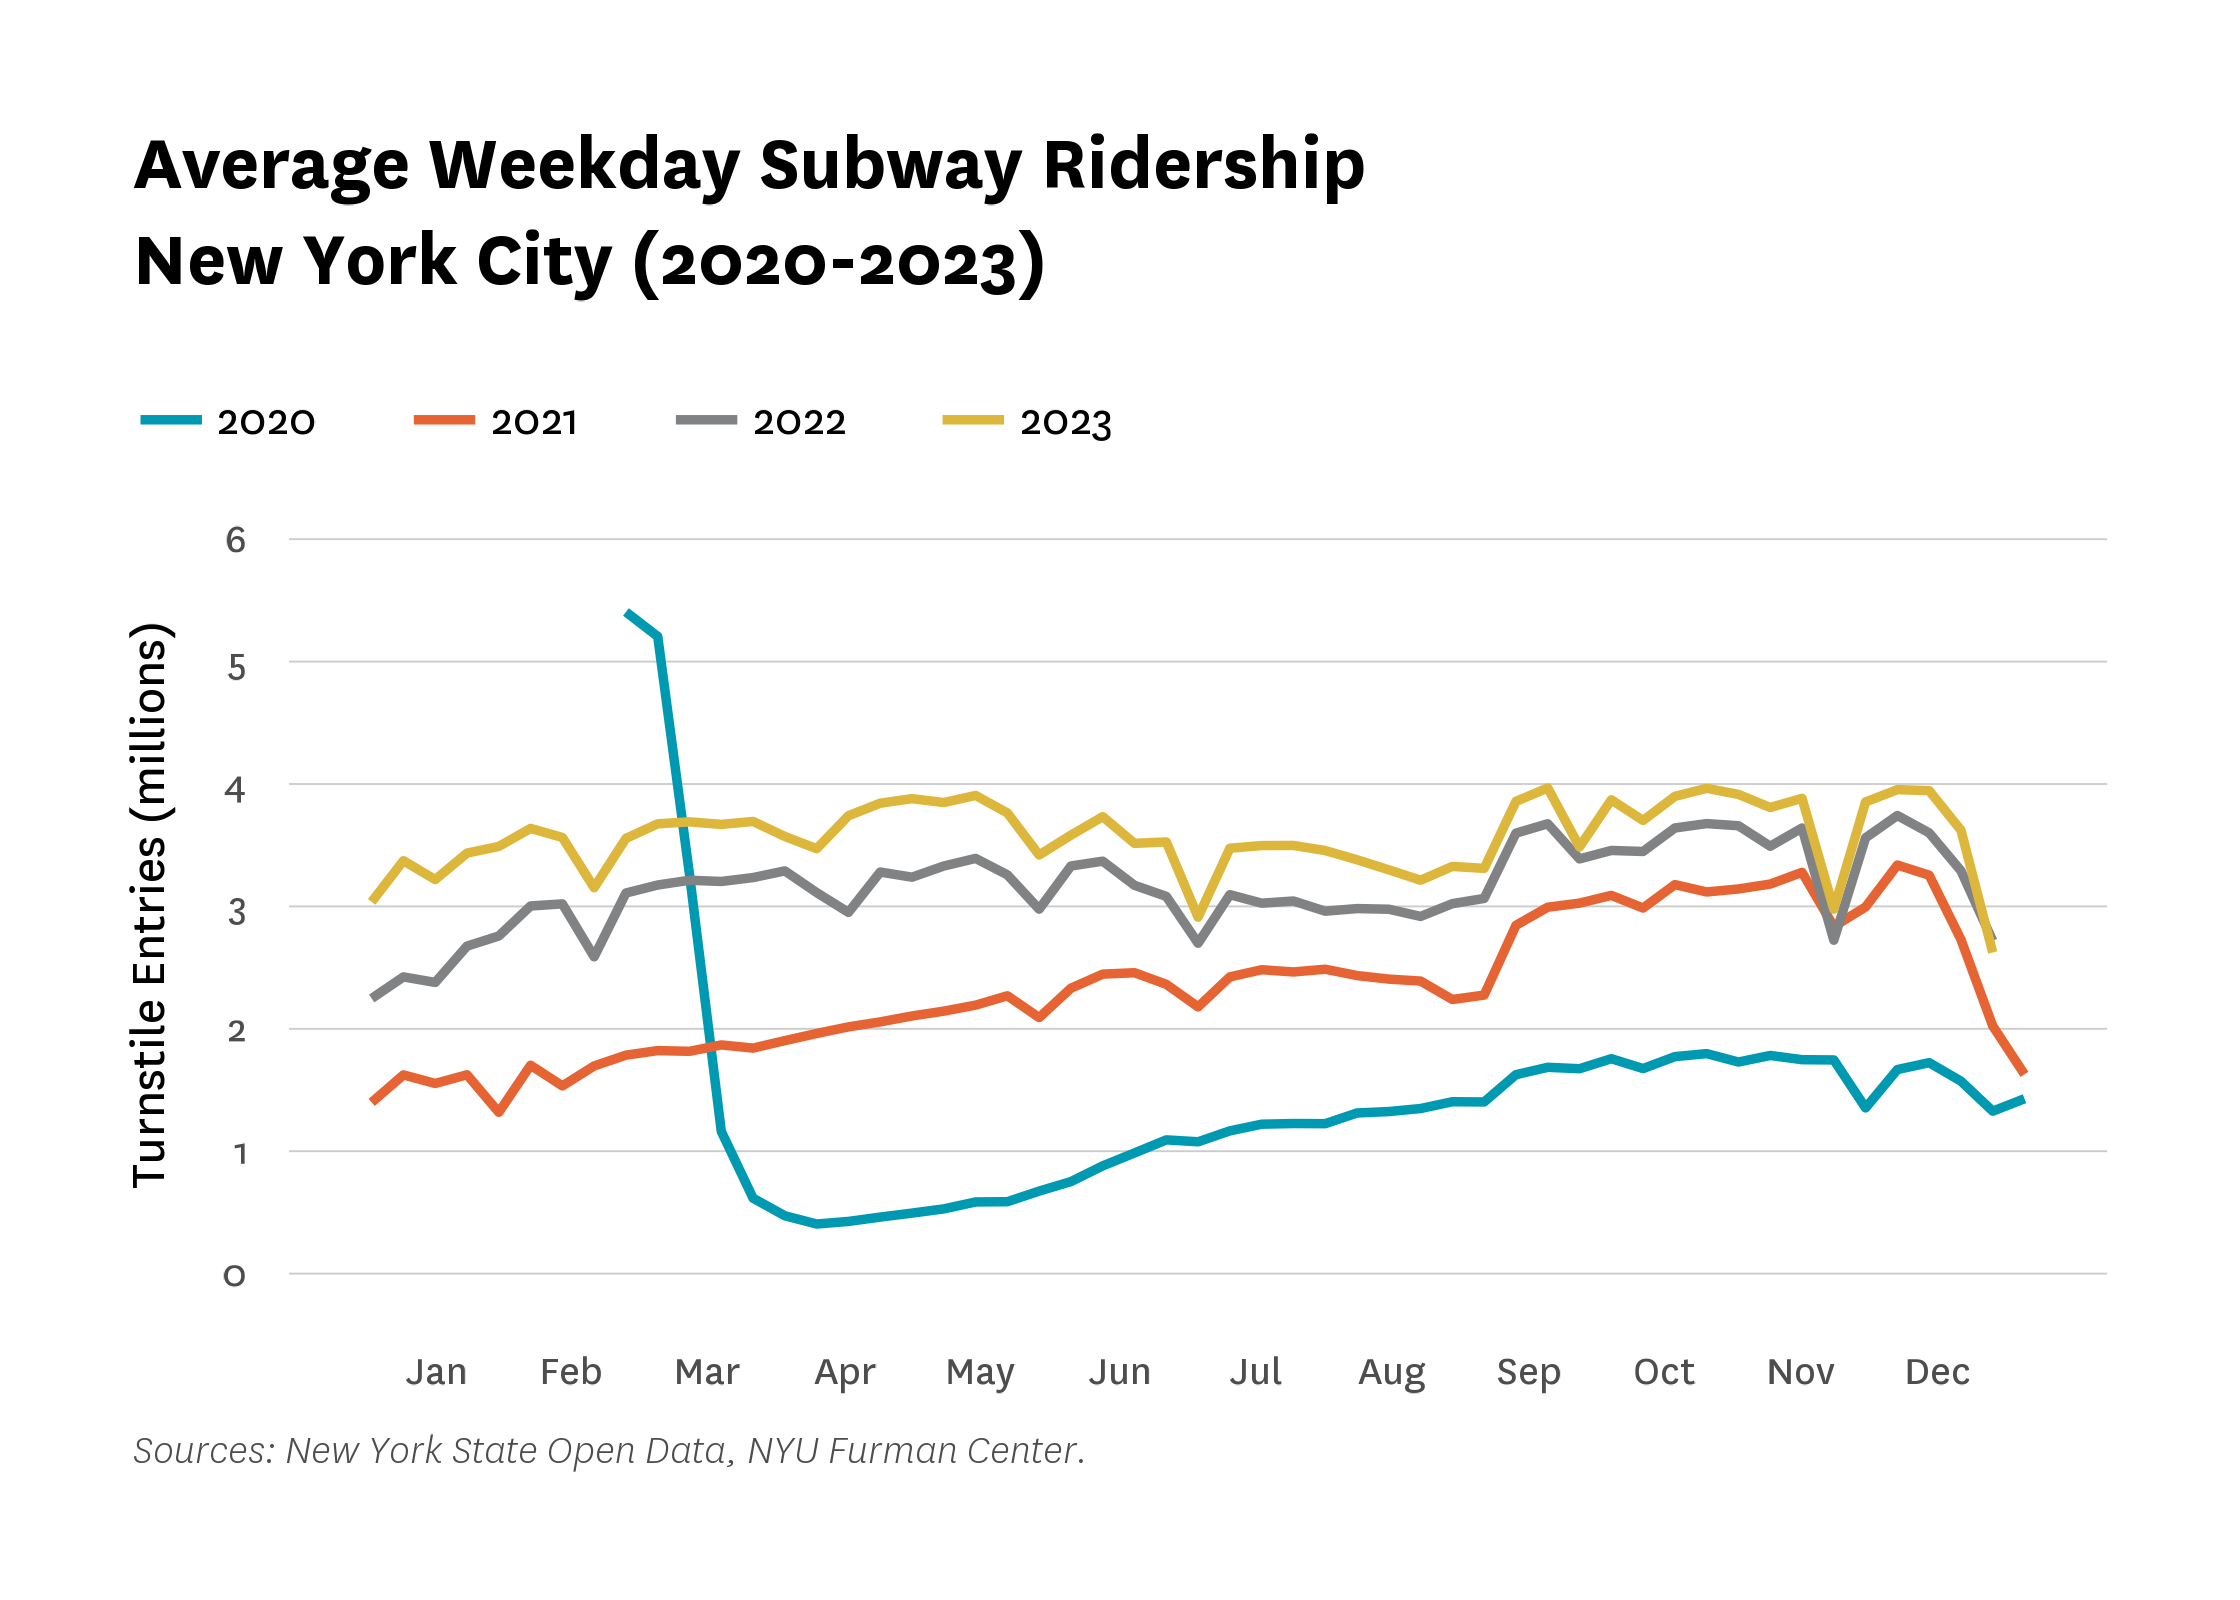
Average weekday subway ridership increased between 2022 and 2023, but remained well below pre-pandemic levels.
Weekday subway ridership slightly recovered in 2023, ranging from about 2.9M entries the week of July 4th to a peak of over 3.9M entries in late October. Ridership in early March 2023 was 15.7 percent higher than the same time period in 2022, but was still 33.9 percent lower than the ridership of 5.4M entries in early March 2020, just prior to the start of the pandemic and economic shutdown. These ridership counts are likely influenced by several macroeconomic trends, including the persistence of work-from-home policies and preferences. Others include fluctuations in tourism, service quality, fare policies, crime rates, and competing modes of transportation.