
Disparities Within Class 2
I. Within Class 2, do large rental properties pay a disproportionate share of the property tax levy compared to coops and condos?
In considering different approaches to reforming New York City’s property tax system, we focus on a foundational issue: the calculation of a property’s market value. The current practice of valuing coops and condos by comparing them to large rental properties (with 11+ units) systematically undervalues coop and condo properties, particularly the most expensive units. In New York City’s class share system, the structural undervaluation of coops and condos shifts a greater share of the Class 2 tax levy onto large rental buildings. This results in condo and coop effective tax rates (ETRs, or the tax levy divided by market value), when using the sales-based values, that are far lower than those of larger rental properties.
Using DOF’s 2025 market values, larger rental buildings have the highest effective tax rates within Class 2 properties.
Rental properties with 11 or more units have the highest effective tax rates among Class 2 property types (Table 1). Larger rental buildings account for 40.7 percent of the class’s total tax levy while representing slightly more than a third of market value in 2025. This results in an effective tax rate (tax levy divided by market value) of 4.4 percent, the highest among residential property categories.
Smaller rental buildings, including 4–6 unit and 7–10 unit properties, have notably lower effective tax rates – both are 1.9 percent. As we show in Section 1, the assessed values of smaller buildings are capped both annually and on five-year cycles, which leads to an artificially lower assessed value, and consequently a lower tax burden, over time.
In comparison, larger condo and coop buildings’ share of the class’s market value (as defined by DOF) and their share of the tax levy are roughly aligned.1 As shown in Table 1, the effective tax rate of 3.8 percent for larger condos and 4.0 percent for coops may make it seem like they are effectively paying a similar tax as other larger rental buildings.
However, the rental income-based assessment methodology used by DOF notably underestimates the actual market values of coops and condos. As a result, the condo and coop ETR here, which uses these underestimates, is overstated because the DOF estimates of market values are significantly lower than the properties’ actual values.
Table 1:
| Tax Class 2 Properties, Tax Levy, DOF Market Value, and ETR (FY 2025) | |||||
| Property Type |
Tax Levy
|
DOF Market Value
|
ETR | ||
|---|---|---|---|---|---|
| $ Billions | % of Class 2 Levy | $ Billions | % of Class 2 MV | ||
| Condos | $3.7 | 26.9% | $96.5 | 26.1% | 3.8% |
| Coops | $3.0 | 22.0% | $72.8 | 19.7% | 4.1% |
| Large Rentals | $5.6 | 40.7% | $125.4 | 34.0% | 4.4% |
| Small Rentals | $1.4 | 10.4% | $74.4 | 20.2% | 1.9% |
| Total | $13.7 | 100.0% | $369.2 | 100.0% | 3.7% |
| Sources: NYC Department of Finance, NYU Furman Center | |||||
Using sales-based market values instead of DOF values, large rental buildings continue to have the highest effective tax rates within Class 2 properties—and disparities between large rental buildings and condos and coops grow.
Because the rental income-based assessment methodology used by DOF notably underestimates the market value of coops and condos, throughout the rest of this section, we will use either DOF’s separate calculation of sales-based market values from 2021, or actual sales from 2025, to understand disparities between the amount each type of property paid in taxes relative to its value.
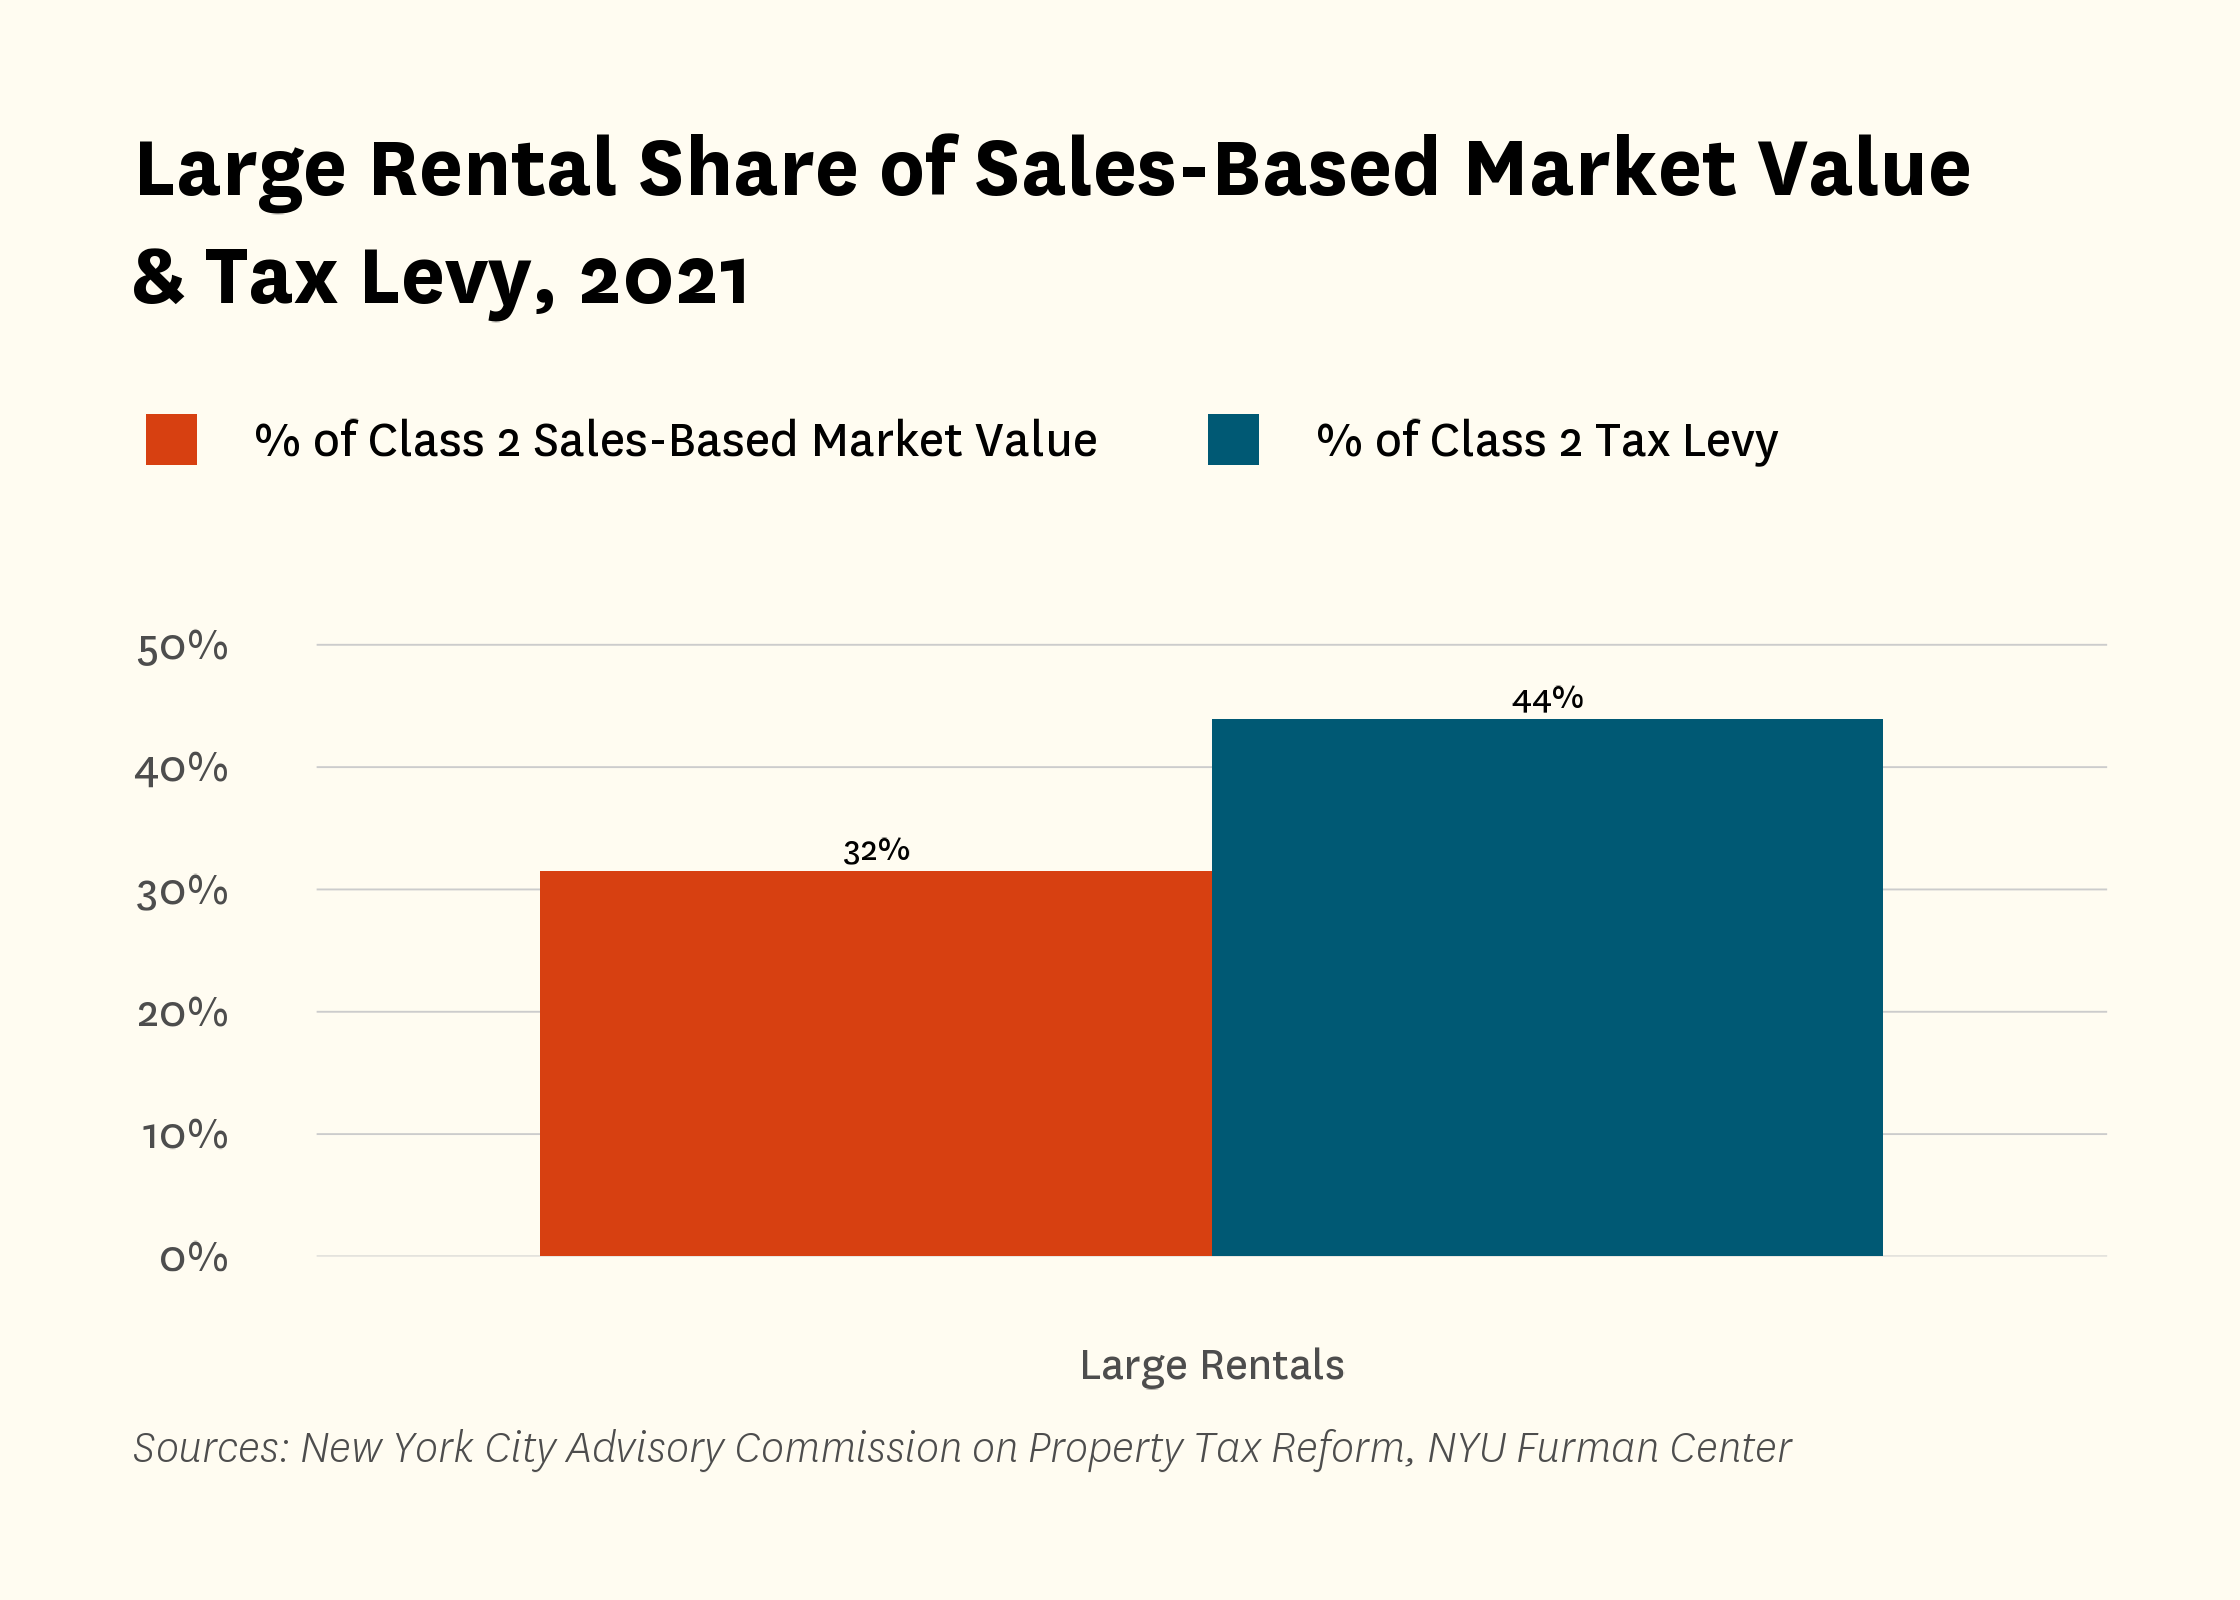
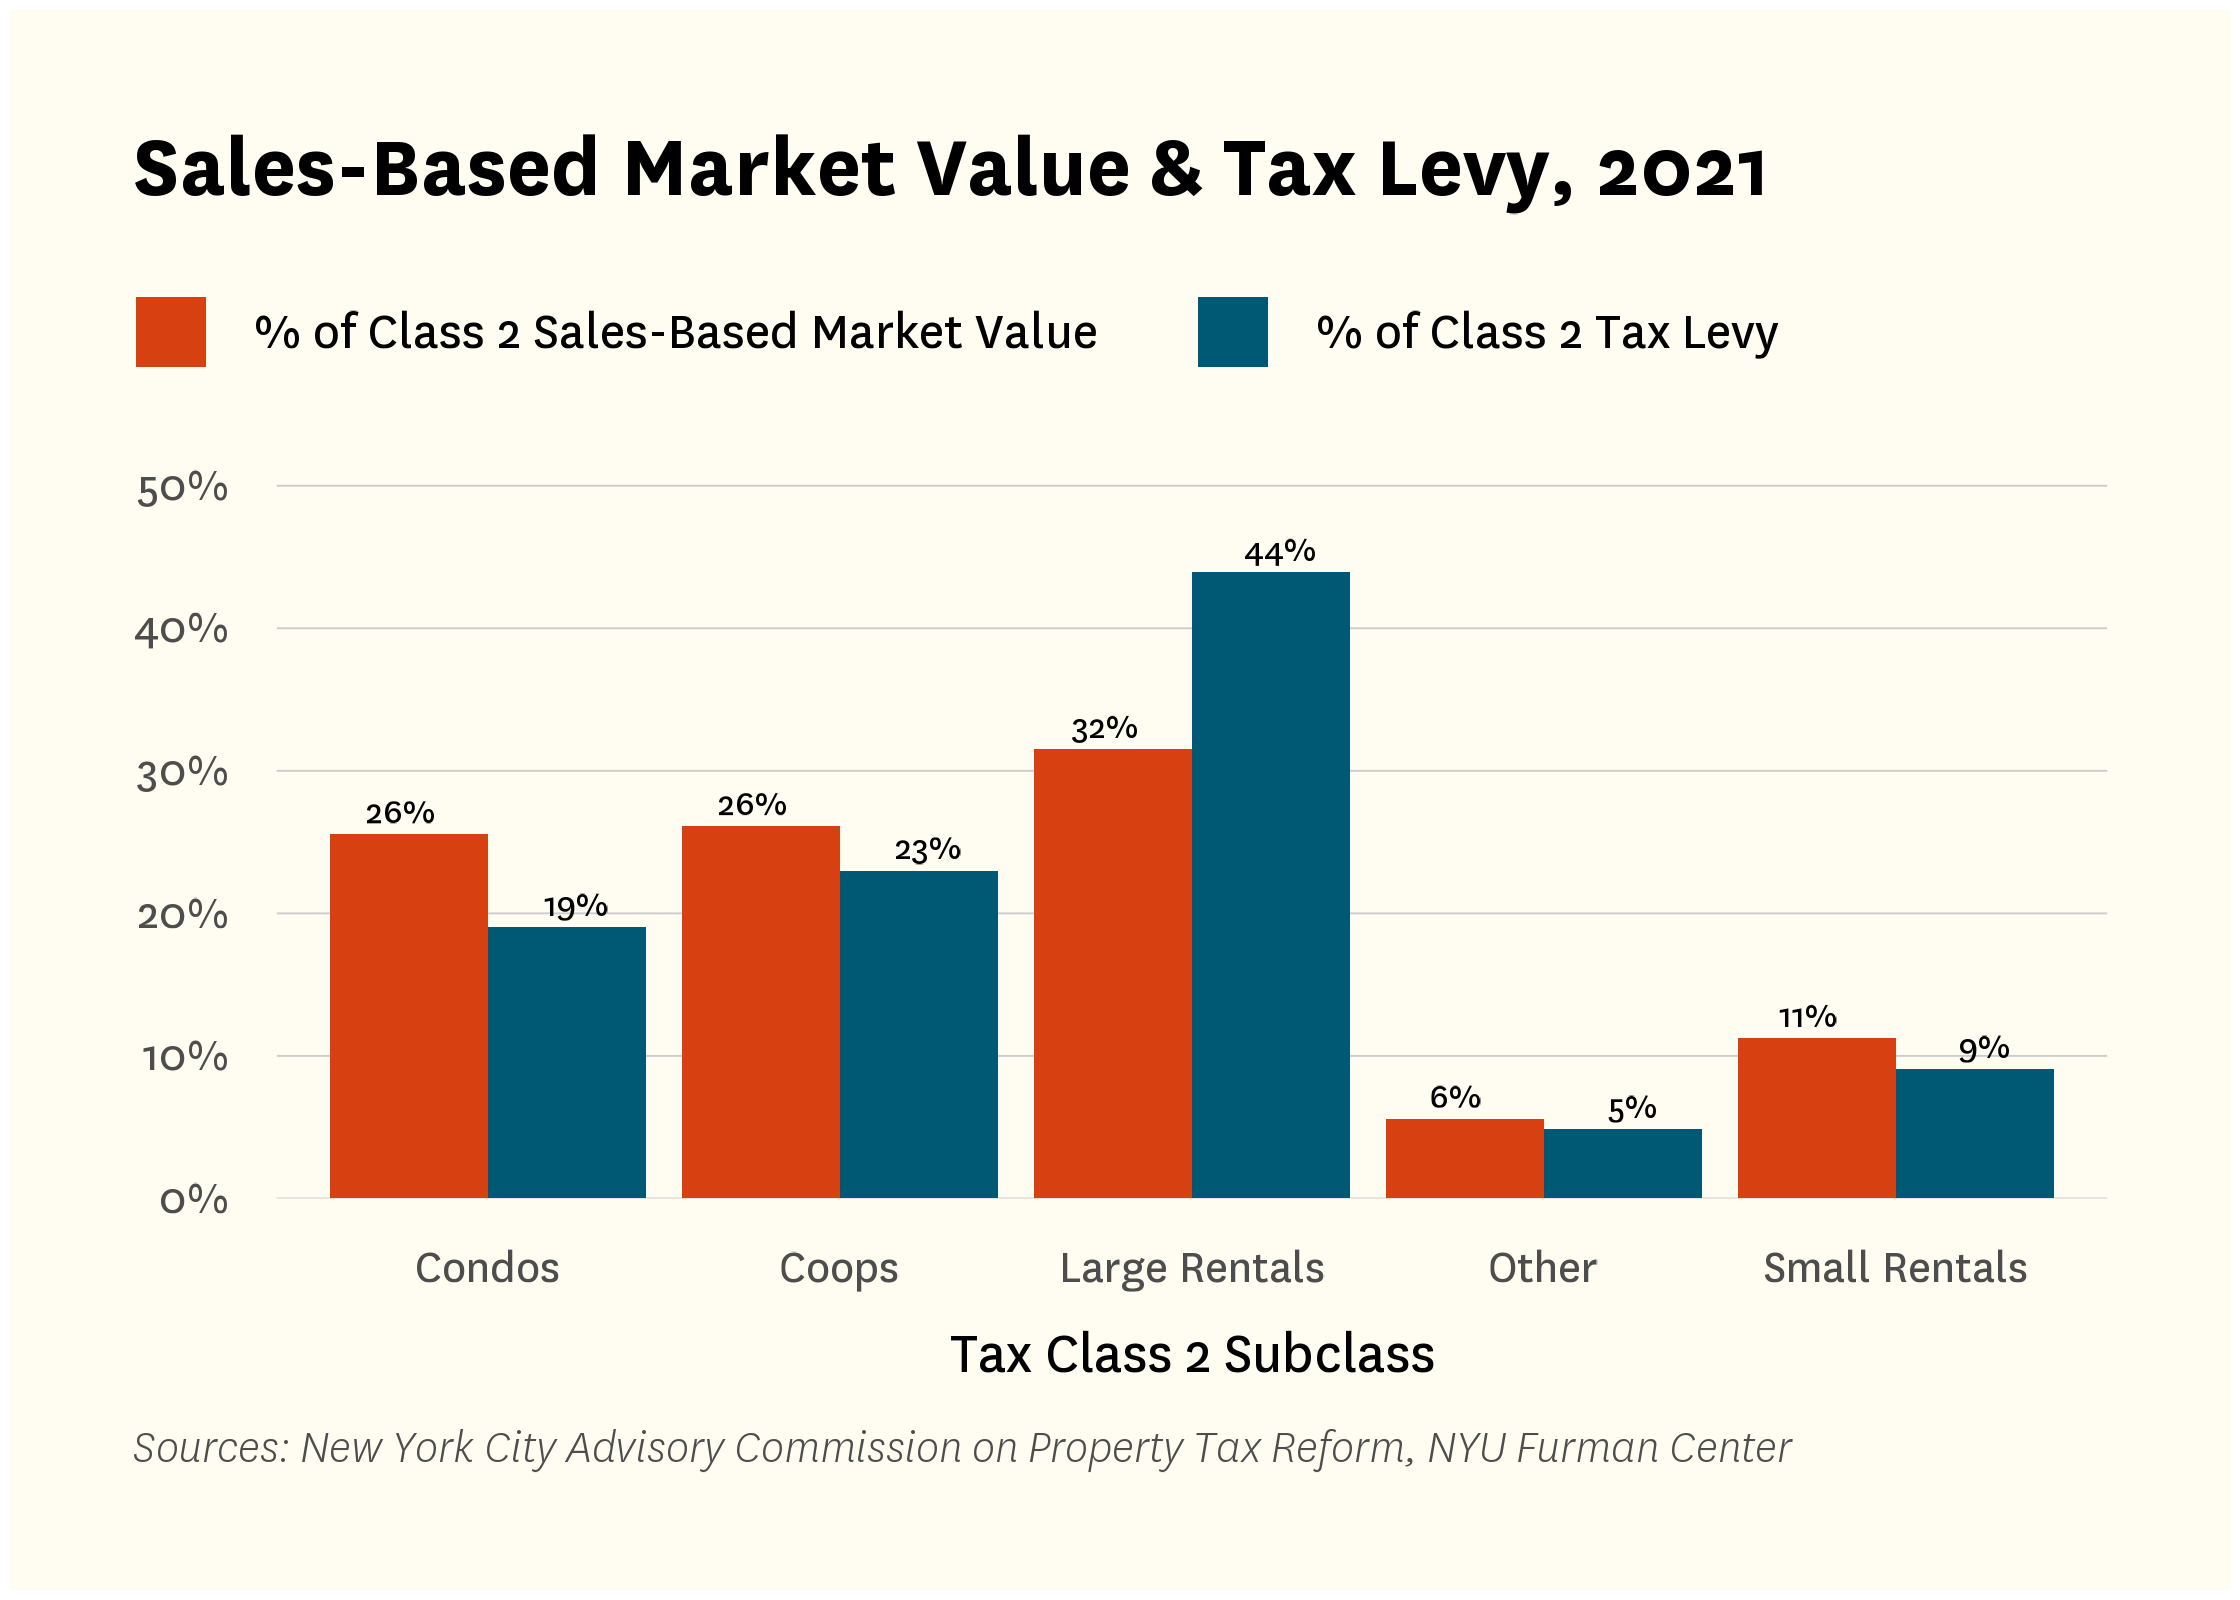
Larger rentals paid a higher share of the tax levy than their sales-based market value would justify. While larger rentals accounted for about 32 percent of Class 2’s sales-based market value in 2021, they contributed roughly 44 percent of the total tax levy and faced the highest effective tax rate among property types within Class 2.
Figure 1:
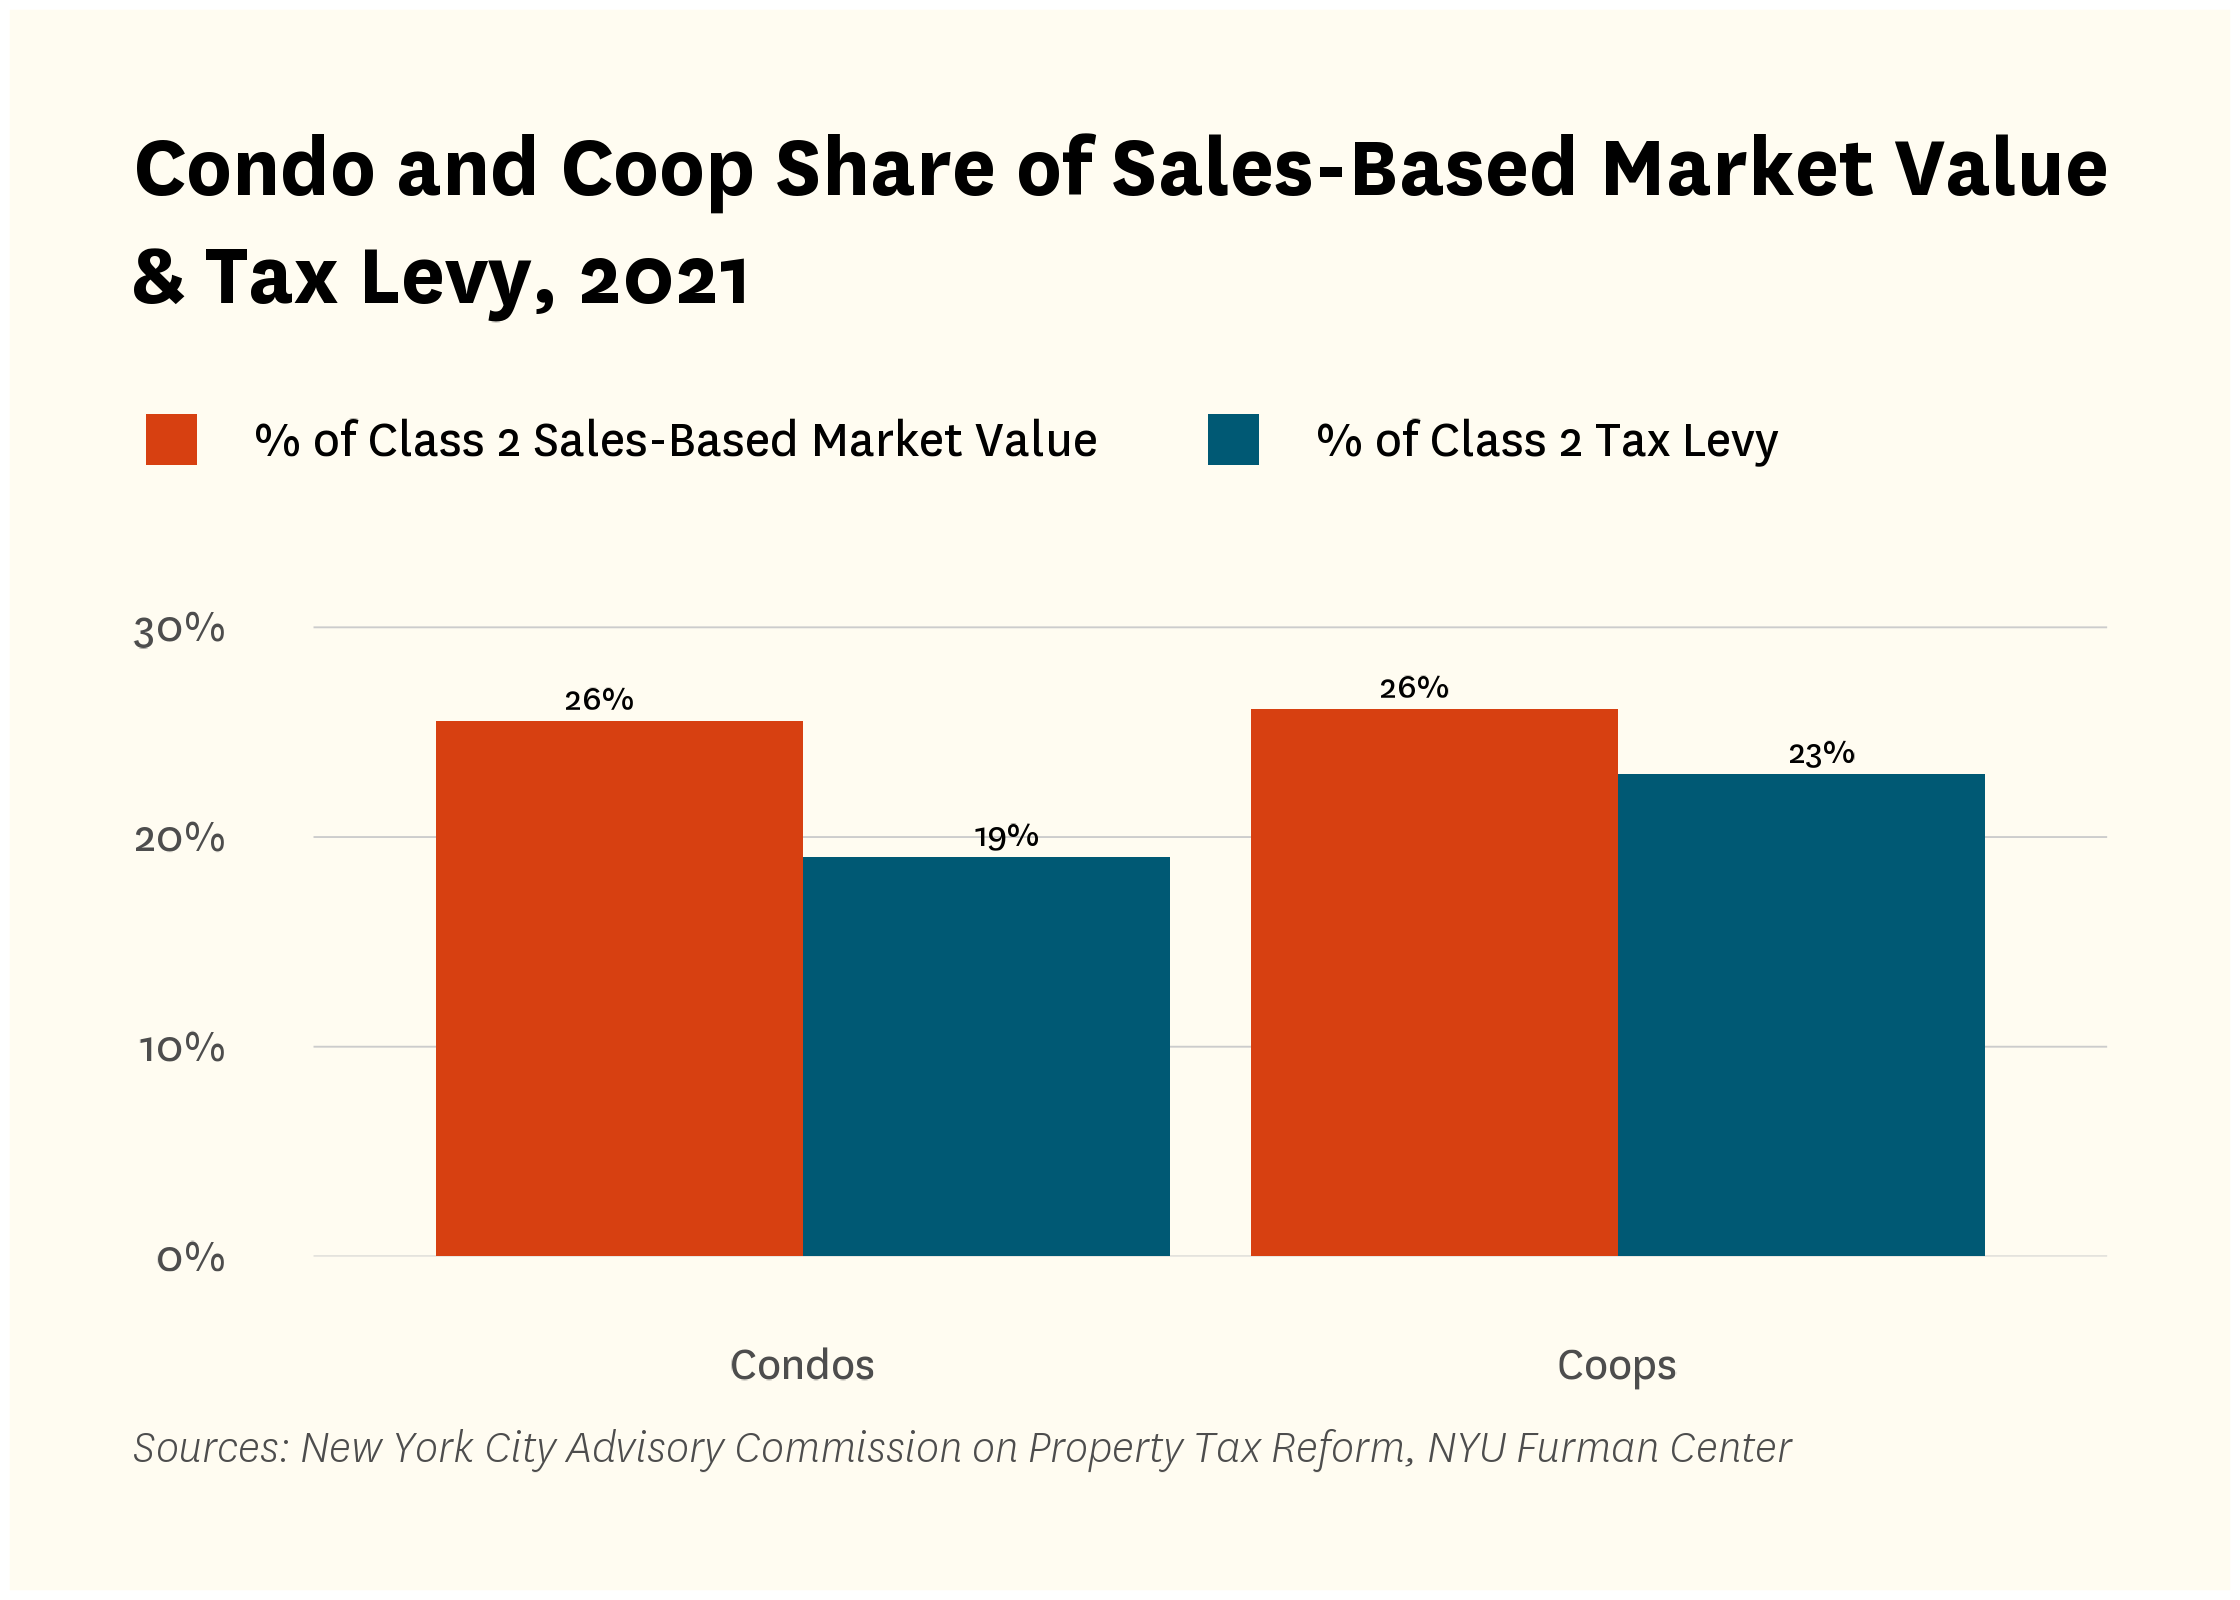
In comparison, coops and condos paid a lower share of the tax levy than their sales-based market value would warrant. Condos accounted for about 26 percent of Class 2’s sales-based market value in 2021, but they only contributed roughly 19 percent of the total tax levy. Coops accounted for about 26 percent of Class 2’s sales-based market value in 2021, but they only contributed roughly 23 percent of the total tax levy.2
Figure 2:
DOF’s income-based methodology also underestimated the true market value of coops and condos in 2025.
DOF appraises the market value of coops and condos by identifying for each property a few comparable rental properties, then uses the incomes of those comparables to estimate the property’s theoretical rental income and capitalization rate. Rental income-based assessment methods will tend to rely on comparisons to older, sometimes rent-stabilized buildings and so this approach tends to undervalue higher-value units. The income-based approach may also undervalue coops and condos because it is not possible to value common interest percentages while a sale will capture that additional source of value. Sales-based market values offer another approach that could be used to capture the value of coops and condos.
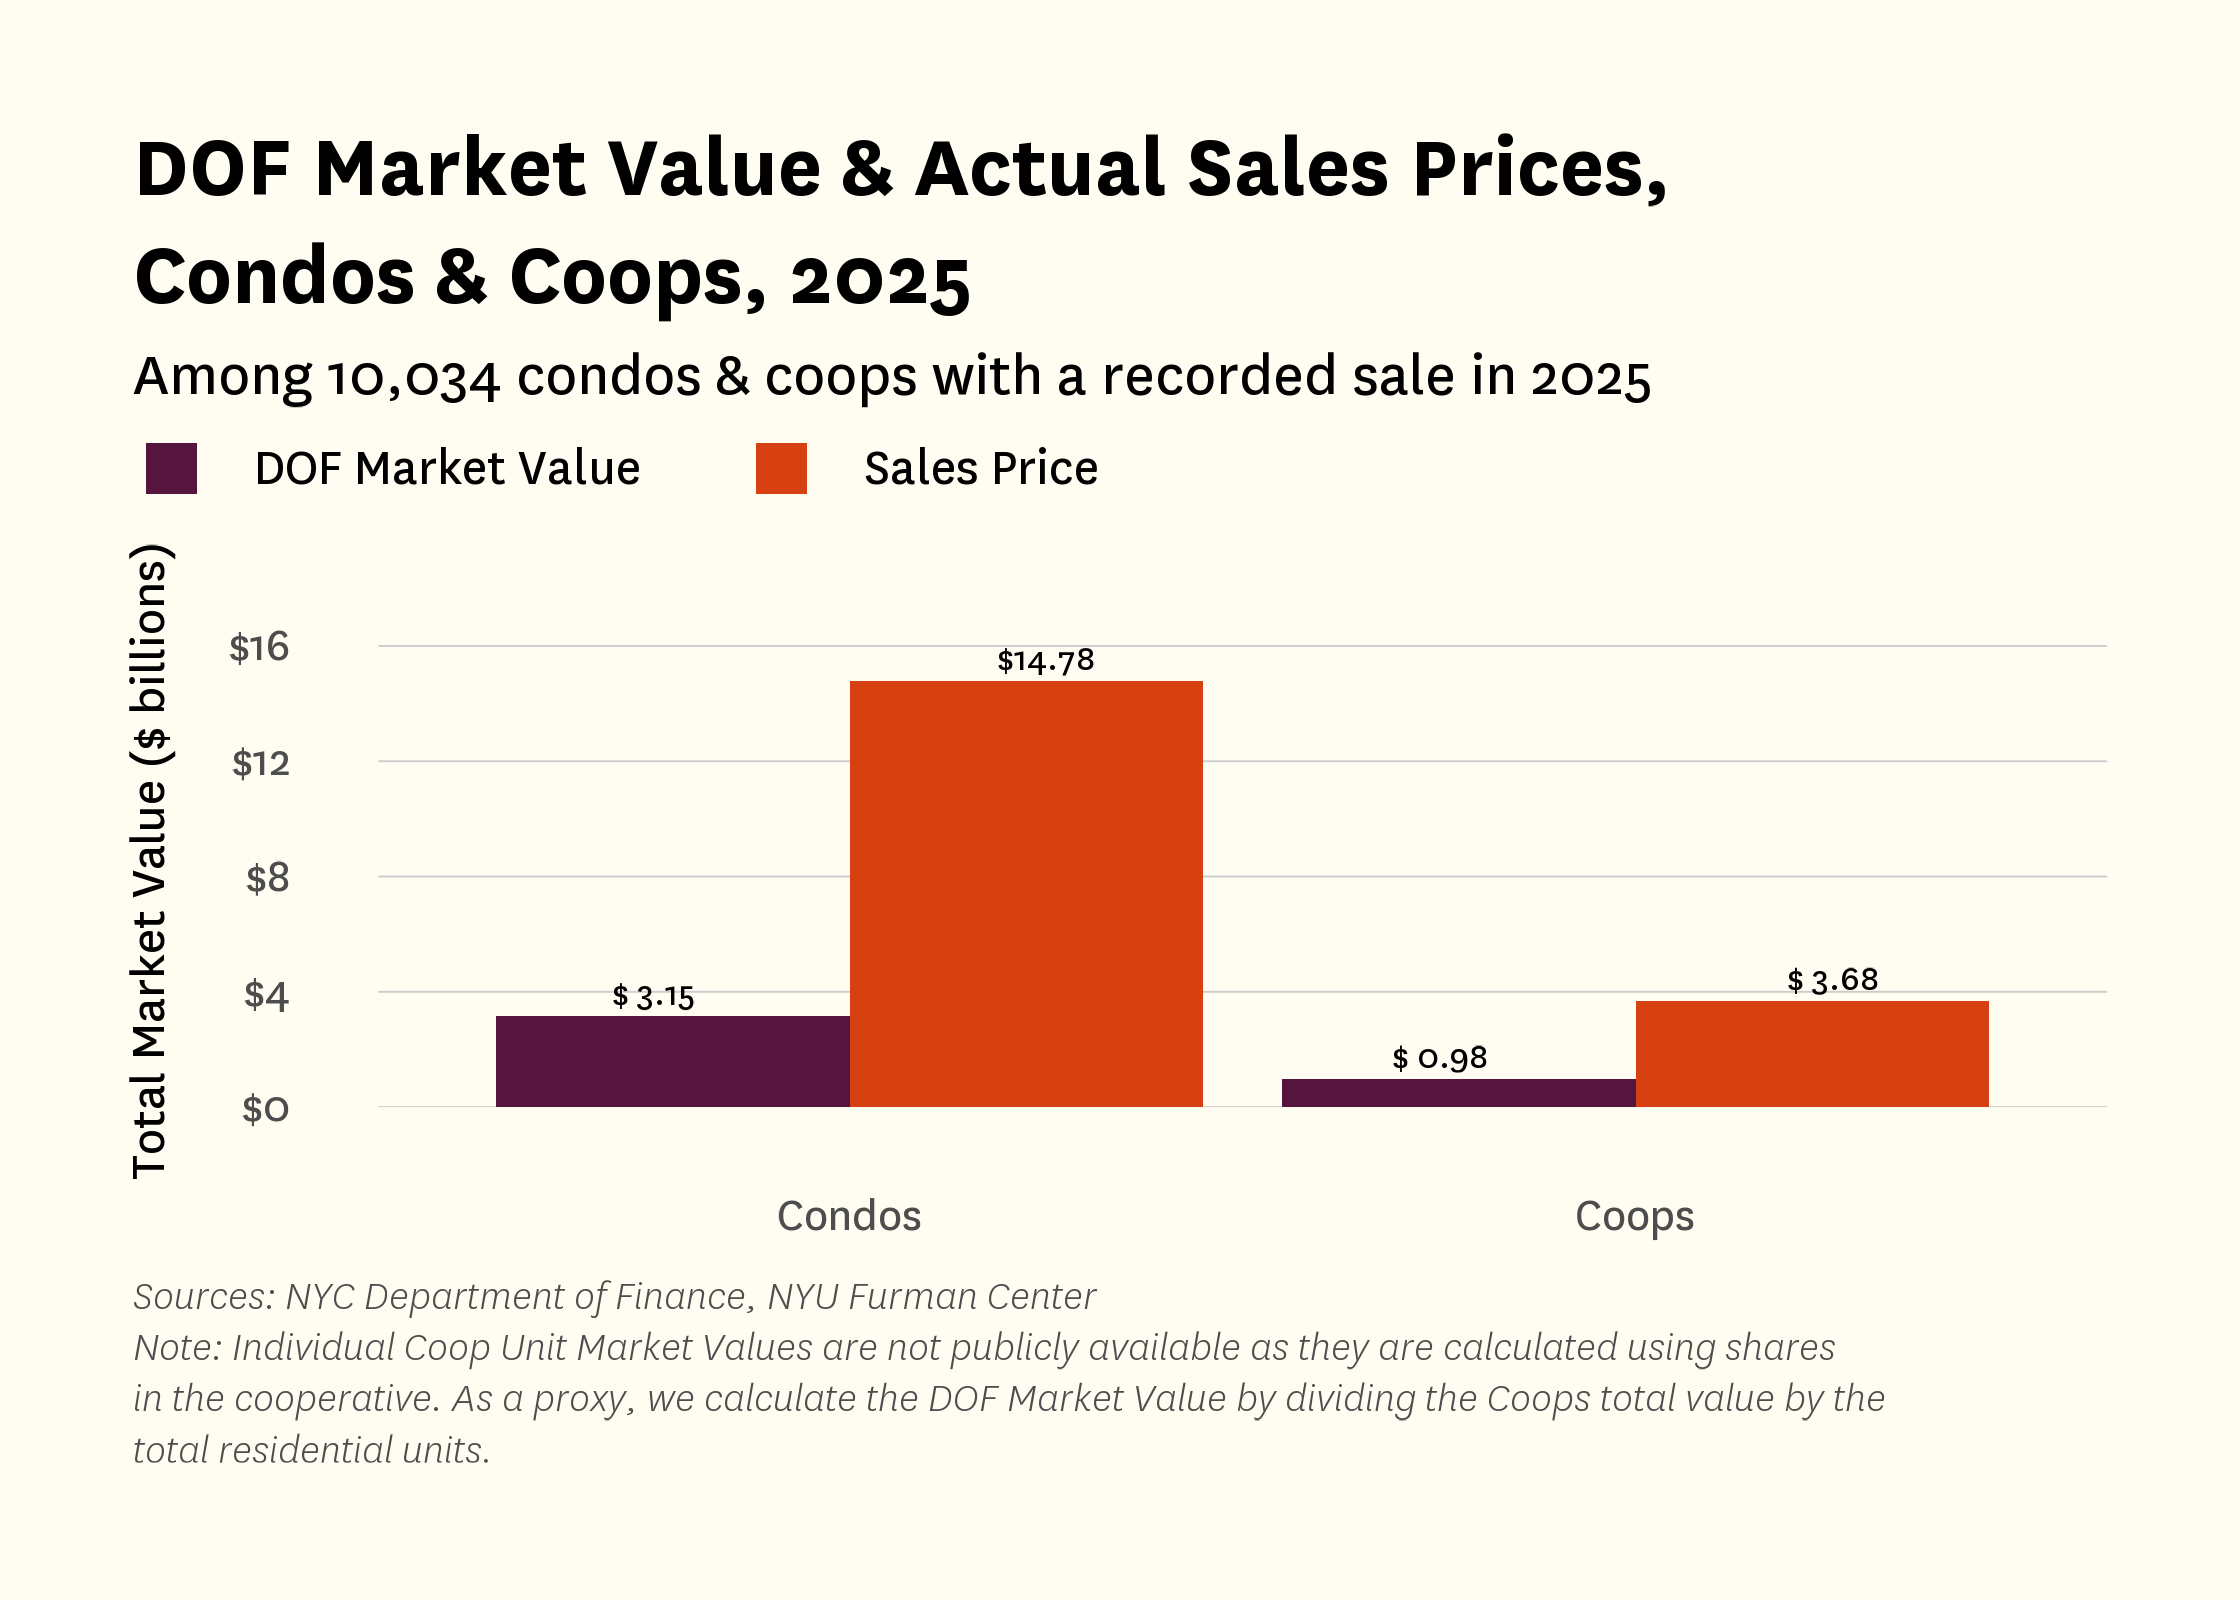
To examine in more detail the degree of difference between the two approaches, we compared the actual sales prices of more than 10,000 coops and condos sold in 2025 to the DOF market values for those same properties.3 We found that DOF’s methodology systematically undervalued the properties and that the degree of undervaluation varied systematically with market value. In fact, the DOF market value of condo properties was only 21 percent of the actual sales-based value, and for coops, it was just 27 percent (Figure 3). In 2021, by comparison, larger rental buildings had DOF market values that were 32 percent of their sales-based market values.4
Figure 3:
Within the coop and condo sub-class, DOF’s market values for the highest value properties fall the furthest below sales-based market values. See Figures 4 and 5. As a result, the most expensive coops and condos have the lowest relative tax burden.
Figures 4 and 5 show the difference between the two methods of assessing the values of the 10,000 coops and condos sold in 2025. The gap between actual sales prices and DOF market values across those 10,000 properties was $14.3 billion. Breaking the gap down by deciles of the properties by sales price reveals that the shortfall in DOF’s estimates of the market value of those coops and condos is predominantly in the higher-priced properties. Indeed, 43 percent of that shortfall comes from the top decile of actual 2025 sales values—properties with a sales price in excess of $3.76 million.
Figure 4:
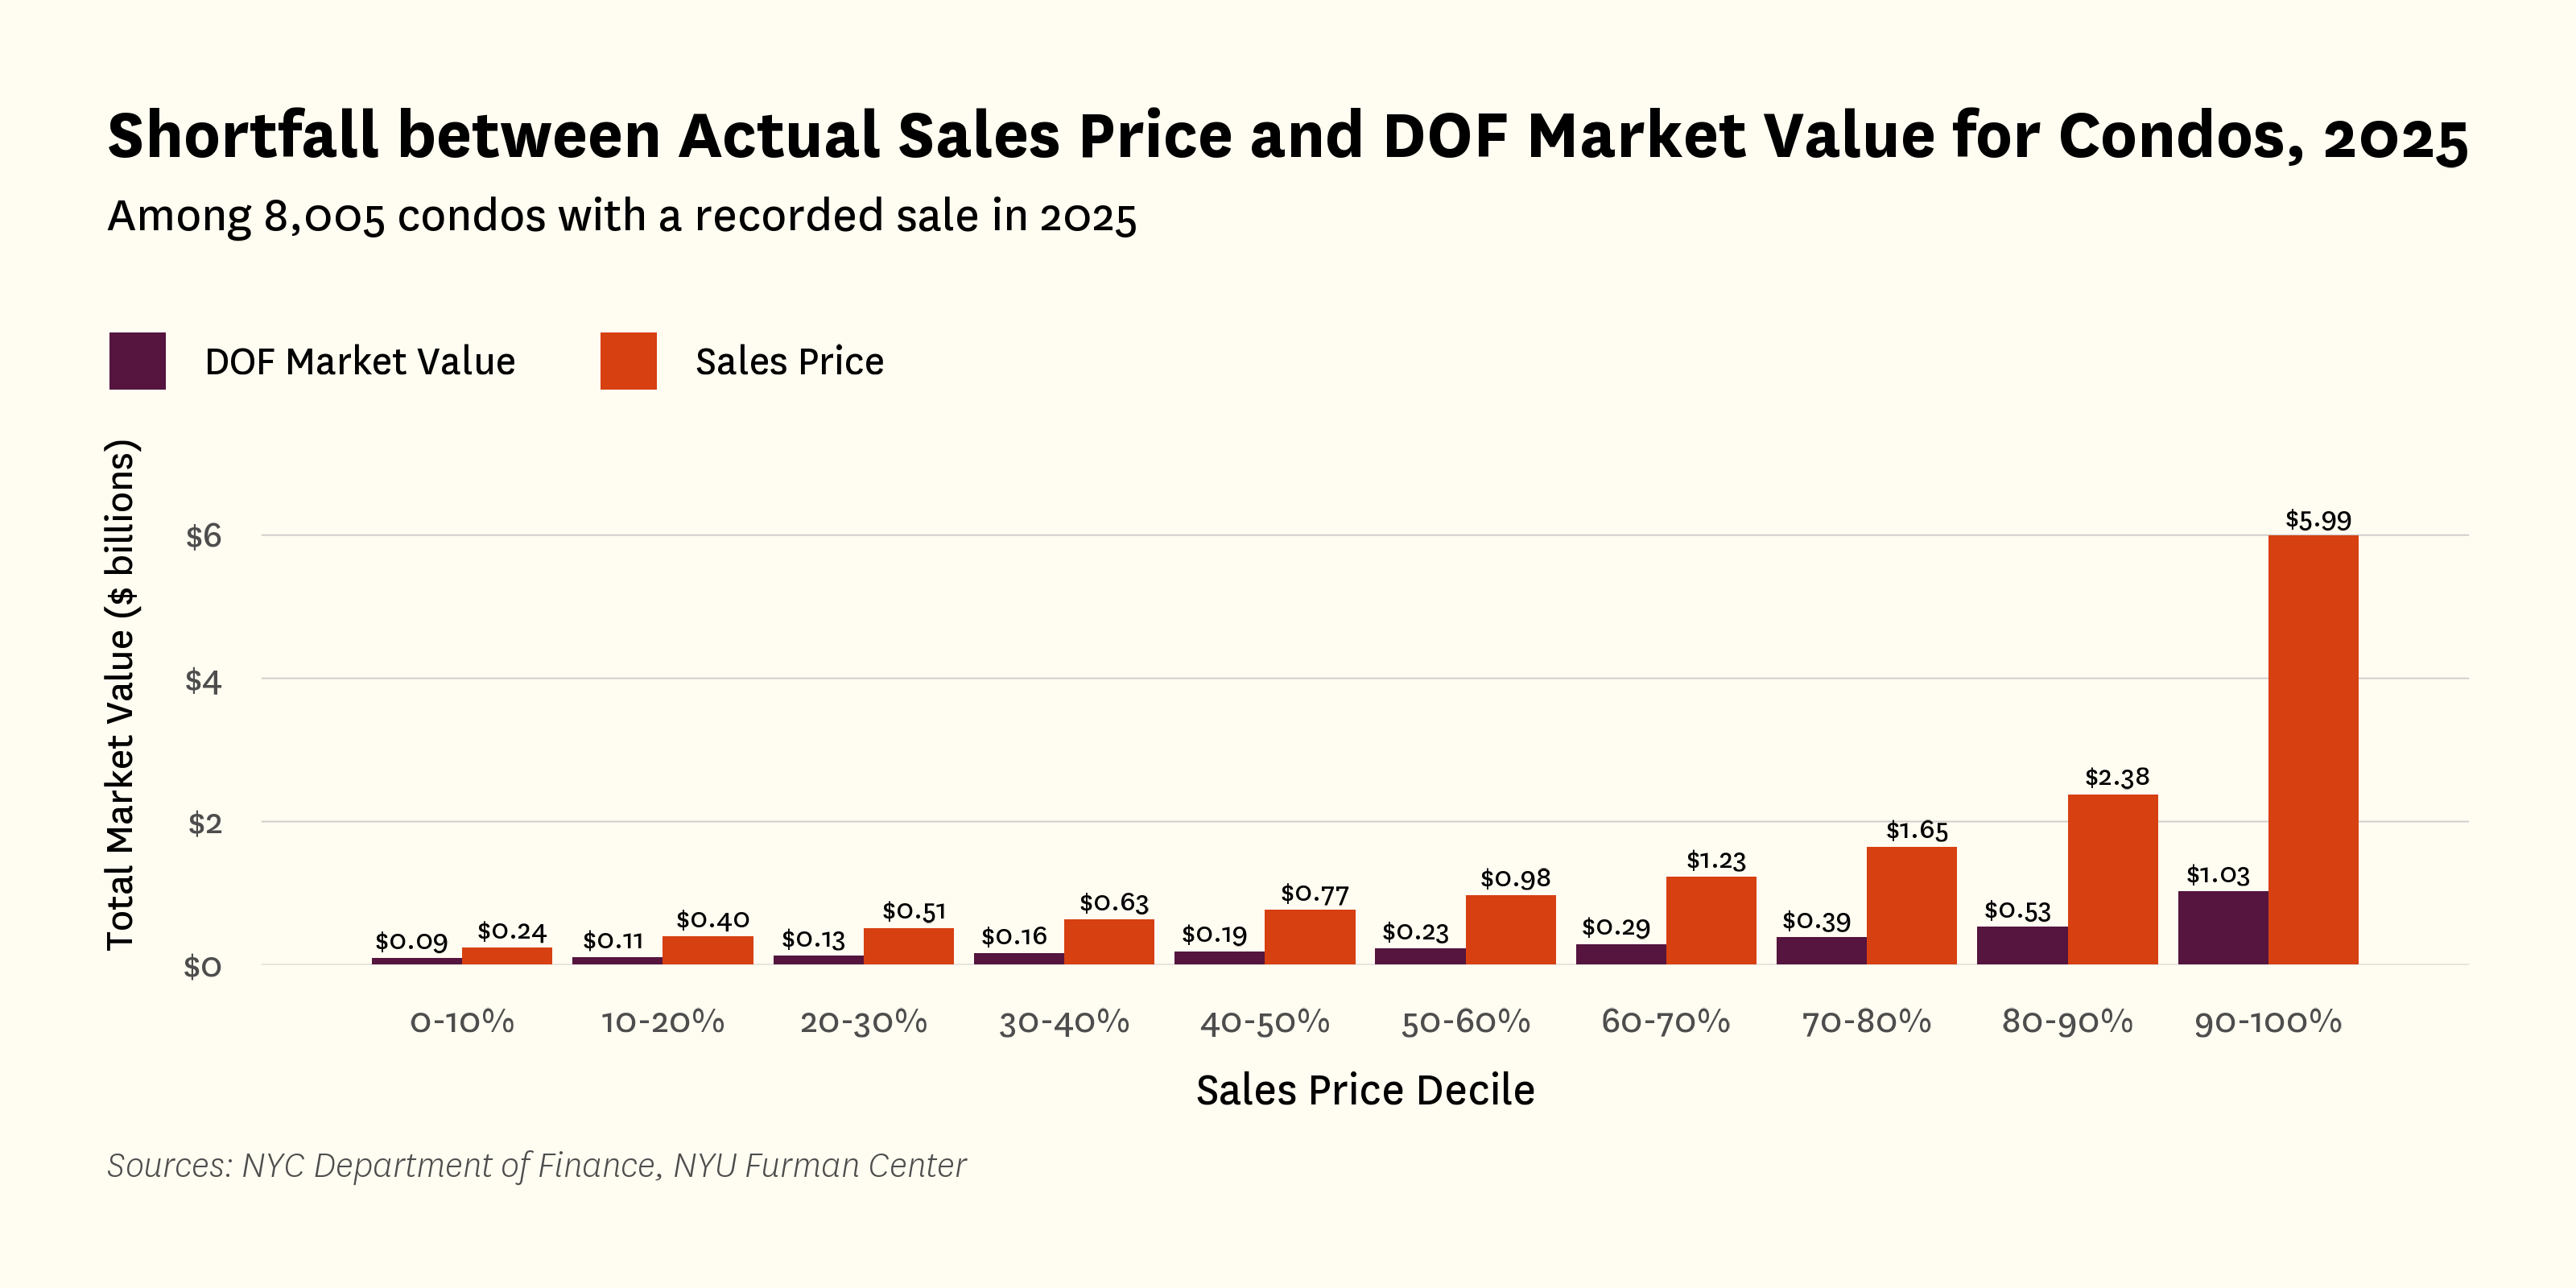
Figure 5:
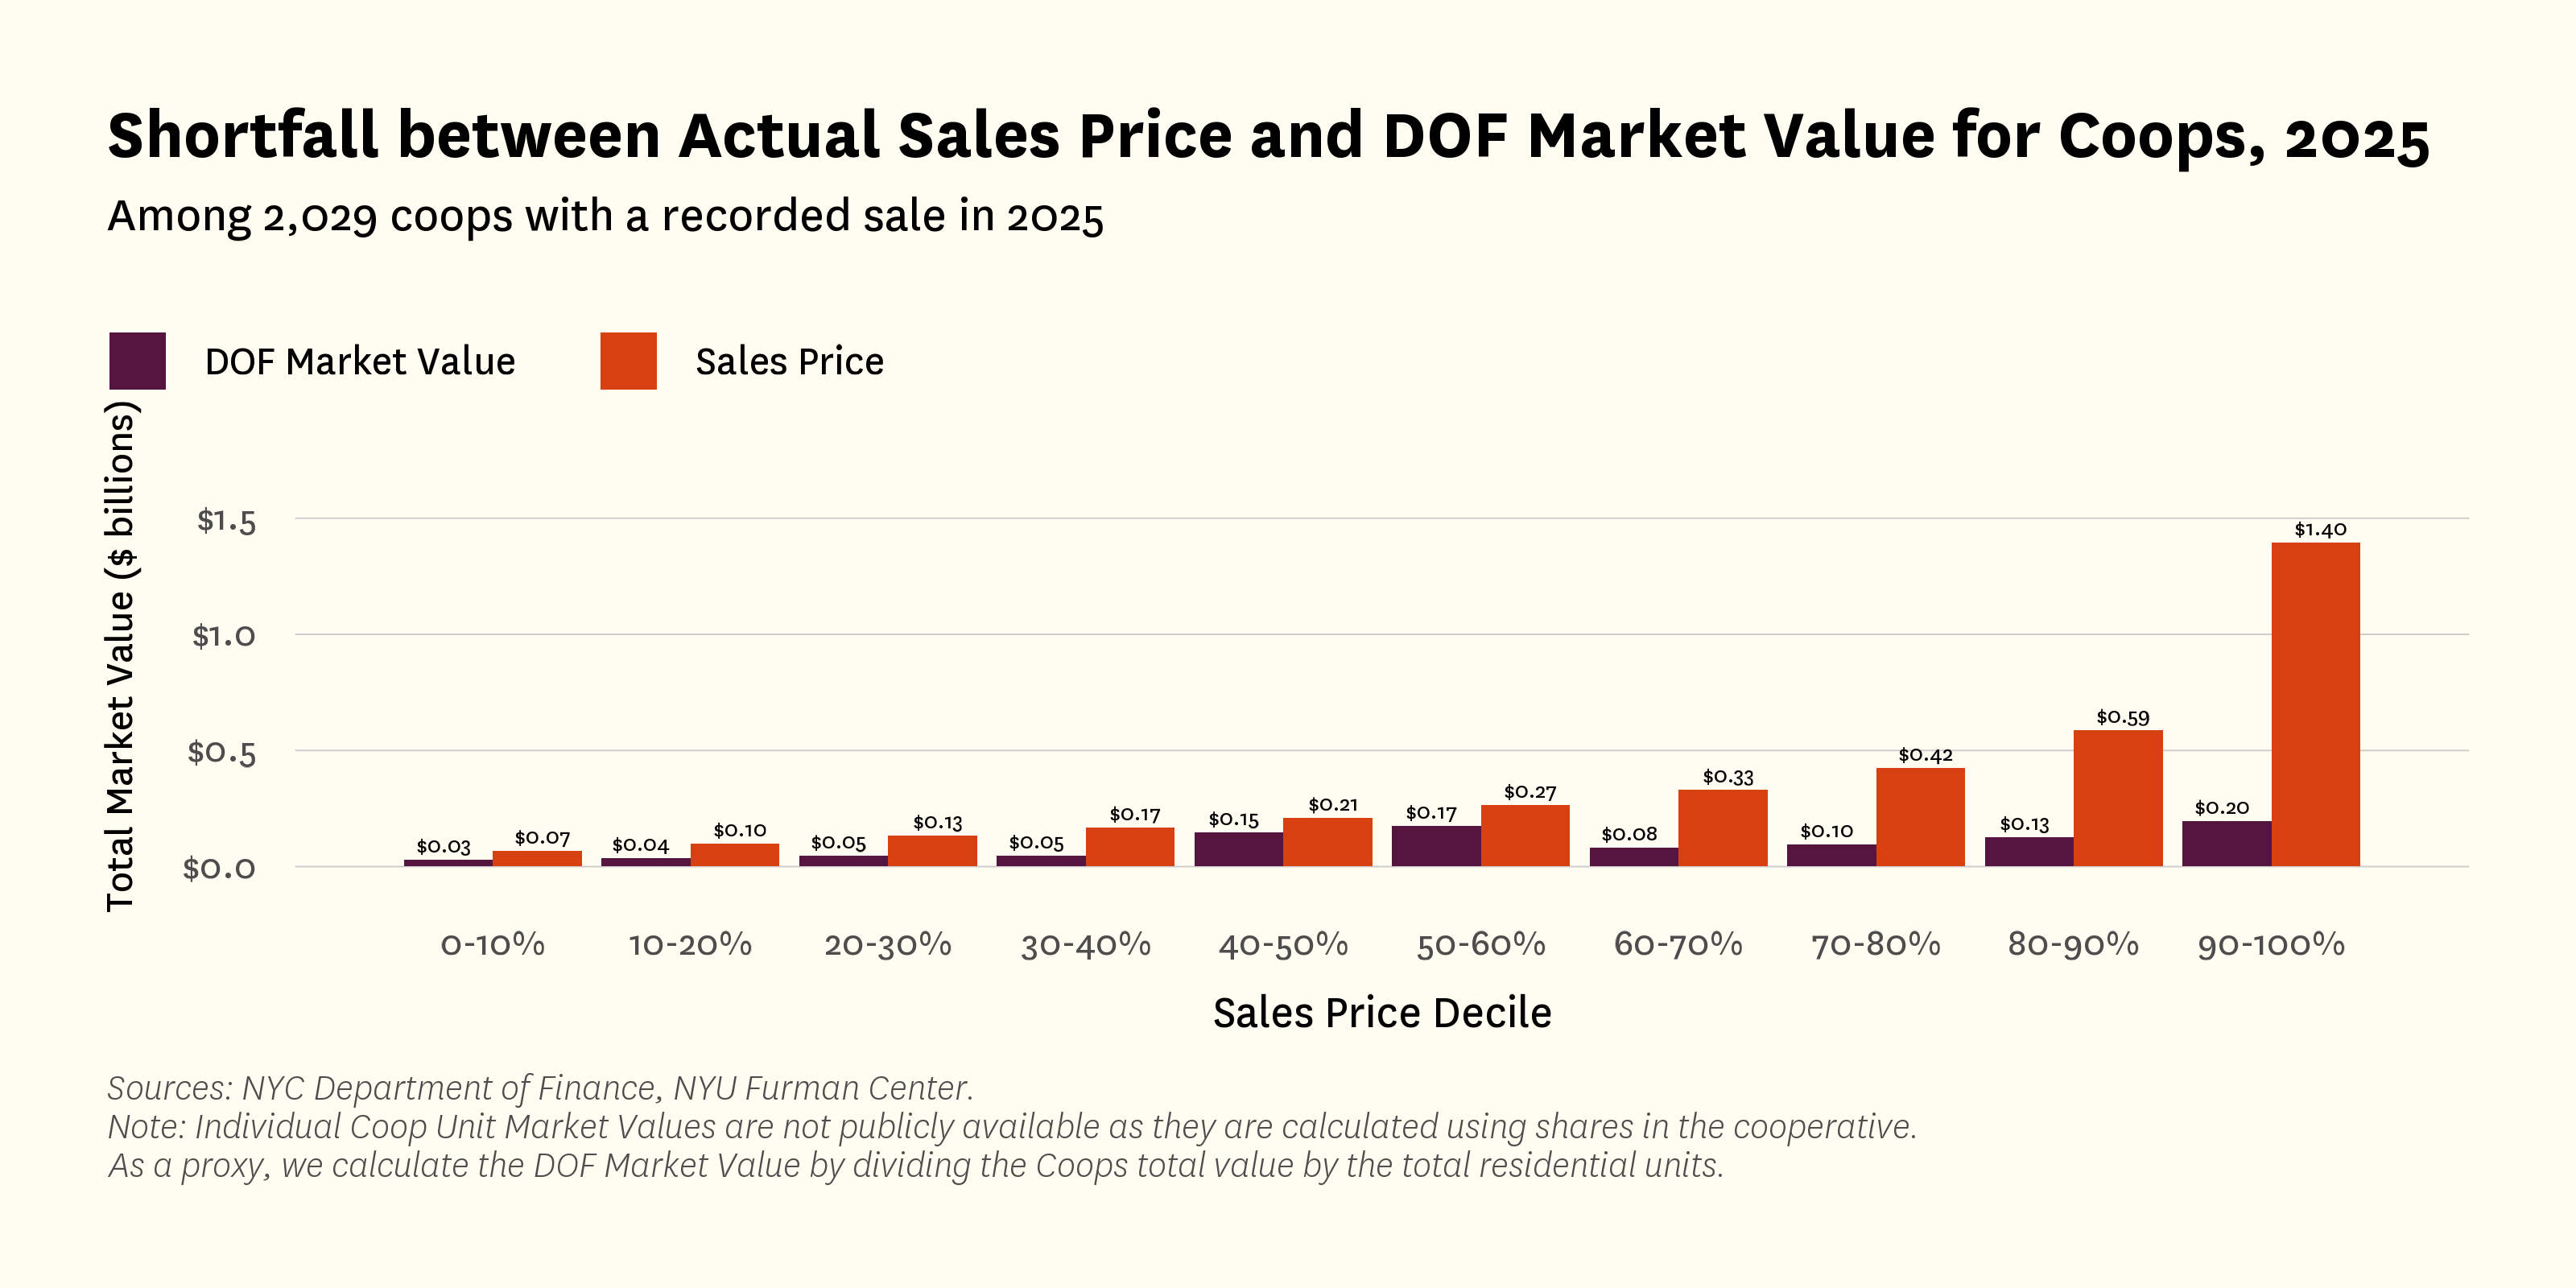
Figure 6 shows that in the top decile by price of highest condo sales (condos that sold for more than $3.8 million), DOF’s assessed value was 17 percent of the properties’ sales price while in the bottom decile by price of condos, DOF’s assessed value was 27 percent of the properties’ sales prices.
Figure 6:
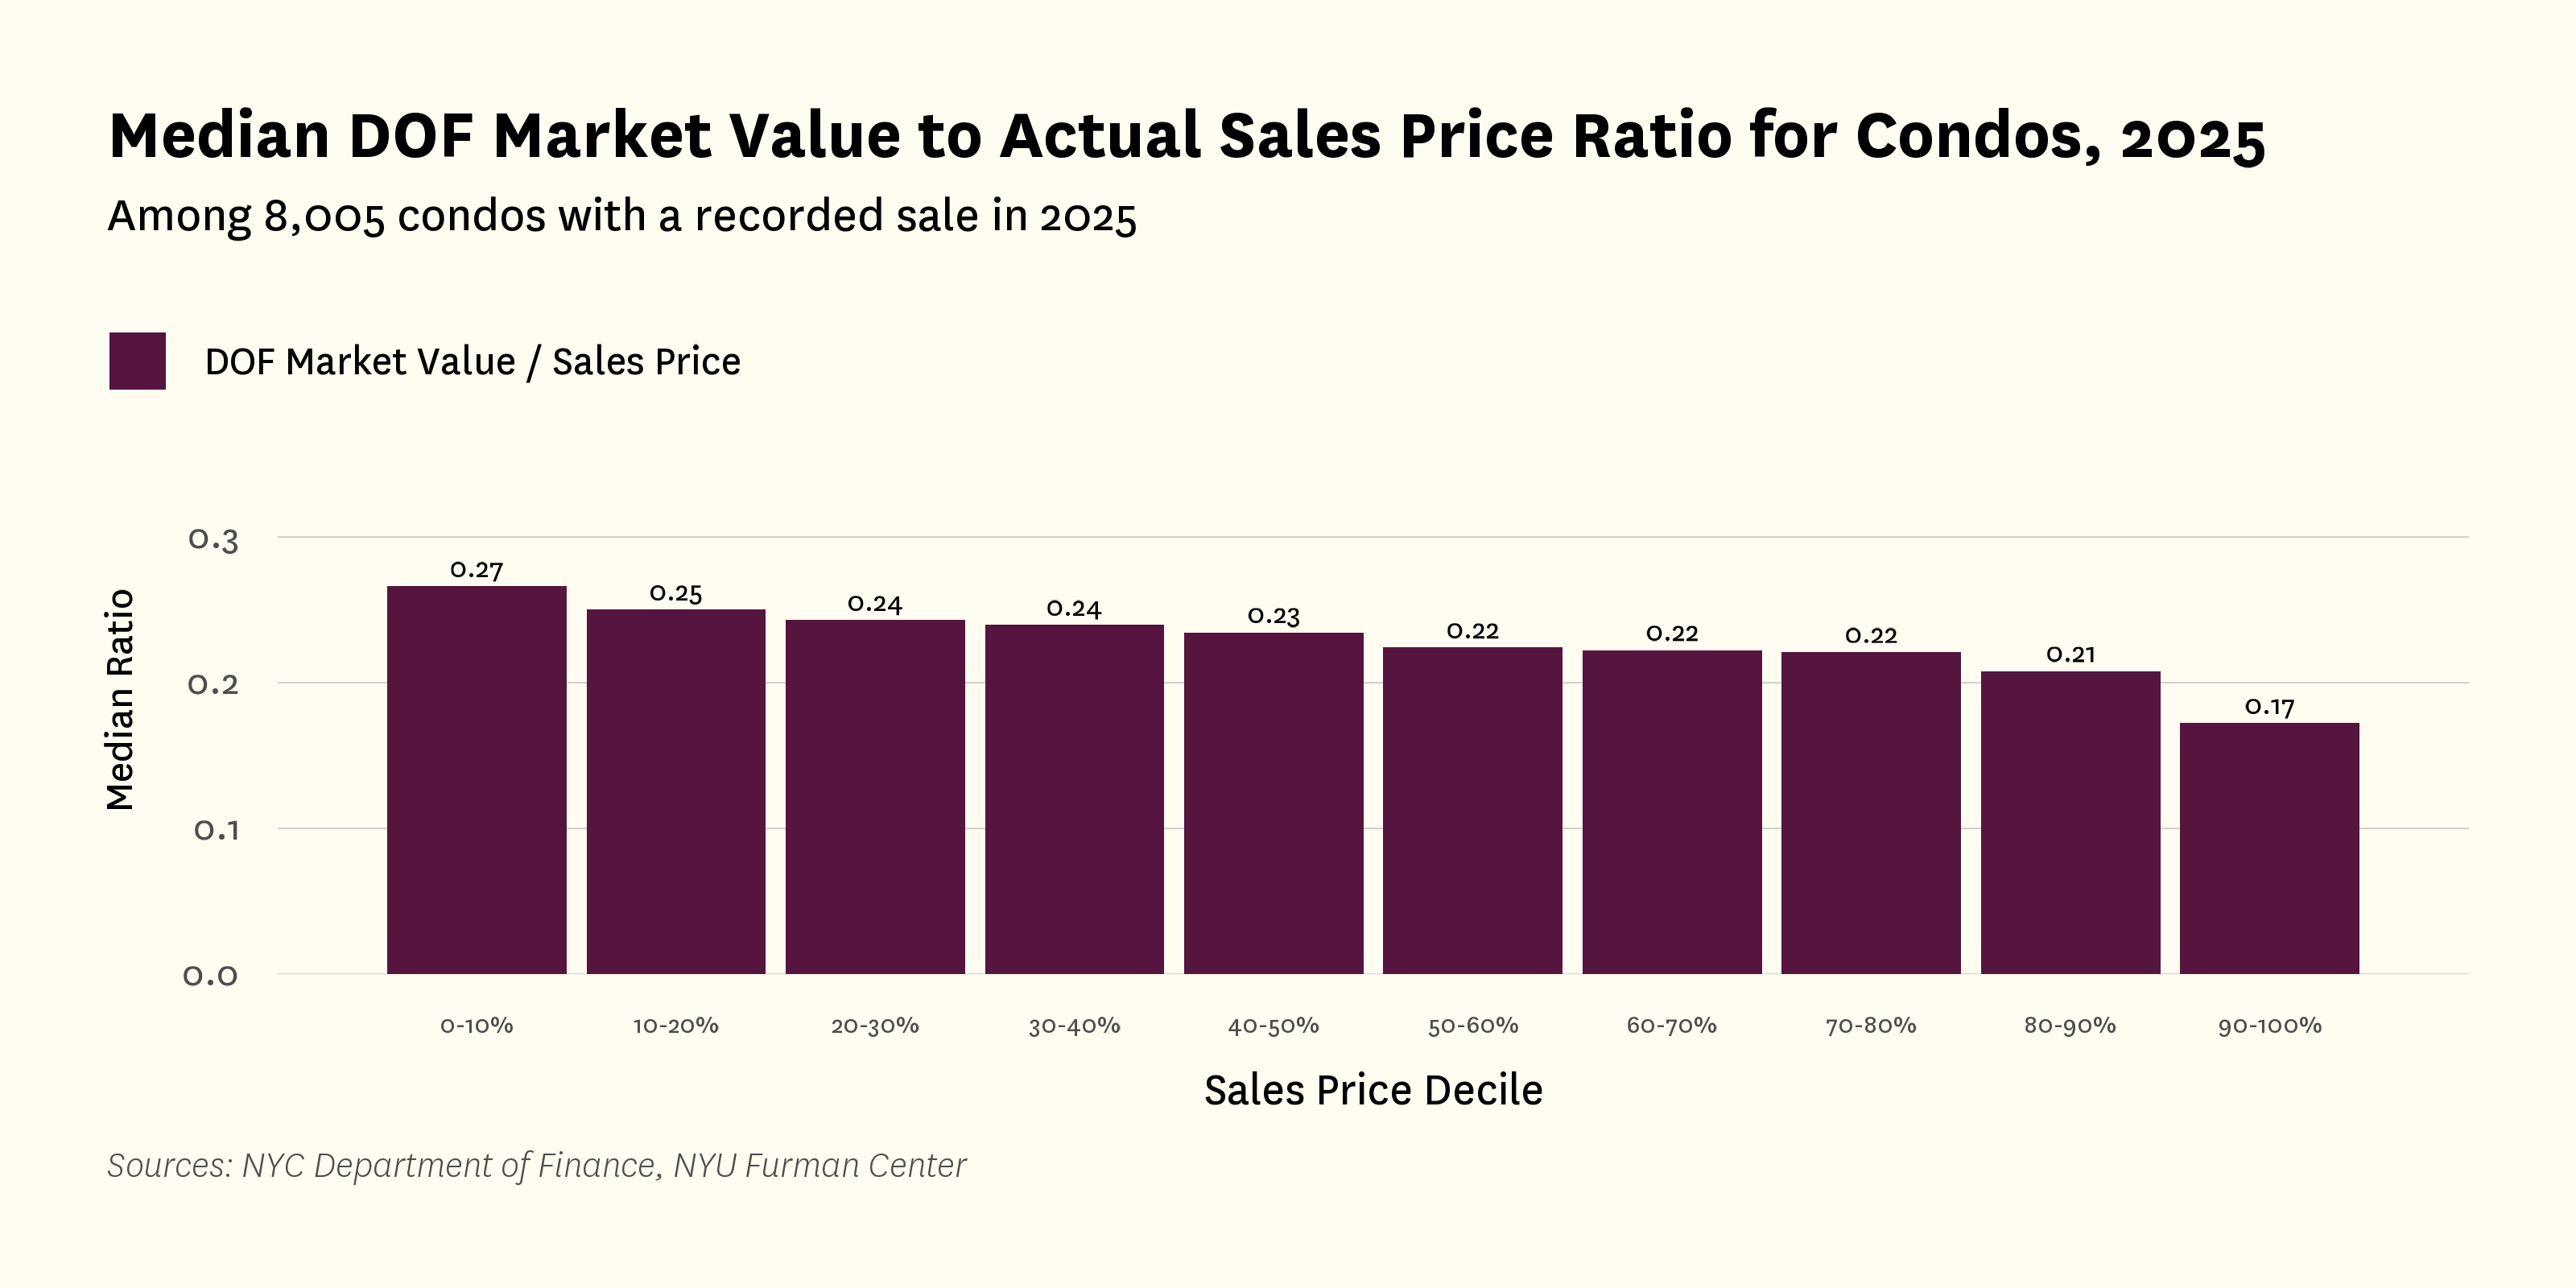
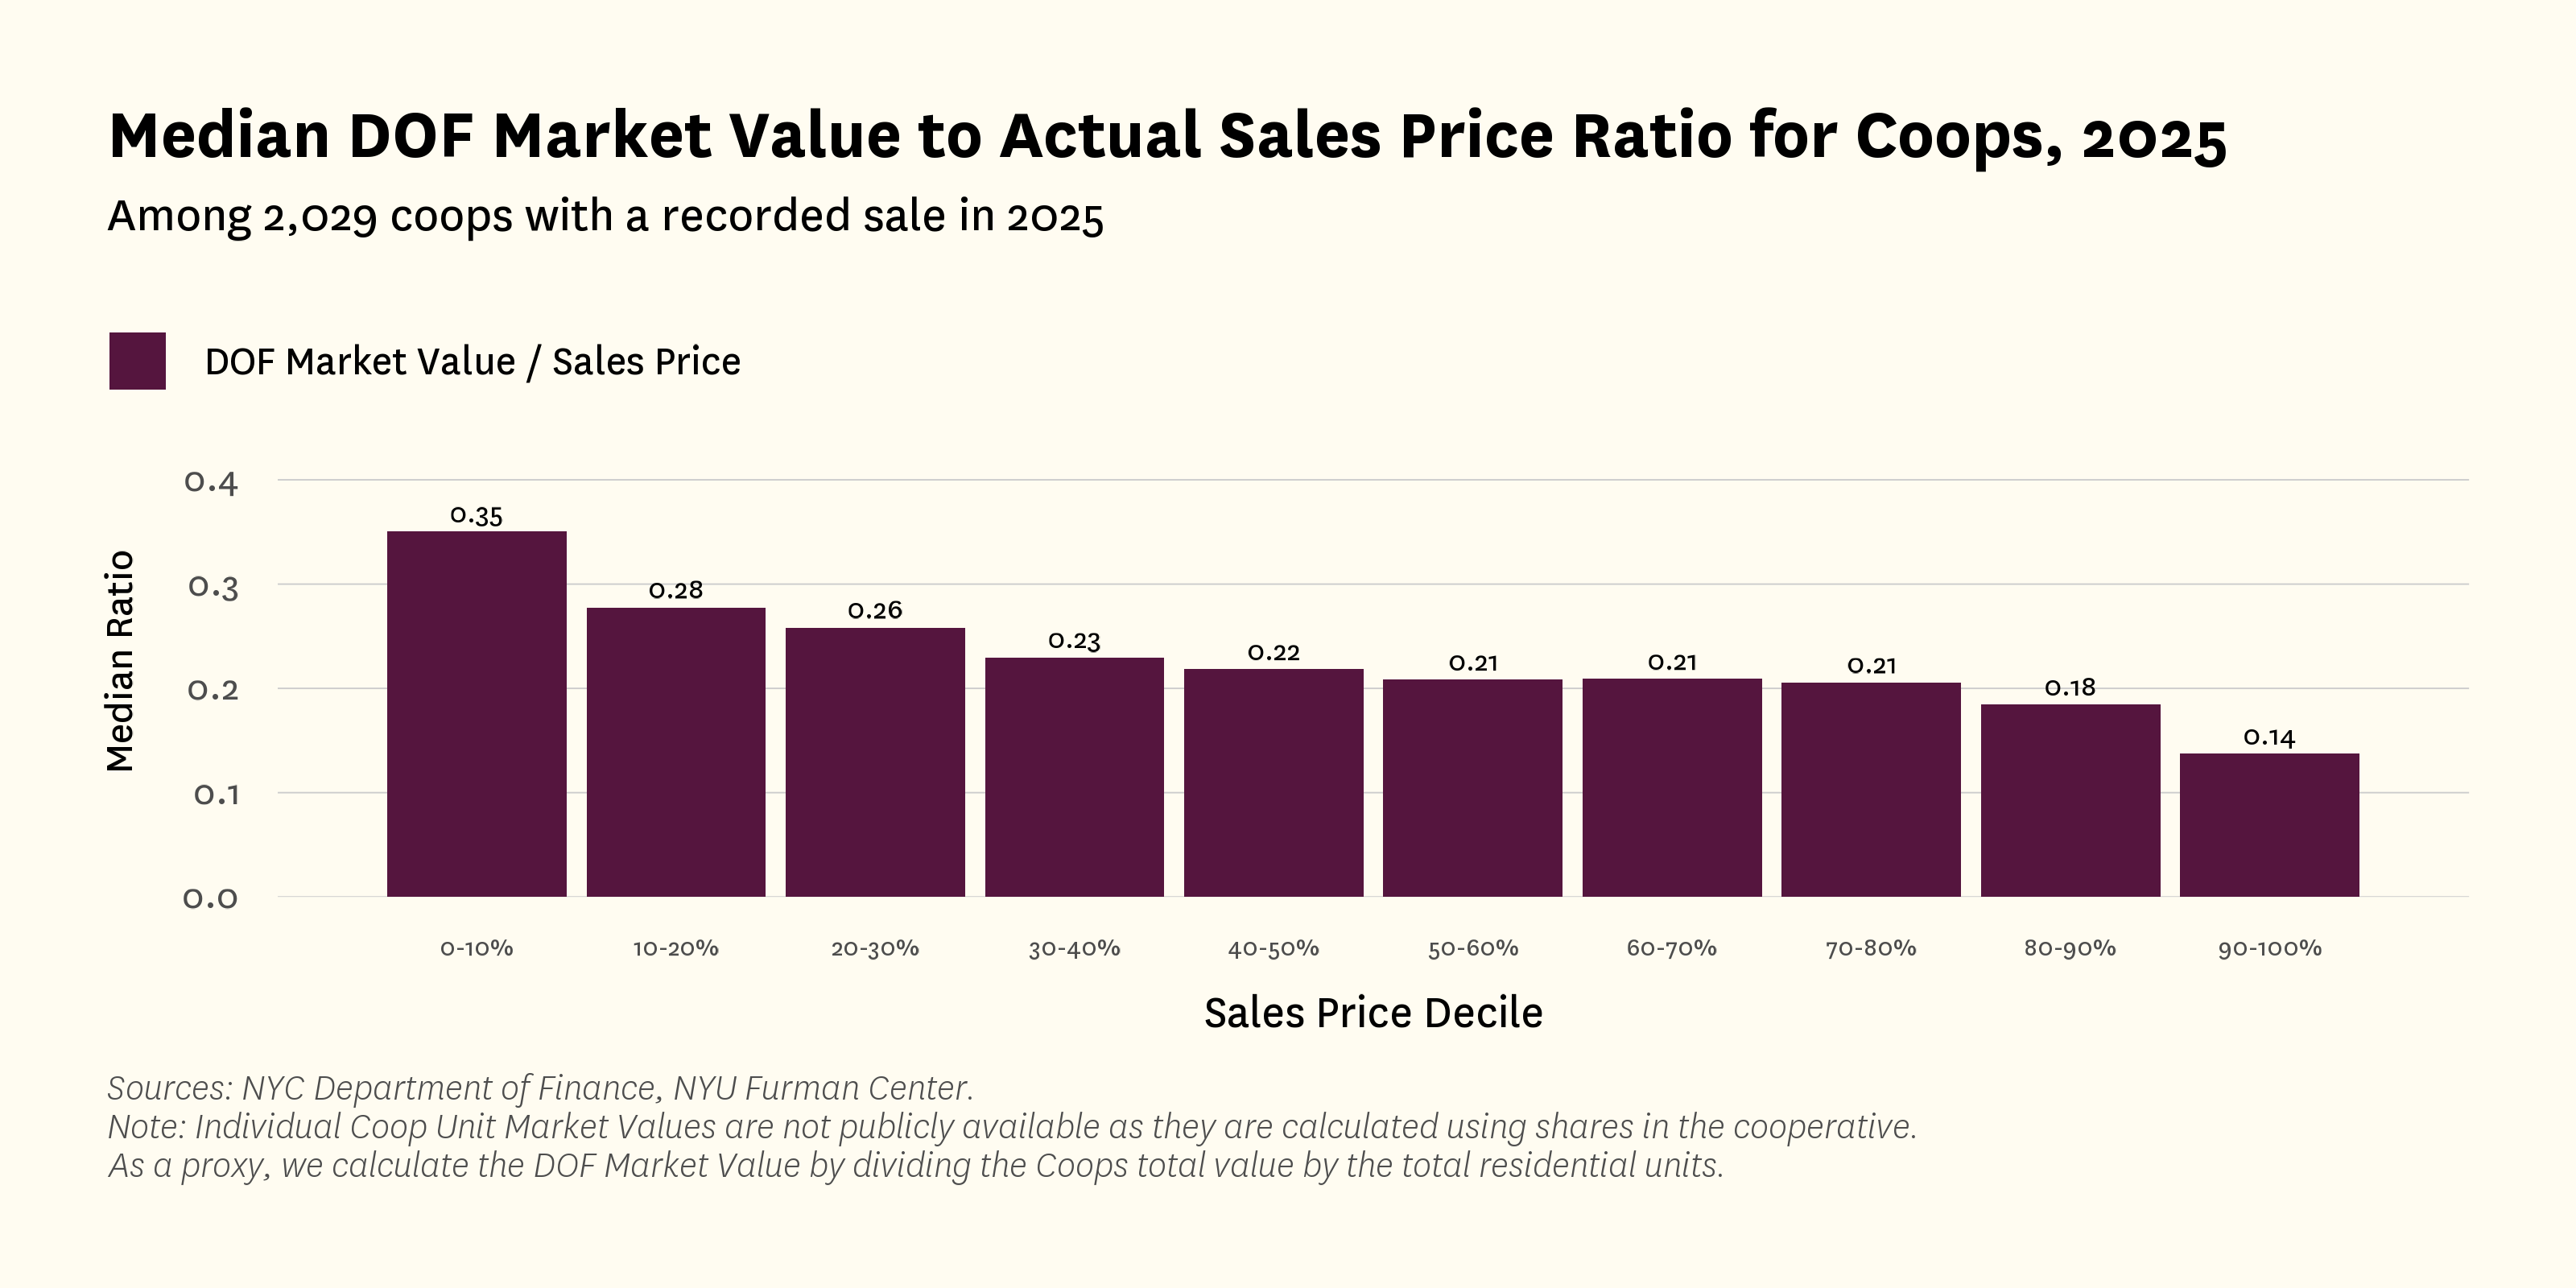
Figure 7 shows that for the highest decile by price of coop sales (coops that sold for more than $3.5 million), DOF’s assessed value was 14 percent of the properties’ sales prices.5 Conversely, within the bottom decile by price of coops, DOF’s assessed value was 35 percent of the properties’ sales price.
Figure 7:
Different types of Class 2 properties are geographically concentrated in different neighborhoods.
Some neighborhoods, like Washington Heights-Inwood in upper Manhattan, Fordham/Bedford Park/Norwood in the northwest Bronx, and Flatbush/Midwood in central Brooklyn, have a high concentration of rental units but fewer condos or coops relative to other neighborhoods. Core Manhattan below 96th Street (in particular the Upper West Side and the Upper East Side), and to a lesser extent parts of Brooklyn and Queens, contain most of the City’s condos and coops.
Figure 8:
Coop and condo sales prices vary considerably across neighborhoods and so neighborhoods will be affected differently if the City transitioned to a sales-based market value. Indeed, core Manhattan’s coops and condos, being generally the highest priced, benefit the most from the use of an income-based instead of a sales-based valuation method.
In addition, we found geographic disparities for condos and coops when we calculated the difference between the ETR based on the 2025 sales prices and the ETR using that same property’s DOF market value. Using a sales price to calculate condos’ and coops’ ETRs instead of the DOF market value causes the ETR to decline most substantially in Manhattan below 96th street.6 This geographic distribution tracks our finding that higher-end coops and condos benefit most from the underestimated DOF market values, since these properties tend to be concentrated in core Manhattan. As a result, when we switch to a sales-based market value, we see that core Manhattan’s coops and condos see steeper declines in their effective tax rates.
Figure 9:
a. Key Takeaways
Underestimating the values of coops and condos results in those properties paying a smaller share of the total tax levy than they would relative to their real market value, while larger rentals pay more. As Figure 10 shows, although coops and condos make up a combined 52 percent of the 2021 sales-based market values within Class 2 properties, they only paid 42 percent of the Class 2 tax levy. In comparison, larger rentals represented 32 percent of the 2021 sales-based market value and paid 44 percent of the levy. Further, higher value coops and condos benefit the most from DOF’s underestimation of values within Class 2.
Figure 10:
Footnotes
- [1] The share of the tax levy and the share of the DOF market value should be roughly aligned because we are not including abatements, and there are no caps on assessed value. As a result, the levy is essentially a calculation of the market value, multiplied by the 45 percent assessment ratio and then multiplied by a uniform tax rate.
- [2] Figures 1 and 2 rely on data from the 2021 New York City Advisory Commission on Property Tax Reform’s final report, which includes sales-based market values provided by DOF, and allows for consistent comparisons across Class 2 property types. We rely on DOF’s sales-based market values and do not estimate our own 2025 values for rental properties because so few rental properties sold that year. As a result, the sales sample might not provide a statistically reliable basis for estimating values across the rental subclass as a whole.
- [3] Note: the 2025 DOF market value relies on RPIE filings that use income and expenses from the year 2023 adjusted forward by DOF. The sales prices represent actual condo and coop sales from 2025.
- [4] New York City Advisory Commission on Property Tax Reform. (2021). The road to reform: A blueprint for modernizing and simplifying New York City’s property tax system. https://www.nyc.gov/assets/propertytaxreform/downloads/pdf/final-report.pdf
- [5] Note: this analysis contains coops from buildings of all sizes, including both Class 2 and Class 2C properties. To estimate the DOF market value per unit, we divide a building’s total DOF market value by its total number of units. This produces an average value and does not capture variation in unit prices within a building.
- [6] The top 25 percent of community districts in terms of the amount of the decline in condos and coops ETR when using actual sales includes eight community districts in Manhattan – Morningside Heights/Hamilton Heights, the Upper West Side, the Upper East Side, Chelsea/Hell’s Kitchen, Midtown/Flatiron/Union Square, East Midtown/Murray Hill, Greenwich Village/SoHo, and the Financial District/Tribeca. Four community districts in the outer boroughs are also included in the top 25 percent of community districts but, with the exception of Forest Hills/Rego Park, all of those community districts also had fewer than 100 actual sales.